 Minimum wage
 Corporate power
 Child labor
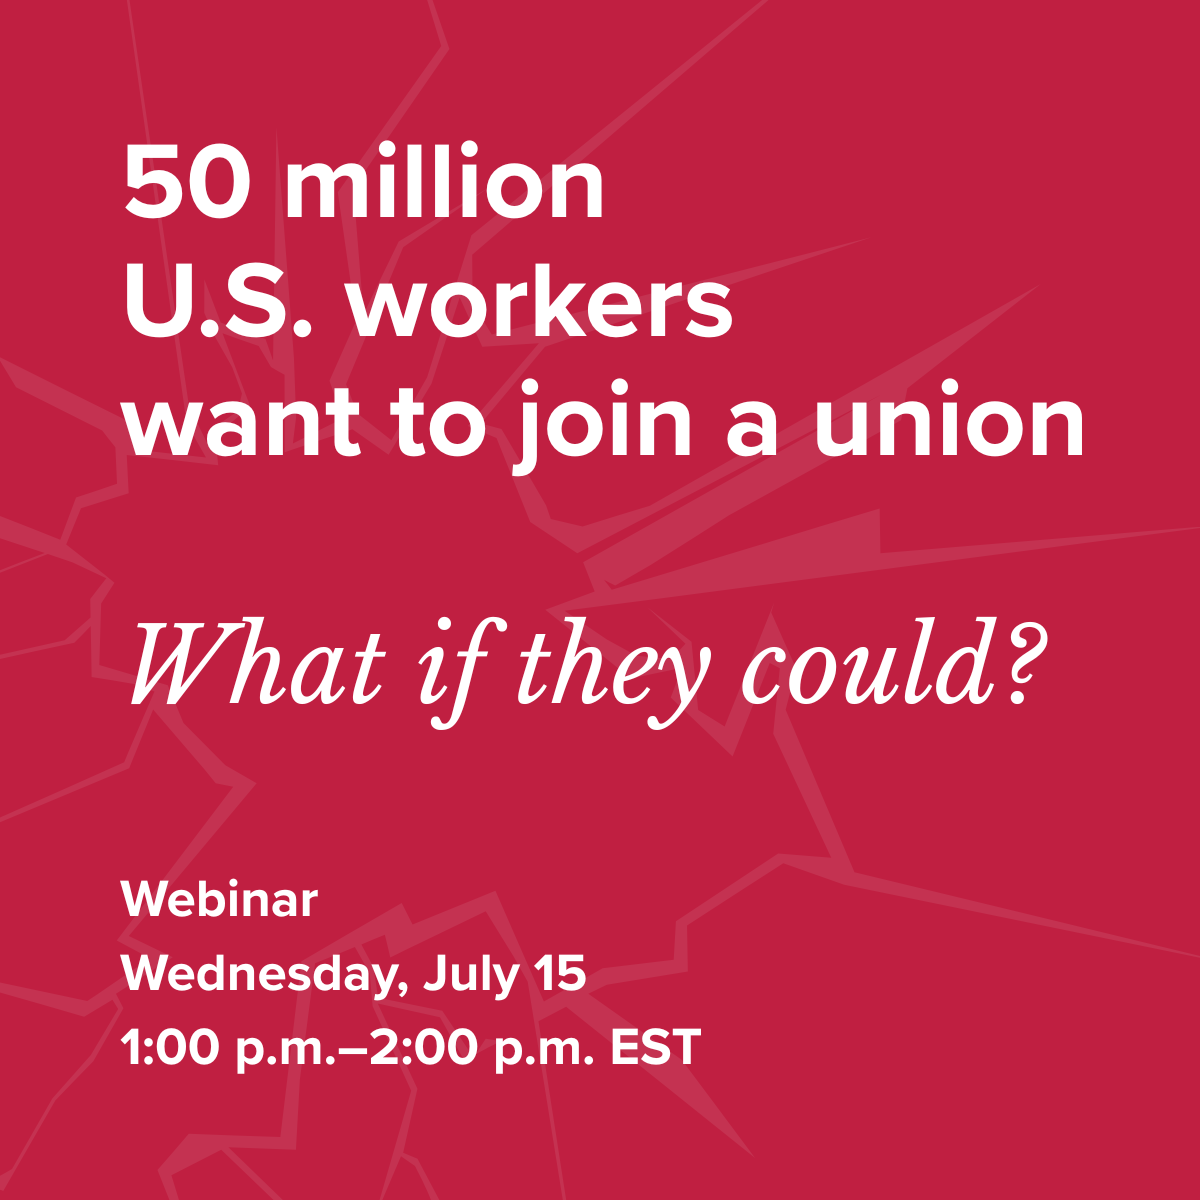
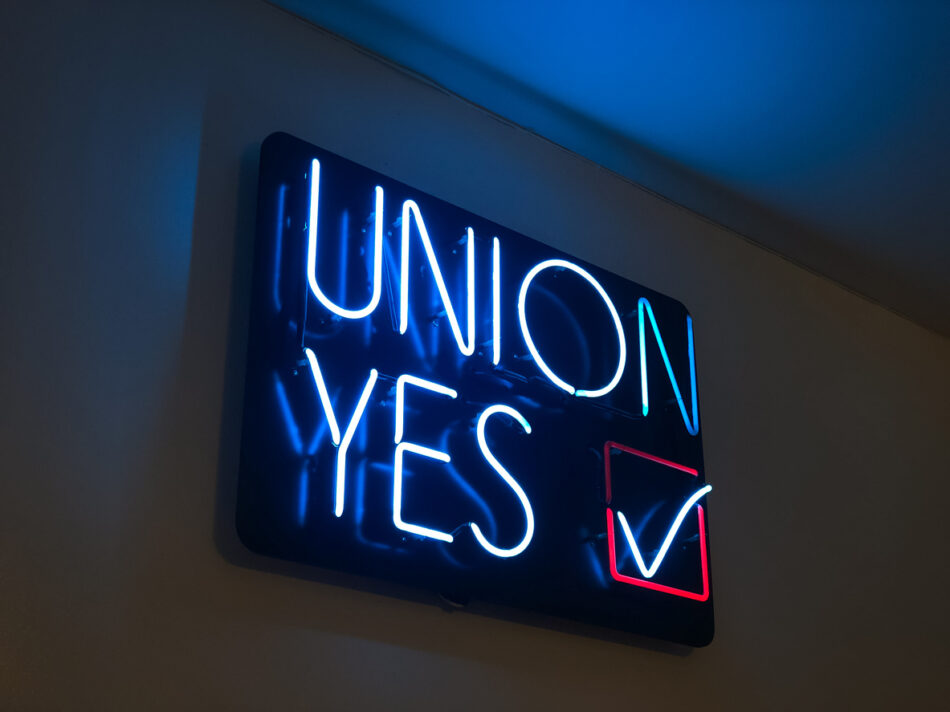 Unions
Latest Research
-
Myths vs. facts about the minimum wage: An FAQ on the economics of increasing wage floors
-
Setting high standards for a federal minimum wage: Raising the wage to two-thirds of the national median wage would lift pay for nearly 40 million workers
-
U.S. employers spend more than $1.5 billion annually on union avoidance
-
The Trump agenda has harmed the D.C. regional economy. Other regions should brace for impact.: Economic data from the first year of the president’s second term show declining employment, increased unemployment, and lagging private-sector growth.
-
More than 40 organizations call on Congress to center workers in federal AI legislation
Blog
-
Industry groups find a back door to weakening child labor protections in Ohio, after years of bipartisan opposition: States must continue to resist coordinated, industry-backed attacks
-
Medicaid and SNAP cuts will harm students and local economies
-
Arkansas county’s ARPA troubles are the exception that proves the rule: Fiscal relief funds provided to state and local governments during the pandemic were a wise investment
-
USMNT team soars, job growth does not
-
Immigration enforcement won’t just hurt immigrants—it will follow their classmates into public schools too
-
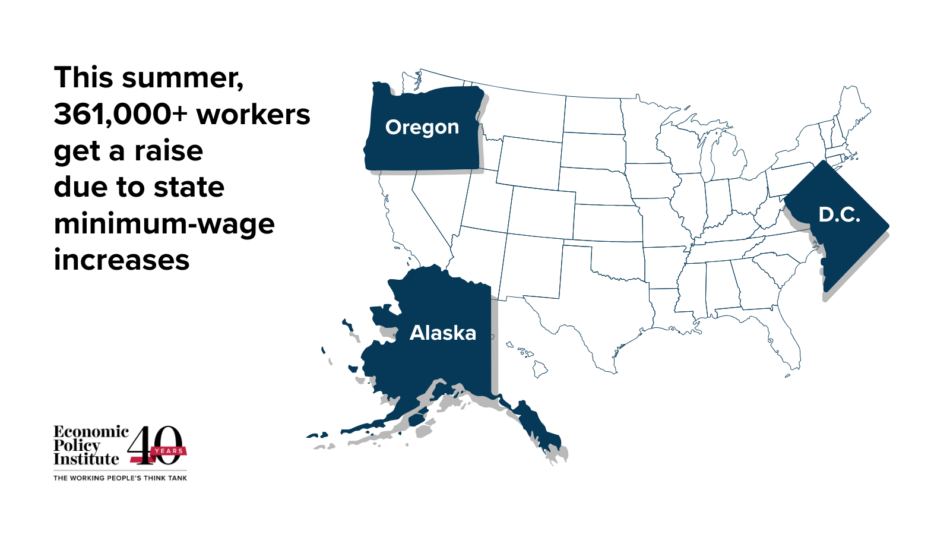
Seventeen states and localities are increasing their minimum wage this July
-
Trump’s war in Iran has wiped out 1.5 years of wage growth
EPI in the news
-
McKnight’s Senior Living | July 13, 2026
-
McKnight’s Senior Living | July 13, 2026
-
Stateline | July 13, 2026
-
Blavity | July 13, 2026
-
Forbes | July 13, 2026
-
Boston Globe | July 13, 2026
-
Atlanta Black Star | July 13, 2026