Full Report
During the transition between the Trump and Biden presidential administrations, we published an analysis of enforcement of federal wage and hour laws in agriculture by the U.S. Department of Labor’s Wage and Hour Division (WHD) (along with coauthor Zach Rutledge), to inform the incoming Biden administration about past federal enforcement efforts in agriculture and to suggest changes to better protect farmworkers.1 We hosted an event to discuss the report, with a panel of invitees that included the head of WHD during the Obama administration and the leader of one of the two major farmworker unions in the United States.2 All agreed that the Biden administration should take further action to protect farmworkers. Despite this consensus, two years later, our new analysis finds that federal labor standards enforcement efforts to protect farmworkers have in fact slid backward, with the number of investigations falling even further behind the already record-low levels during the years of the Trump administration.
The WHD protects the rights of all workers in the United States, including migrants employed as farmworkers through the H-2A visa program who fill temporary and seasonal farm jobs. WHD enforces laws that protect workers regardless of their immigration status and can order employers to pay back wages owed to farmworkers, even if workers are undocumented or otherwise not authorized to be employed in the United States. WHD enforcement aims to ensure that the rights of workers are protected and to level the playing field for employers, so that violators who underpay workers or engage in other exploitative or illegal behavior to cut labor costs do not gain a competitive advantage over law-abiding employers.
Wage and hour enforcement is especially important in agriculture, an industry where wages are already low and half of crop workers are unauthorized immigrants. The 300,000 farmworkers employed through the H-2A program can lose their right to be in the United States if they are fired or otherwise lose their jobs because their work authorization is tethered to their employer.3 Many farmworkers are not aware of their labor and employment rights, and even when they know their rights, many are reluctant to complain of labor and employment law violations for fear of retaliation based on their immigration status.
In our 2020 report, we found that farm employers violated the law in over 70% of the investigations that WHD conducted in the agricultural industry.4 This high rate of violations combined with the vulnerability of farmworkers help justify our calls for additional federal efforts to protect farmworkers. However, the latest data show that during the first full fiscal year of the Biden administration, fiscal year 2022, the number of investigations of farms closed by WHD dropped to a record low of 879—the lowest number on record and fewer than any year during the Trump administration, when at least 1,036 investigations a year were closed.
This report evaluates the significance of these latest enforcement data. President Biden nominated Julie Su for Labor Secretary5, and we hope the analysis provided here can assist the next secretary and the Department of Labor to improve and expand its efforts to protect the farmworkers across the United States who pick the crops and tend to the livestock that feed every American. Farmworkers are often doing this critical work in difficult and dangerous conditions, all while earning some of the lowest wages in the entire U.S. labor market, with a national average wage of just $16.62 per hour.6
(For this report, we did not assess the possible impacts of the COVID-19 pandemic on the work carried out by WHD during the final fiscal year of the Trump administration and the first two fiscal years of the Biden administration. Insufficient data or other indicators are available to determine whether, for example, the decline in the number of investigations of agricultural employers was attributable to pandemic-related effects resulting from lockdowns and social distancing mandates.)7
Summary of findings, conclusions, and recommendations
The following is a summary of the findings in this report:
- The number of federal inspections of employers by the Wage and Hour Division of the U.S. Department of Labor hit a record low in fiscal year 2022 under the Biden administration, at just 879—an average of 73 per month, continuing its years-long decline.
- The low number of investigations means that most farms are never investigated by WHD; fewer than 1% of agricultural employers are investigated per year. However, as our previous report showed, when WHD does investigate an agricultural employer, 70% of the time, WHD detects wage and hour violations.
- Part of the reason there are so few agricultural investigations is that WHD is underfunded and understaffed. Despite a broad portfolio and a mandate to protect 165 million workers, WHD’s budget in 2022 was roughly similar to its budget in 2006.
- Another reason there are so few investigations is related to the number of WHD investigators, which is near its record low—at 810.
- The average number of WHD-covered workers in 2022 was 164.3 million, which amounts to 202,824 workers for every wage and hour investigator. Compare this to 1973, when there were 72,588 covered workers for every wage and hour investigator. Investigators are now responsible for almost triple the number of workers than in 1973 (2.8 times more).
- In comparing WHD enforcement in agriculture during the Trump administration and Biden administration so far, we found that the Biden administration in 2022 (its first complete fiscal year) detected fewer back wages owed to farmworkers than the average during the three full fiscal years of the Trump administration, but the Biden administration found more in back wages owed per worker and assessed more in civil money penalties.
- We reviewed the shares of total back wages owed and CMPs assessed (combined) by type of legal violation for the 2000–2022 period and found that H-2A violations accounted for nearly half (46%) of all back wages owed to farmworkers and CMPs assessed over the 23-year period.
- WHD investigations during the Trump administration found that H-2A violations accounted for roughly half of the back wages and CMPs owed by farm employers during 2017–2020, but the H-2A share rose to 73%, almost three-fourths, during the Biden administration. As a result, WHD investigations that find H-2A violations now account for the vast majority of back wages owed and CMPs assessed.
The following are summaries of the conclusions and recommendations discussed in the report:
- Inadequate staffing and funding at WHD are the major factors for the drop in the number of WHD investigations during the Biden administration, but an increase in the size of the H-2A program and complexity of H-2A investigations may also be contributing factors.
- The share of back wages and civil money penalties resulting from H-2A violations may have increased because the size of the H-2A program is growing, and WHD may have decided to prioritize H-2A cases. But there may also be practical reasons, for example, because H-2A applications create more of a paper trail that can assist WHD in enforcement, rather than having to rely on gathering information from farmworkers who may be reticent to speak out about workplace violations due to their immigration status and fear of retaliation. Another contributing factor may be that ever more employers of H-2A workers are farm labor contractors—nonfarm employers that act as staffing firms for farm employers—and have long been associated with high rates of wage and hour violations.
- Below are a few recommended actions that Congress and the Biden administration can take to protect farmworkers:
- Congress can appropriate more funding to WHD to hire more investigators and conduct more investigations.
- Absent more funding, WHD can better target currently available resources, issue larger fines and more significant sanctions, and more frequently utilize existing legal mechanisms to encourage compliance.
- Congress can pass a path to citizenship for unauthorized immigrant farmworkers, which would reduce their vulnerability by allowing them to exercise their workplace rights.
- The executive branch can explore ways to provide work authorization to unauthorized immigrant farmworkers through deferred action or parole, which would also reduce the vulnerability of unauthorized farmworkers by allowing them to exercise their workplace rights.
- To bolster protections from retaliation, WHD and other federal agencies should issue more letters and statements of interest in support of deferred action for farmworkers in labor disputes, under the recently clarified process at the Department of Homeland Security (DHS), and coordinate with DHS to facilitate quick adjudications.
- The Department of Labor (DOL) and DHS should explore and experiment with options to increase the mobility of H-2A workers, to reduce the indentured nature of the H-2A visa program, including for example, regulations allowing H-2A workers to more easily change employers.
- DOL should create a front-end screening process to prohibit employers from hiring through H-2A if they have a track record of violating wage and hour and labor laws.
- WHD should require H-2A program violators to submit certified payroll information periodically to give WHD early warning of potential violations.
- WHD should develop a mobile app for farmworkers to report their wages and hours, which could also provide workers with a way to anonymously report violations.
The number of federal wage and hour inspections continued to decline and hit a record low in 2022 under the Biden administration
This section analyzes WHD’s aggregate enforcement data. WHD conducted over 34,000 investigations in U.S. agriculture between fiscal years 2000 and 2022, an average of almost 1,500 per year (1,485). The WHD data we use represent investigations that were closed by year (meaning they have been concluded or resolved), which means that some cases may have begun in earlier fiscal years, and some that began in the current fiscal year are not included because they have not yet been closed.
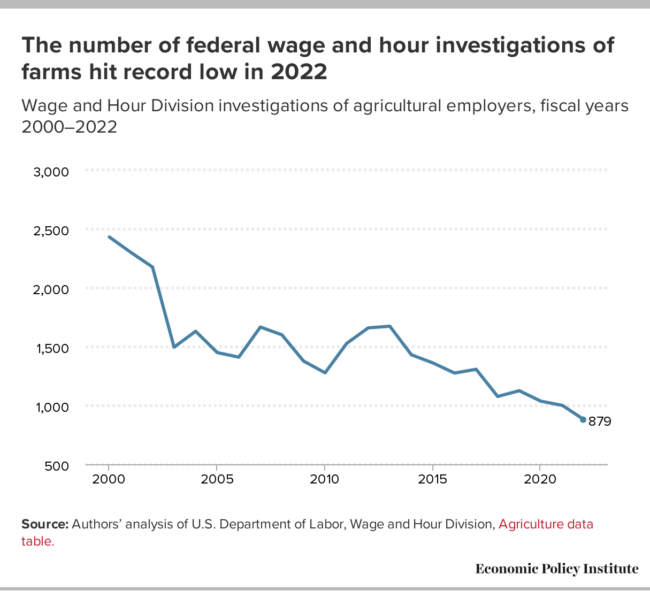
Figure A shows a clear downward trend in the number of closed WHD investigations of agricultural employers over the past two decades, from more than 2,000 a year in the early 2000s to 1,000 or fewer a year during the last two fiscal years, i.e., during the Biden administration. In 2022, WHD closed only 879 investigations of agricultural employers, an average of 73 a month, and just over a third of the 2,431 agricultural investigations closed in 2000, the peak year for WHD agricultural investigations.
The number of federal wage and hour investigations of farms hit record low in 2022: Wage and Hour Division investigations of agricultural employers, fiscal years 2000–2022
| Fiscal Year | Inspections of agricultural employers |
|---|---|
| 2000 | 2,431 |
| 2001 | 2,300 |
| 2002 | 2,176 |
| 2003 | 1,495 |
| 2004 | 1,630 |
| 2005 | 1,449 |
| 2006 | 1,410 |
| 2007 | 1,666 |
| 2008 | 1,600 |
| 2009 | 1,377 |
| 2010 | 1,277 |
| 2011 | 1,527 |
| 2012 | 1,659 |
| 2013 | 1,673 |
| 2014 | 1,430 |
| 2015 | 1,361 |
| 2016 | 1,275 |
| 2017 | 1,307 |
| 2018 | 1,076 |
| 2019 | 1,125 |
| 2020 | 1,036 |
| 2021 | 1,000 |
| 2022 | 879 |

Source: Authors’ analysis of U.S. Department of Labor, Wage and Hour Division, Agriculture data table.
Few investigations mean that most farms are never investigated by WHD
The Census of Agriculture (COA) reported over 513,000 U.S. farms with labor expenses for directly hired workers in 2017,8 and 112,134 agricultural establishments were registered with state unemployment insurance agencies in the third quarter of 2022, according to the Quarterly Census of Employment and Wages (QCEW).9
At 879 WHD-closed investigations of agricultural employers in 2022, and using the QCEW number of establishments in 2022 as a reference for the number of agricultural employers—which includes only farms registered in the unemployment insurance system—the probability that a farm will be investigated for violating federal wage and hour laws in a given year is less than 1%: 0.7%.10
Despite the low number of investigations, when WHD investigators inspect an agricultural employer, they nearly always detect violations of wage and hour laws. As we reported in 2020, WHD detects violations 70% of the time they conduct an investigation—a sign that many agricultural employers are violating the law. Among the 70% of investigations that detected violations between 2005 and 2019, almost 40% found one to four violations on the farm and 31% found five or more.11
DOL’s Wage and Hour Division is underfunded and understaffed
Why are there so few investigations of agricultural employers? A major reason is too little funding and staffing, a topic we have addressed before.12 The Wage and Hour Division is responsible for enforcing provisions of several federal laws related to minimum wage, overtime pay, child labor, federal contract workers, work visa programs, migrant and seasonal agricultural workers, family and medical leave, and more. Yet, despite this broad portfolio and the nearly 165 million workers who are covered by these protections,13 funding for WHD has not kept pace with the growth of the U.S. labor force.
Figure B shows that, in inflation-adjusted 2022 dollars, WHD’s budget in 2006 was $241 million, and in 2022, $246 million—an increase of just $5 million over nearly two decades. Lack of funding for WHD reflects the general decline in overall labor standards enforcement spending across the federal government from $2.4 billion in 2012 to $2.1 billion in 2021 (in 2021 dollars).14
In 2022, funding for the Wage and Hour Division was roughly the same as in 2006: Funding for the Wage and Hour Division in the U.S. Department of Labor, fiscal years 2006–2022
| Fiscal Years | Annual funding for the Wage and Hour Division |
|---|---|
| 2006 | $241,049,000 |
| 2007 | $245,012,000 |
| 2008 | $239,318,000 |
| 2009 | $263,988,000 |
| 2010 | $306,124,000 |
| 2011 | $296,769,000 |
| 2012 | $289,918,000 |
| 2013 | $270,742,000 |
| 2014 | $277,550,000 |
| 2015 | $280,988,000 |
| 2016 | $277,410,000 |
| 2017 | $271,569,000 |
| 2018 | $265,107,000 |
| 2019 | $262,106,000 |
| 2020 | $273,570,000 |
| 2021 | $265,686,000 |
| 2022 | $246,000,000 |
Note: Dollar amounts reported have been adjusted for inflation to constant 2022 dollars using the CPI-U-RS. As a result, the dollar amounts presented here may differ from the amounts reported in the source data.
Source: Department of Labor, Budget, Performance, and Planning reports, fiscal years 2008-2022, available at https://www.dol.gov/general/budget, accessed February 27, 2023.
Yet, in addition to the lack of funding and the nearly 165 million workers WHD has a mandate to protect, the number of WHD investigators that the agency employs, who are primarily responsible for ensuring that federal wage and hour laws are obeyed by employers across all 50 states and U.S. territories, is near an all-time low.
Figure C shows that there were only 810 WHD investigators at the end of November 2022 to enforce all federal wage and hour laws, two fewer than in 1973, the first year for which data are available, and 422 fewer than the peak year of 1978, when there were 1,232 WHD investigators. Meanwhile, the number of workers that WHD has a mandate to protect has increased sharply. The average number of WHD-covered workers in 2022 was 164.3 million, which amounts to 202,824 workers for every wage and hour investigator. Compare this to 1973, when there were 72,588 covered workers for every wage and hour investigator.15 Investigators are now responsible for almost triple the number of workers than in 1973 (2.8 times more).
Number of federal wage and hour investigators is near its historic low: Number of Wage and Hour Division investigators, U.S. Department of Labor, 1973–2022
| Year | Investigators on board at year’s end |
|---|---|
| 1973 | 812 |
| 1974 | 869 |
| 1975 | 921 |
| 1976 | 964 |
| 1977 | 980 |
| 1978 | 1,232 |
| 1979 | 1,087 |
| 1980 | 1,059 |
| 1981 | 953 |
| 1982 | 914 |
| 1983 | 928 |
| 1984 | 916 |
| 1985 | 950 |
| 1986 | 908 |
| 1987 | 951 |
| 1988 | 952 |
| 1989 | 970 |
| 1990 | 938 |
| 1991 | 865 |
| 1992 | 835 |
| 1993 | 804 |
| 1994 | 800 |
| 1995 | 809 |
| 1996 | 781 |
| 1997 | 942 |
| 1998 | 942 |
| 1999 | 938 |
| 2000 | 949 |
| 2001 | 945 |
| 2002 | 898 |
| 2003 | 850 |
| 2004 | 788 |
| 2005 | 773 |
| 2006 | 751 |
| 2007 | 732 |
| 2008 | 731 |
| 2009 | 894 |
| 2010 | 1,035 |
| 2011 | 1,024 |
| 2012 | 1,067 |
| 2013 | 1,040 |
| 2014 | 976 |
| 2015 | 995 |
| 2016 | 974 |
| 2017 | 912 |
| 2018 | 835 |
| 2019 | 780 |
| 2020 | 823 |
| 2021 | 782 |
| 2022 | 810 |
Note: Numbers represent Wage and Hour Division investigators on staff at the end of each fiscal year (the federal government's fiscal year runs from October 1 to September 30), except for 2022, which represents the number of investigators on staff at the end of November 2022.
Sources: Author’s analysis of Wage and Hour Division (WHD) data on number of investigators from unpublished Excel files provided by WHD staff members to the author. Source for 2020 and 2021 is Rebecca Rainey, “Wage-Hour Investigator Hiring Plans Signal DOL Enforcement Drive,” Bloomberg Law, January 28, 2022. Source for 2022 is Rebecca Rainey, "Wage Division Enforcement Declines Again in Wake of Hiring Woes," Bloomberg Law, Decemer 28, 2022.
Another issue related to the funding and staffing challenges has reportedly been WHD’s “issues with recruiting and retaining employees.” Bloomberg Law reported in December 2022 that WHD has “struggled to recruit new investigative staff” and WHD’s overall back wages recovered, employees who received back wages, and total number of hours spent on investigations “all dropped in fiscal year 2022 compared to the year prior” according to WHD data.16 Despite WHD’s stated intention to hire 100 new investigators in the Biden administration, a heavy workload and inadequate funding from Congress appear to be hindering WHD from hiring enough staff for the tasks at hand.
So far, the Biden administration has detected fewer back wages owed to farmworkers but assessed more civil money penalties than the averages during the Trump administration
Figure D shows the back wages owed and civil money penalties assessed in agriculture between 2000 and 2022. (Back wages are the amount that WHD assesses is due to be paid to the workers by their employers as the result of an investigation. Civil money penalties, or CMPs, are additional monetary fines levied by WHD to punish and deter employers from violating wage and hour laws.) Both back wages and CMPs have been on a generally upward trend over the 23-year period, although there was a significant dip in back wages in 2022. Back wages peaked at $9.7 million in 2013 during the Obama administration, the same year that civil money penalty assessments peaked at $9.2 million. (All amounts are adjusted to constant 2022 dollars.)
Back wages owed and civil money penalties assessed in agriculture have been on a generally upward trend since 2000: Back wages and civil money penalties assessed (in millions of dollars) against agricultural employers by the Wage and Hour Division, fiscal years 2000–2022
| Fiscal year | Back wages | Civil money penalties |
|---|---|---|
| 2000 | $2.27 | $2.34 |
| 2001 | 2.86 | 2.09 |
| 2002 | 3.31 | 1.93 |
| 2003 | 3.89 | 1.81 |
| 2004 | 1.89 | 2.57 |
| 2005 | 2.00 | 1.60 |
| 2006 | 2.46 | 1.18 |
| 2007 | 4.51 | 2.04 |
| 2008 | 2.88 | 1.84 |
| 2009 | 1.92 | 1.72 |
| 2010 | 4.24 | 1.48 |
| 2011 | 3.72 | 2.53 |
| 2012 | 6.73 | 5.84 |
| 2013 | 9.67 | 9.18 |
| 2014 | 5.57 | 3.83 |
| 2015 | 5.33 | 6.25 |
| 2016 | 5.91 | 4.31 |
| 2017 | 6.03 | 5.18 |
| 2018 | 4.90 | 7.63 |
| 2019 | 6.94 | 7.24 |
| 2020 | 8.11 | 7.25 |
| 2021 | 9.12 | 7.89 |
| 2022 | 5.82 | 7.98 |
Note: Dollar amounts reported have been adjusted for inflation to constant 2022 dollars using the CPI-U-RS. As a result, the dollar amounts presented here may differ from the amounts reported in the source data.
Source: Authors’ analysis of U.S. Department of Labor, Wage and Hour Division, Agriculture data table (last accessed February 26, 2023).
To compare enforcement during the Trump and Biden years, we looked at the past six fiscal years. The federal government’s fiscal year runs from October 1 to September 30 of the following calendar year—for example, the 2024 fiscal year begins on October 1, 2023, and ends on September 30, 2024. Any new presidential administration begins in late January, four months into the fiscal year. Hiring new agency staff and implementing the administration’s priorities can take half or more of the first fiscal year of a presidential term.17 Given this reality, while we first compare WHD data for all fiscal years during the Trump and Biden administrations, we then make comparisons that exclude the first fiscal years of the Trump and Biden administrations, comparing averages of the second through third years of the Trump administration with the second year of the Biden administration.
As Table 1 shows, during the four Trump years, WHD found that $26 million in back wages were owed to 36,466 farmworkers, an average of $6.5 million owed to an average of 9,117 farmworkers a year, and an average $717 owed per affected farmworker. By contrast, during the first two years of the Biden administration, Table 2 shows that a total of $15 million in back wages was owed to 18,639 farmworkers in 2021 and 2022, an average of $7.5 million owed to an average of 9,320 farmworkers per year, an average $791 per worker. There were 1,136 farm investigations per year on average under Trump, and 940 investigations per year under Biden.
The average of $791 in back wages owed to each farmworker during the first two years of the Biden administration was $74 more per farmworker compared with the four-year average during the Trump administration. An average of just over 200 more farmworkers per year were owed back wages during the first two years of the Biden administration compared with the average during the Trump administration.
Wage and hour enforcement on farms during the Trump administration: Number of investigations in agriculture, employees receiving back wages, total back wages assessed, back wages per employee, and civil money penalties, fiscal years 2017–2020
| Fiscal Year | Number of investigations in agriculture | Employees receiving back wages | Back wages assessed (2022$) | Average back wages per employee (2022$) | Civil money penalties assessed (2022$) |
|---|---|---|---|---|---|
| 2017 | 1,307 | 7,304 | $6,025,286 | $825 | $5,181,588 |
| 2018 | 1,076 | 9,015 | $4,903,710 | $544 | $7,627,158 |
| 2019 | 1,125 | 8,972 | $6,937,131 | $773 | $7,244,715 |
| 2020 | 1,036 | 11,175 | $8,108,569 | $726 | $7,248,539 |
| TOTALS | 4,544 | 36,466 | $25,974,697 | – | $27,302,000 |
| AVERAGE ANNUAL | 1,136 | 9,117 | $6,493,674 | $717 | $6,825,500 |
Note: Dollar amounts reported have been adjusted for inflation to constant 2022 dollars using the CPI-U-RS. As a result, the dollar amounts presented here may differ from the amounts reported in the source data.
Source: Authors’ analysis of U.S. Department of Labor, Wage and Hour Division, Agriculture data table (last accessed February 26, 2023).
Wage and hour enforcement on farms during the first two years of the Biden administration: Number of investigations in agriculture, employees receiving back wages, total back wages assessed, back wages per employee, and civil money penalties, fiscal years 2021–2022
| Fiscal Year | Number of investigations in agriculture | Employees receiving back wages | Back wages assessed (2022$) | Average back wages per employee (2022$) | Civil money penalties assessed (2022$) |
|---|---|---|---|---|---|
| 2021 | 1,000 | 10,379 | $9,107,258 | $877 | $7,887,306 |
| 2022 | 879 | 8,260 | $5,815,943 | $704 | $7,983,598 |
| TOTALS | 1,879 | 18,639 | $14,923,202 | – | $15,870,904 |
| AVERAGE ANNUAL | 940 | 9,320 | $7,461,601 | $791 | $7,935,452 |
Note: Dollar amounts reported have been adjusted for inflation to constant 2022 dollars using the CPI-U-RS. As a result, the dollar amounts presented here may differ from the amounts reported in the source data.
Source: Authors’ analysis of U.S. Department of Labor, Wage and Hour Division, Agriculture data table (last accessed February 26, 2023).
Next, we compare these data after excluding the first year of the Trump and Biden administrations. We compared the second year of the Biden administration with the second, third, and fourth years of the Trump administration (Table 3) and see that the average number of closed WHD investigations during 2018–2020 was 1,079, which was 200 more than the 879 in the second year of the Biden administration.
The WHD under Trump found an average $6.6 million a year in back wages owed to farmworkers during 2018–2020, while WHD in the second year of the Biden administration found that $5.8 million were owed to farmworkers, or $834,000 less. During 2018–2020, the WHD under Trump found that an average of 9,721 farmworkers a year were owed back wages, compared with 8,260 during the second year of the Biden administration, nearly 1,500 fewer. The average of $704 in back wages owed to each farmworker during the second year of the Biden administration was $20 more per farmworker than the annual average owed to each farmworker during 2018–2020 of the Trump administration.
There was a significant difference in CMPs assessed. Table 3 shows that during years two through four of the Trump administration, an average of $7.4 million a year in CMPs was assessed against agricultural employers, but in 2022 during the Biden administration, the WHD assessed $8 million in 2022, the second-highest amount on record, other than the peak year in 2013. The highest amount of CMPs during the Trump administration was in 2018 at $7.6 million. (It’s important to note that back wages and CMPs assessed by WHD have not necessarily been actually paid yet to farmworkers or to the federal government; they show what WHD investigations have assessed them as owed).
Comparing wage and hour enforcement in agriculture under the Trump and Biden administrations: Number of investigations in agriculture, employees receiving back wages, total back wages assessed, back wages per employee, and civil money penalties, fiscal years 2018–2020 and 2022
| Fiscal Year | Number of investigations in agriculture | Employees receiving back wages | Back wages assessed (2022$) | Average back wages per employee (2022$) | Civil money penalties assessed (2022$) |
|---|---|---|---|---|---|
| Trump administration | |||||
| 2018 | 1,076 | 9,015 | $4,903,710 | $544 | $7,627,158 |
| 2019 | 1,125 | 8,972 | $6,937,131 | $773 | $7,244,715 |
| 2020 | 1,036 | 11,175 | $8,108,569 | $726 | $7,248,539 |
| TOTALS 2018-20 | 3,237 | 29,162 | $19,949,410 | – | $22,120,412 |
| AVERAGE 2018-20 | 1,079 | 9,721 | $6,649,803 | $684 | $7,373,471 |
| Biden administration | |||||
| 2022 | 879 | 8,260 | $5,815,943 | $704 | $7,983,598 |
Note: Dollar amounts reported have been adjusted for inflation to constant 2022 dollars using the CPI-U-RS. As a result, the dollar amounts presented here may differ from the amounts reported in the source data. For the purposes of this comparison, data for the first fiscal year of the Trump and Biden administrations have been excluded (see discussion in text).
Source: Authors’ analysis of U.S. Department of Labor, Wage and Hour Division, Agriculture data table (last accessed February 26, 2023).
Violations in the H-2A visa program account for a growing share of back wages owed and civil money penalties assessed in agriculture—rising to nearly three-fourths during the Biden administration
WHD’s aggregate data on enforcement in agriculture list separately the violations detected when enforcing the three major federal employment laws and regulations covering farmworkers: (1) those that govern the H-2A visa program; (2) the Migrant and Seasonal Agricultural Worker Protection Act (commonly referred to as MSPA), the major federal law that protects U.S. farmworkers; and (3) the Fair Labor Standards Act (FLSA) along with all other wage and hour laws that WHD enforces.18 FLSA is the law that requires minimum wages and overtime pay and regulates the employment of workers younger than 18.
In order to have a better sense of which laws are being violated, we summed the back wages owed and the CMPs assessed for the 23-year period for which data are available (fiscal years 2000–2022), for violations of H-2A, MSPA, and FLSA et al. (FLSA plus all other violations).19 We divided the sum of back wages and CMPs under each law by the sum of total back wages and CMPs assessed by WHD for the entire 23-year period, which gave us the relevant shares of back wages and CMPs that correspond to each law. These calculations appear in Table 4. (Note that employers often violate several wage and hour laws at once; WHD categorizes cases by the three major laws, and they may overlap, but the sum of the three major categories corresponds closely with the total back wages and CMPs assessed by WHD.)
Violations of the H-2A visa program account for most of the back wages owed and civil money penalties assessed in agriculture: Share of total back wages owed and civil money penalties assessed by the Wage and Hour Division against agricultural employers, by type of legal violation, fiscal years 2000–2022
| Fiscal Year | H-2A | MSPA | FLSA et al. |
|---|---|---|---|
| 2000 | 8% | 36% | 54% |
| 2001 | 24% | 37% | 36% |
| 2002 | 12% | 36% | 49% |
| 2003 | 19% | 24% | 55% |
| 2004 | 11% | 42% | 41% |
| 2005 | 27% | 29% | 42% |
| 2006 | 11% | 31% | 56% |
| 2007 | 11% | 29% | 58% |
| 2008 | 31% | 31% | 37% |
| 2009 | 27% | 42% | 30% |
| 2010 | 17% | 23% | 59% |
| 2011 | 33% | 27% | 37% |
| 2012 | 52% | 18% | 30% |
| 2013 | 70% | 10% | 20% |
| 2014 | 41% | 22% | 36% |
| 2015 | 59% | 16% | 25% |
| 2016 | 44% | 20% | 36% |
| 2017 | 49% | 20% | 30% |
| 2018 | 47% | 31% | 22% |
| 2019 | 42% | 34% | 23% |
| 2020 | 52% | 17% | 30% |
| 2021 | 73% | 10% | 17% |
| 2022 | 73% | 11% | 16% |
| TOTALS | 46% | 22% | 31% |
Note: Values represent the share of total back wages and civil money penalties assessed by the Wage and Hour Division (WHD) in the U.S. Department of Labor in a given fiscal year, according to the three broad categories of laws listed by WHD. "H-2A" represents violations of the laws and regulations governing the H-2A visa program; "MSPA" represents the Migrant and Seasonal Agricultural Worker Protection Act (commonly referred to as MSPA), which is the major federal law that protects U.S. farmworkers, and "FLSA et al." represents the Fair Labor Standards Act (FLSA), which WHD data group with all other wage and hour laws that WHD enforces. FLSA is the U.S.’ main worker protection law that requires minimum wages and overtime pay and regulates the employment of workers younger than 18.
Source: Authors’ analysis of U.S. Department of Labor, Wage and Hour Division, Agriculture data table (last accessed February 26, 2023).
We found that violations of H-2A rules account for much higher shares of back wages owed and CMPs assessed than violations of other laws, and now account for an overwhelming share of the back wages owed and CMPs assessed.
Table 4 shows the shares of total back wages owed and CMPs assessed (combined) by type of legal violation for the 2000–2022 period. H-2A violations accounted for nearly half (46%) of all back wages owed to farmworkers and CMPs assessed over the 23-year period, and their share rose sharply during the two years of the Biden administration. As Table 4 shows, WHD investigations during the Trump administration found that H-2A violations accounted for roughly half of the back wages and CMPs owed by farm employers during 2017–2020, but the H-2A share rose to 73%, almost three-fourths, during the Biden administration. As a result, WHD investigations that find H-2A violations now account for the vast majority of back wages owed and CMPs assessed.
Conclusions and recommendations
Analysis of WHD enforcement data highlights four facts. First, the low number of WHD investigations in agriculture, including the record low in 2022, makes the probability of a farm being investigated very low, less than 1% for any farm employer in any year. Second, even when farms are investigated, seven in 10 are found to have violated federal wage and hour laws, including 31% where five or more violations are found.
Third, the amounts that WHD found were owed in back wages were less in fiscal year 2022—the first full year under the Biden administration—than the annual averages during the three full fiscal years under the Trump administration (2018–2022), while average back wages owed per worker and total CMPs assessed were higher in 2022 under Biden than the average in the Trump years. Fourth, violations of the H-2A visa program accounted for roughly half of the back wages owed and CMPs assessed by WHD during the Trump administration—similar to the average for fiscal years 2000 to 2022—but the H-2A share rose to three-fourths during the Biden administration.
What accounts for the drop in the number of WHD investigations during the Biden administration? Several factors may explain fewer investigations in agriculture, in addition to the overall recent decline for WHD in terms of concluded cases, back wages assessed, the number of workers owed back wages, and the total number of hours spent on investigations, which was discussed above.20 The number of WHD investigators remains very low, and agricultural investigations are often time- and labor-intensive to complete, given the locations of worksites and high levels of turnover among a constantly changing and moving seasonal workforce. In addition, the data on investigations reflect only closed investigations, so we do not know if WHD opened more investigations in 2021 and 2022 that are ongoing. The closed investigations in 2022 likely include some investigations that were opened in earlier years, including during the Trump administration.
Another reason for fewer investigations may reflect the expansion of the H-2A program, which now accounts for three-fourths of back wages owed and CMPs assessed. H-2A investigations may be more complicated because of the need to ensure that employers abide by the more than 20 assurances they provide when they are certified by DOL to recruit and employ H-2A workers. Employers must offer and pay the Adverse Effect Wage Rate (AEWR) to H-2A workers, which is set by DOL regulation,21 and to any U.S. farmworkers who are considered to be in “corresponding employment.”22 Since the AEWR is higher than the federal minimum wage, employers may try to separate H-2A and U.S. farmworkers and pay the U.S. workers lower wages, as is alleged in a recent case from the Mississippi Delta.23 Complicated H-2A cases likely require more WHD investigators and more time to complete, resulting in a lower total number of closed cases.
Why is the share of back wages and CMPs resulting from H-2A violations on the rise? One reason is straightforward: The H-2A program is growing, with the number of jobs certified to be filled by H-2A workers rising over 10% per year recently, and the total number of H-2A workers quadrupling over the past decade.24 As more employers use the program and hire more H-2A workers, there are more opportunities for the law to be violated. However, it should be noted that H-2A farmworkers only represent roughly 10% of total average farm employment and 15% of average crop employment, which suggests that WHD may have made enforcing H-2A rules a priority because it is a government-run program and WHD is responsible for ensuring its integrity.
There may also be practical reasons for the shift to H-2A enforcement, given WHD’s limited enforcement staff and resources. For example, because of the disclosures and paperwork that employers must submit to federal agencies to be certified to employ H-2A workers, WHD investigators have ready access to key information about H-2A employers that allows comparisons between what employers have promised (for example, the AEWR) to what they actually paid workers (for example, by looking at payroll data and pay stubs). The paperwork on H-2A employers available to WHD may mean that investigators can rely less on gathering information from farmworkers—who, because of their immigration status and fear of retaliation, may be reticent to speak out about workplace violations—meaning that obtaining worker complaints and statements is less of a hindrance to an investigation.
Another contributing factor may be that ever more employers of H-2A workers are farm labor contractors (FLCs)—nonfarm employers that act as staffing firms for farm employers and have long been associated with high rates of wage and hour violations. As we showed in our report, FLCs account for the highest share of wage and hour violations in agriculture, 24% of all wage and hour violations in agriculture nationally, and roughly half of all violations in the two of the biggest farm states, California and Florida.25 In 2022, nearly half of all requested H-2A jobs certified by DOL were from FLCs.26
What should be done to improve farm employer compliance with wage and hour laws and better protect farmworkers? The first step is more investigators to detect more violations, which will require Congress to appropriate more funding to WHD. Outgoing Labor Secretary Marty Walsh recently expressed a similar sentiment to The Washington Post, noting that he hoped Congress would provide “more money for enforcement officers…[because] you can’t handle the number of complaints if you don’t have the number of officers.”27 For fiscal year 2024, WHD has requested $81 million in additional funds compared with their 2023 funding level, which would result in an increase of 398 full-time staff across the agency (not just WHD investigators).28
Absent more funding from Congress, WHD will need to better target currently available resources, issue larger fines and more significant sanctions, and more frequently utilize existing legal mechanisms to encourage compliance, such as using the joint employment standard under the Fair Labor Standards Act and the Migrant and Seasonal Worker Protection Act, to hold farms accountable for FLC violations.29 If farm operators are jointly liable for violations committed by the FLCs that bring workers to farms, farm operators will have incentives to police their FLCs to ensure they comply with the law. The concept of joint employment is longstanding, but DOL could use it more often and strengthen H-2A regulations to make clear that farm employers will be held jointly responsible for the actions of their FLCs.
In addition, when serious violations of FLSA are found, WHD can file a lawsuit asking a federal court for an injunction that seeks to prohibit the shipment and distribution of goods produced in violation of FLSA’s minimum wage, overtime, or child labor requirements, with what’s known as the “hot goods” provision.30 This supply-chain approach can be very effective because it sends a message to all businesses that they must not facilitate or acquiesce in wage and hour violations, and was used by former WHD administrator David Weil.31
Third, Congress and the Biden administration must recognize that the farm workforce of 2.4 million is becoming more vulnerable and in need of additional protection32—which requires both legislative and administrative action. About 70% of U.S. farmworkers were born in Mexico,33 and they include two very vulnerable groups: the unauthorized immigrants who arrived in their 20s and 30s in the 1990s—and are now in their 50s and may lack the language ability and skills to find nonfarm jobs—and temporary migrant H-2A workers who are tied to their employers by contracts, which means that they lose their right to remain in the United States if they lose their jobs. Most of the 5% of farmworkers from Central America are likely to be in a similar situation and facing similar challenges.34 Children and indigenous workers who hail from Latin America are also laboring in the fields and need protection.
A path to citizenship for unauthorized farmworkers, which would require legislation from Congress—or work authorization through deferred action or parole, which could be accomplished through the executive branch—could reduce the vulnerability of unauthorized farmworkers by allowing them to exercise their workplace rights. Options to increase the mobility of H-2A workers, such as regulations allowing them to more easily change employers, could be explored. The recent announcement by the Department of Homeland Security (DHS) clarifying how migrant workers in labor disputes can access immigration protections can bolster worker protections from retaliation.35 WHD and other agencies within the Labor Department should issue more letters and statements of interest in support of deferred action for farmworkers and coordinate with DHS to facilitate quick adjudications that reflect the unique pressures faced by unauthorized and H-2A farmworkers.
And fourth, absent additional funding and resources to conduct more investigations, WHD should strategically target for enforcement the employers most likely to violate wage and hour laws, including the farm labor contractors who account for the largest share of violations 36 and employers who hire farmworkers through the H-2A visa program. Among the farms found to have committed wage and hour violations, as we showed in our previous report, repeat violators account for a significant share of the violations found in particular commodities and regions, which suggests the need to develop enforcement strategies that identify and monitor farm employers whose business models seem to be based on violating the law.
Creating a front-end screening process to prohibit employers from hiring through H-2A if they have a track record of violating wage and hour and labor laws, for instance, could make a significant impact and lessen the burden on WHD’s investigators.37 Requiring program violators to submit certified payroll information periodically and developing a mobile app for farmworkers to report their wages and hours could give WHD early warning of potential violations as well as provide workers with a way to anonymously report violations.
Monitoring working conditions in the fields has always been challenging and is becoming increasingly difficult. The Wage and Hour Division needs more investigators, funding, and effective strategies to protect farmworkers. This vital support needs to be bolstered by political will in the legislative and executive branches to overcome opposition from those who believe that farm employers are above needing to follow basic workplace laws. This is driven by a narrative of agricultural “exceptionalism”—the belief that agriculture is such a different industry with unique operations that it lies outside of, and thus should not be regulated by, the usual labor and employment law framework. This view has a well-established and harmful foothold in our laws and politics, resulting in legal carveouts of farmworkers from many of the bedrock labor standards protections that have covered workers outside of agriculture for decades at the federal and state level. Over the past half century, public acceptance of agricultural exceptionalism has finally begun to erode, but the job is far from complete. Additional enforcement resources are needed to ensure that farm employers play by the rules and that all farmworkers are guaranteed their basic rights for fair pay and working conditions.
Acknowledgments
The authors are grateful to Bruce Goldstein, David Dyssegaard Kallick, and Samantha Sanders for their insightful comments, observations, and suggestions provided during the drafting of this report, as well as Katherine deCourcy for research assistance and fact checking. However, no one mentioned here is responsible for the report’s content, and the authors are solely responsible for any errors or omissions.
Notes
1. Daniel Costa, Philip Martin, and Zachariah Rutledge, Federal Labor Standards Enforcement in Agriculture: Data Reveal the Biggest Violators and Raise New Questions About How to Improve and Target Efforts to Protect Farmworkers, Economic Policy Institute, December 2020. Zach Rutledge is an Assistant Professor in the Department of Agricultural, Food, and Resource Economics at Michigan State University.
2. Economic Policy Institute, “Actions the Biden Administration and Congress Can Take to Better Protect Farmworkers,” panel discussion streamed live on February 10, 2021.
3. See for example, Daniel Costa, “The Farmworker Wage Gap Continued in 2020: Farmworkers and H-2A Workers Earned Very Low Wages During the Pandemic, Even Compared with Other Low-Wage Workers,” Working Economics Blog (Economic Policy Institute), July 20, 2021; Daniel Costa, Philip Martin, and Zachariah Rutledge, Federal Labor Standards Enforcement in Agriculture: Data Reveal the Biggest Violators and Raise New Questions About How to Improve and Target Efforts to Protect Farmworkers, Economic Policy Institute, December 2020.
4. Daniel Costa, Philip Martin, and Zachariah Rutledge, Federal Labor Standards Enforcement in Agriculture: Data Reveal the Biggest Violators and Raise New Questions About How to Improve and Target Efforts to Protect Farmworkers, Economic Policy Institute, December 2020.
5. The White House, “President Biden Nominates Julie Su for Secretary of the Department of Labor” (press release), February 28, 2023.
6. The number represents the 2022 annual average combined gross wage for field and livestock workers for the United States, as reported in National Agricultural Statistics Service, Farm Labor [survey and report], United States Department of Agriculture, November 23, 2022.
7. In addition, the fact that most agricultural work is done outdoors, combined with data showing that the number of agricultural establishments remained steady, increasing slightly between 2019 and 2022, suggests that any impacts from COVID-19 were likely minimal. The fact that more agricultural investigations were closed in 2020, the year when the the bulk of pandemic shutdowns and slowdowns took place, as compared to 2021 and 2022, also supports this theory
8. National Agricultural Statistics Service, 2017 Census of Agriculture, U.S. Department of Agriculture; and see discussion in Rural Migration News, “COA Farm Labor Expenditures 2017,” University of California, Davis, September 9, 2019.
9. Bureau of Labor Statistics, Quarterly Census of Employment and Wages, QCEW Searchable Databases [databases], Series Id: ENUUS00020511, Series Title: Number of Establishments in Private NAICS 11 Agriculture, forestry, fishing and hunting for All establishment sizes in U.S. TOTAL, NSA, NAICS 11 Agriculture, forestry, fishing and hunting, Owner: Private, All establishment sizes, U.S. Department of Labor, accessed May 2023.
10. This number is derived by taking the number of WHD inspections of agricultural employers in fiscal year 2022 (879) and dividing by the QCEW number of agricultural establishments in the United States. The QCEW data include workers hired directly by farmers and those brought to farms by labor contractors and other nonfarm employers; the 513,000 number reported in the COA includes only farms that hire workers directly; almost 196,000 farms, often many of the same farms that reported direct-hire labor expenses, reported expenses for contract labor. Also, it is important to note that since the QCEW’s number of agricultural establishments includes only those required to register and pay unemployment insurance taxes, the number represents only one-fifth of the farms with labor expenses in the COA, so the true probability that a farm will be investigated in any given year is likely less than 0.7%. Rural Migration News, “COA Farm Labor Expenditures 2017,” University of California, Davis, September 9, 2019.
11. Daniel Costa, Philip Martin, and Zachariah Rutledge, Federal Labor Standards Enforcement in Agriculture: Data Reveal the Biggest Violators and Raise New Questions About How to Improve and Target Efforts to Protect Farmworkers, Economic Policy Institute, December 2020.
12. Daniel Costa, Philip Martin, and Zachariah Rutledge, Federal Labor Standards Enforcement in Agriculture: Data Reveal the Biggest Violators and Raise New Questions About How to Improve and Target Efforts to Protect Farmworkers, Economic Policy Institute, December 2020.
13. For background on WHD’s mandate and the number of workers protected by laws WHD enforces, see Wage and Hour Division, “About the Wage and Hour Division,” fact sheet, U.S. Department of Labor.
14. Daniel Costa, Threatening Migrants and Shortchanging Workers: Immigration Is the Government’s Top Federal Law Enforcement Priority, While Labor Standards Enforcement Agencies Are Starved for Funding and Too Understaffed to Adequately Protect Workers, Economic Policy Institute, December 15, 2022.
15. To derive this estimate, the number of covered workers in 1973 and 2022 was divided by the number of WHD investigators in those years. The number of covered workers is derived from the annual averages reported for the total civilian labor force, Bureau of Labor Statistics, Labor Force Statistics from the Current Population Survey, Series Id: LNU01000000, Not Seasonally Adjusted, Series title: (Unadj) Civilian Labor Force Level, ages 16 and over [data tables], U.S. Department of Labor.
16. Rebecca Rainey, “Wage Division Enforcement Declines Again in Wake of Hiring Woes,” Bloomberg Law, December 28, 2022.
17. For example, President Biden’s nominee for DOL Secretary, Marty Walsh, was confirmed by the Senate in late March 2021, almost halfway through fiscal year 2021.
18. In our 2020 report, we analyzed the data in those tables for the 2000–2019 period in more detail. See Daniel Costa, Philip Martin, and Zachariah Rutledge, Federal Labor Standards Enforcement in Agriculture: Data Reveal the Biggest Violators and Raise New Questions About How to Improve and Target Efforts to Protect Farmworkers, Economic Policy Institute, December 2020.
19. Wage and Hour Division, “Agriculture” [data tables], U.S. Department of Labor, accessed March 2023.
20. Rebecca Rainey, “Wage Division Enforcement Declines Again in Wake of Hiring Woes,” Bloomberg Law, December 28, 2022.
21. Employment and Training Administration, U.S. Department of Labor, Adverse Effect Wage Rate Methodology for the Temporary Employment of H-2A Nonimmigrants in Non-Range Occupations in the United States, Final Rule, 88 Fed. Reg. 12760 (February 28, 2023).
22. See for example, Wage and Hour Division, “Fact Sheet #26: Section H-2A of the Immigration and Nationality Act (INA),” U.S. Department of Labor, February 2010.
23. See for example, Miriam Jordan, “Black Farmworkers Say They Lost Jobs to Foreigners Who Were Paid More,” New York Times, November 12, 2021; Rural Migration News, “Midwest, Northeast, Northwest,” University of California, Davis, January 2023.
24. Rural Migration News, “H-2A: 372,000 Jobs Certified in FY22,” University of California, Davis, December 19, 2022.
25. Daniel Costa, Philip Martin, and Zachariah Rutledge, Federal Labor Standards Enforcement in Agriculture: Data Reveal the Biggest Violators and Raise New Questions About How to Improve and Target Efforts to Protect Farmworkers, Economic Policy Institute, December 2020.
26. Farmworker Justice, “INTERACTIVE: Analysis of FY2022 H-2A Jobs (Data from U.S. Dept of Labor),” see figure titled “Is Employer an H-2A Labor Contractor?” Accessed March 2023.
27. Theodoric Meyer, “An Exit Interview with Labor Secretary Marty Walsh,” The Washington Post, March 3, 2023.
28. U.S. Department of Labor, FY 2024 Department of Labor Budget in Brief, accessed April 2023, citing budget tables for Wage and Hour Division.
29. See for example, Wage and Hour Division, “Fact Sheet #35: Joint Employment and Independent Contractors Under the Migrant and Seasonal Agricultural Worker Protection Act,” U.S. Department of Labor, revised January 2020.
30. See for example, Wage and Hour Division, “Fact Sheet #80: The Prohibition Against Shipment of “Hot Goods” Under the Fair Labor Standards Act,” U.S. Department of Labor, October 2014.
31. David Weil, “Testimony of Dr. David Weil, Wage and Hour Administrator, Wage and Hour Division, U.S. Department of Labor, Before the Subcommittee on Horticulture, Research, Biotechnology, and Foreign Agriculture, Committee on Agriculture,” U.S. House of Representatives, July 30, 2014.
32. Philip Martin, The Prosperity Paradox: Fewer and More Vulnerable Farm Workers, Oxford University Press, January 9, 2021.
33. Authors’ rough estimate taking the reported 63% of non-H-2A crop farmworkers who are born in Mexico as reported in the National Agricultural Workers Survey combined with 93% of the 300,000 H-2A farmworkers who are Mexican nationals as reported by the State Department. See Amanda Gold, Wenson Fung, Susan Gabbard, and Daniel Carroll, Findings from the National Agricultural Workers Survey (NAWS) 2019–2020: A Demographic and Employment Profile of United States Farmworkers, prepared for the Employment and Training Administration, U.S. Department of Labor, January 2022; and Bureau of Consular Affairs, Nonimmigrant Visa Statistics [data tables], U.S. Department of State, last accessed May 2023.
34. Estimate of farmworkers born in Central America as reported in Amanda Gold, Wenson Fung, Susan Gabbard, and Daniel Carroll, Findings from the National Agricultural Workers Survey (NAWS) 2019–2020: A Demographic and Employment Profile of United States Farmworkers, prepared for the Employment and Training Administration, U.S. Department of Labor, January 2022.
35. See Department of Homeland Security, “DHS Announces Process Enhancements for Supporting Labor Enforcement Investigations” (press release), January 13, 2023; Daniel Costa, “The Department of Homeland Security Took a Positive Step by Clarifying and Streamlining the Process to Protect Migrant Workers in Labor Disputes,” Working Economics blog (Economic Policy Institute), January 13, 2023.
36. Daniel Costa, Philip Martin, and Zachariah Rutledge, Federal Labor Standards Enforcement in Agriculture: Data Reveal the Biggest Violators and Raise New Questions About How to Improve and Target Efforts to Protect Farmworkers, Economic Policy Institute, December 2020.
37. See for example, discussion of a similar proposal for a front-end screening process of employers in the H-2B visa program in Daniel Costa, As the H-2B Visa Program Grows, the Need for Reforms That Protect Workers Is Greater Than Ever: Employers Stole $1.8 Billion from Workers in the Industries That Employed Most H-2B Workers over the Past Two Decades, Economic Policy Institute, August 18, 2022