Full Report
For Americans living in the Southern United States, poverty rates above the national level, lower rates of economic mobility, and high rates of economic inequality are persistent features of life. A key factor explaining these trends, especially among children, is the Southern economic development model. This model emerged from the efforts of wealthy Southerners to continue extracting un- or undercompensated labor from freed Black men and women following the end of the Civil War, when it became largely illegal to enslave African Americans (Childers 2024a; Mast 2025).1
Research examining poverty, inequality, and economic mobility today shows that areas in the United States where slavery was most prevalent before the Civil War continue to have worse outcomes on each of these indicators (Baker 2021; Berger 2018; O’Connell 2012). This highlights the continuing impact of the racist Southern economic development model that continues to infect many of the political, economic, and social structures of the U.S. South today. While this economic development model has resulted in highly racialized access to opportunity, mobility, and economic well-being across the South, its impacts are not limited solely to Black and brown Southerners.
The reports in the Rooted in Racism and Economic Exploitation series document how the Southern model’s emphasis on exploited labor, disempowered workers, lack of regulation on businesses, regressive taxes, and underfunded public systems are all rooted in the region’s racist past (Childers 2024a).2
In this report, we continue our examination of the well-being of workers and families living in states that adopt the Southern model in terms of poverty, social mobility, and inequality. This report shows that the policies this model dictates lead to high rates of poverty, low economic mobility, and high levels of inequality for workers of all racial and ethnic backgrounds. The data show that this economic model is not serving workers or families across the South and is instead leaving far too many economically insecure and with limited opportunity to ever get ahead. While high levels of economic inequality are common across the United States, the policies implemented by many Southern states magnify the precarity of workers and families across much of the region.
What is the Southern economic development model?
The Southern economic development model is a set of economic policies that can be traced back to the end of slavery when wealthy, powerful Southerners sought to continue to extract the labor of Black men and women with as little compensation as possible. The specific components of this model include ensuring low wages for workers, limiting regulations on businesses, implementing regressive tax systems, maintaining weak social safety nets, and enforcing a fierce anti-union stance (Childers 2024a).
Where labor laws such as the Fair Labor Standards Act and the National Labor Relations Act sought to ensure workers had some minimal level of protection (i.e., a minimum wage, overtime pay, and the right to organize), Southern lawmakers ensured that work done primarily by Black workers—such as agricultural and domestic work—were excluded from those protections (Dixon 2021; Perea 2011).
Today, it is those states across the South where slavery was most entrenched that tend to be the states that adopt and defend the Southern economic development model most vigorously. 3 For example, Virginia (490,865 enslaved people in 1860), Georgia (462,198), Mississippi (436,631), Alabama (435,080), South Carolina (402,406), and Louisiana (331,726) were among the states with the largest numbers of enslaved people before the Civil War (Pariona 2018). Today, these same states are some of the strongest adherents of the Southern model. In contrast, while the U.S. Census Bureau (2021a) includes Maryland (87,189) and Delaware (1,798) among the Southern states, they had much smaller enslaved populations and do not adopt the Southern economic development model (see Childers 2024a for a deeper analysis of Southern states’ adoption of the model).
Today, the roots of the Southern model have been obscured as proponents market it as a “business friendly” way to attract businesses into Southern states, with the implicit promise that this will lead to an abundance of jobs and shared economic prosperity for all Southerners. The reality is this economic development model is fundamentally flawed as a strategy for improving the lives of most Southerners. It was never designed to help most working Southerners; it was instead intended to ensure continued access to the labor of Black people following emancipation, and Southerners of all racial backgrounds today, with as little compensation as possible.
The Southern United States has the largest share of residents living in poverty
Perhaps the most commonly used measure of economic well-being is the official poverty rate. This is the percentage of people whose pre-tax personal or family incomes fall below a federally determined income threshold for their family’s size and composition (see Appendix Table 1 for thresholds by family size and number of children).4
A family of four with two children and an annual family income above $30,900 in 2023 would be above the official poverty line. These income thresholds were initially established in the 1960s (Fisher 2008). The thresholds generally have only been adjusted for overall inflation, even though the cost of some basic necessities—e.g., health care—have risen much faster than overall price inflation over the last 60 years (Dalaker 2022). As a result, the federal poverty line is an incredibly low threshold that no longer realistically captures the basic amount needed to provide adequate housing, food, transportation, child care, and other basic necessities.5 This means that many families are experiencing severe economic distress even if their family income is above the poverty threshold for their household composition.
How we define the South
Throughout the Rooted in Racism series, we use the U.S. Census Bureau’s definition of the South Census Region, which includes Alabama, Arkansas, Delaware, Florida, Georgia, Kentucky, Louisiana, Maryland, Mississippi, North Carolina, Oklahoma, South Carolina, Tennessee, Texas, Virginia, West Virginia, and the District of Columbia. When analyses focus on a subset of these states, it is noted. Figure A shows the states that make up each of the regions compared in this series.
The South is made up of 16 states and the District of Columbia: Map of the four regions of the United States and the states that make up those regions
| State | Key | Region |
|---|---|---|
| Alabama | 3 | South |
| Alaska | 0 | West |
| Arizona | 0 | West |
| Arkansas | 3 | South |
| California | 0 | West |
| Colorado | 0 | West |
| Connecticut | 2 | Northeast |
| Delaware | 3 | South |
| Florida | 3 | South |
| Georgia | 3 | South |
| Hawaii | 0 | West |
| Idaho | 0 | West |
| Illinois | 1 | Midwest |
| Indiana | 1 | Midwest |
| Iowa | 1 | Midwest |
| Kansas | 1 | Midwest |
| Kentucky | 3 | South |
| Louisiana | 3 | South |
| Maine | 2 | Northeast |
| Maryland | 3 | South |
| Massachusetts | 2 | Northeast |
| Michigan | 1 | Midwest |
| Minnesota | 1 | Midwest |
| Mississippi | 3 | South |
| Missouri | 1 | Midwest |
| Montana | 1 | Midwest |
| Nebraska | 1 | Midwest |
| Nevada | 0 | West |
| New Hampshire | 2 | Northeast |
| New Jersey | 2 | Northeast |
| New Mexico | 0 | West |
| New York | 2 | Northeast |
| North Carolina | 3 | South |
| North Dakota | 1 | Midwest |
| Ohio | 1 | Midwest |
| Oklahoma | 3 | South |
| Oregon | 0 | West |
| Pennsylvania | 2 | Northeast |
| Rhode Island | 2 | Northeast |
| South Carolina | 3 | South |
| South Dakota | 1 | Midwest |
| Tennessee | 3 | South |
| Texas | 3 | South |
| Utah | 0 | West |
| Vermont | 2 | Northeast |
| Virginia | 3 | South |
| Washington | 0 | West |
| Washington D.C. | 3 | South |
| West Virginia | 3 | South |
| Wisconsin | 1 | Midwest |
| Wyoming | 0 | West |

Source: U.S. Census Bureau. 2021a. “Geographic Levels.” Last modified October 2021.
Figure B shows the poverty rates for each region of the country from 1971 through 2023. These data show that despite increases and declines in poverty over the last half-century, the South has consistently had higher poverty rates than any other region. In 1971, the poverty rate across the region was more than six percentage points higher than the West, the region with the next highest poverty rate (17.5% and 11.4%, respectively). That gap has dropped considerably over time, but the poverty rate across the South—12.4% in 2023—remains higher than other regions (the poverty rate in 2023 was 11% in the West and just 9.8% in both the Northeast and Midwest).
The South has the highest poverty rate of any region: Poverty rates by region, 1971–2023
| Date | Northeast | Midwest | South | West |
|---|---|---|---|---|
| 1971 | 9.3% | 10.3% | 17.5% | 11.4% |
| 1972 | 8.7% | 9.3% | 16.9% | 11.1% |
| 1973 | 8.6% | 8.6% | 15.3% | 10.5% |
| 1974 | 9.3% | 8.8% | 16.1% | 10.7% |
| 1975 | 10.2% | 9.7% | 16.2% | 11.7% |
| 1976 | 10.2% | 9.9% | 15.2% | 10.5% |
| 1977 | 10.2% | 9.8% | 14.8% | 10.1% |
| 1978 | 10.4% | 9.1% | 14.7% | 10.0% |
| 1979 | 10.4% | 9.7% | 15.0% | 10.0% |
| 1980 | 11.1% | 11.4% | 16.5% | 11.4% |
| 1981 | 11.9% | 12.3% | 17.4% | 12.7% |
| 1982 | 13.0% | 13.3% | 18.1% | 14.1% |
| 1983 | 13.4% | 14.6% | 17.2% | 14.7% |
| 1984 | 13.2% | 14.1% | 16.2% | 13.1% |
| 1985 | 11.6% | 13.9% | 16.0% | 13.0% |
| 1986 | 10.5% | 13.0% | 16.1% | 13.2% |
| 1987 | 11.0% | 12.7% | 16.1% | 12.6% |
| 1988 | 10.1% | 11.4% | 16.1% | 12.7% |
| 1989 | 10.0% | 11.9% | 15.4% | 12.5% |
| 1990 | 11.4% | 12.4% | 15.8% | 13.0% |
| 1991 | 12.2% | 13.2% | 16.0% | 14.3% |
| 1992 | 12.6% | 13.3% | 17.1% | 14.8% |
| 1993 | 13.3% | 13.4% | 17.1% | 15.6% |
| 1994 | 12.9% | 13.0% | 16.1% | 15.3% |
| 1995 | 12.5% | 11.0% | 15.7% | 14.9% |
| 1996 | 12.7% | 10.7% | 15.1% | 15.4% |
| 1997 | 12.6% | 10.4% | 14.6% | 14.6% |
| 1998 | 12.3% | 10.3% | 13.7% | 14.0% |
| 1999 | 11.0% | 9.8% | 13.2% | 12.7% |
| 2000 | 10.3% | 9.3% | 12.8% | 11.8% |
| 2001 | 10.7% | 9.4% | 13.5% | 12.1% |
| 2002 | 10.9% | 10.3% | 13.8% | 12.4% |
| 2003 | 11.3% | 10.7% | 14.1% | 12.6% |
| 2004 | 11.6% | 11.7% | 14.1% | 12.5% |
| 2005 | 11.3% | 11.4% | 14.0% | 12.6% |
| 2006 | 11.5% | 11.2% | 13.8% | 11.6% |
| 2007 | 11.4% | 11.1% | 14.2% | 12.0% |
| 2008 | 11.6% | 12.4% | 14.3% | 13.5% |
| 2009 | 12.2% | 13.3% | 15.7% | 14.8% |
| 2010 | 12.9% | 14.0% | 16.8% | 15.3% |
| 2011 | 13.1% | 14.0% | 16.0% | 15.8% |
| 2012 | 13.6% | 13.3% | 16.5% | 15.1% |
| 2013 | 13.0% | 13.9% | 16.3% | 14.6% |
| 2014 | 12.6% | 13.0% | 16.5% | 15.2% |
| 2015 | 12.4% | 11.7% | 15.3% | 13.3% |
| 2016 | 10.8% | 11.7% | 14.1% | 12.8% |
| 2017 | 11.4% | 11.4% | 13.6% | 11.8% |
| 2018 | 10.3% | 10.4% | 13.6% | 11.2% |
| 2019 | 9.4% | 9.7% | 12.0% | 9.5% |
| 2020 | 10.2% | 10.1% | 13.3% | 10.6% |
| 2021 | 10.1% | 10.4% | 13.2% | 11.0% |
| 2022 | 10.8% | 9.8% | 13.2% | 10.7% |
| 2023 | 9.8% | 9.8% | 12.4% | 11.0% |
Notes: Shaded areas denote recessions.
Source: U.S. Census Bureau. 2024. “Table 9. Poverty of People by Region: 1959 to 2023” [Excel file], Historical Poverty Tables. Updated September 10, 2024.
States across the South are not homogeneous, however, and they adopt components of the Southern economic development model to varying degrees (see Childers 2024a for a more in-depth analysis). As discussed throughout the reports in the Rooted in Racism and Economic Exploitation series, the differences in how states adopt the model allow us to compare various economic outcomes—including poverty rates—in the states across the South that have more fully adopted the model with those Southern states that have rejected it.
Figure C shows poverty rates nationally and for each Southern state in 2023. Nationally the poverty rate was 12.5%. Just four Southern states had poverty rates below the 12.5% national rate: Florida at 12.3% was just slightly below the national rate. Of the remaining three states, all had a poverty rate substantially lower than the national rate; two—Maryland (9.5%) and Delaware (10.5%)—do not adopt the Southern economic development model.
Just four of the 16 Southern states have a lower poverty rate than the national average: Poverty rate by state, 2023
| Southern states plus DC and US | Population for whom poverty status is determined |
|---|---|
| Louisiana | 18.9% |
| Mississippi | 18.0% |
| West Virginia | 16.7% |
| Kentucky | 16.4% |
| Oklahoma | 15.9% |
| Arkansas | 15.7% |
| Alabama | 15.6% |
| District of Columbia | 14.0% |
| Tennessee | 14.0% |
| South Carolina | 13.9% |
| Texas | 13.7% |
| Georgia | 13.6% |
| North Carolina | 12.8% |
| United States | 12.5% |
| Florida | 12.3% |
| Delaware | 10.5% |
| Virginia | 10.2% |
| Maryland | 9.5% |
Source: U.S. Census Bureau, American Community Survey. 2023b. “S1703: Selected Characteristics of People at Specified Levels of Poverty in the Past 12 Months.” Public data series accessed via the Census data tool. Accessed March 2025.
These data also show that most Southern states have a poverty rate above the national average. Louisiana, for example, had the highest poverty rate in 2023 at 18.9%, followed by Mississippi, with the second highest at (18%). Many are states where slavery was prevalent prior to the Civil War, a factor that has been linked to higher poverty rates today, especially among Black Southerners (Baker 2021; Pariona 2018; O’Connell 2012).6
Almost one in five Black and Native women and almost as many Hispanic women live below the poverty line across the South
While the Southern economic development model harms workers and families of all racial and ethnic backgrounds, Black and brown Southerners experience the greatest harms, as noted above. Figures D and E show poverty rates for men and women, respectively, by race and ethnicity across the South. First, Figure D shows more than one in 10 men across the region fall below the poverty line, with poverty rates ranging from 8.3% for white men to 15.1% and 15.2% for Black and American Indian and Alaska Native (AIAN) men, respectively.
AIAN and Black men have poverty rates almost seven percentage points higher than white and Asian men: Poverty rates for men by race and ethnicity, 2023
| Race | Male Poverty Rate |
|---|---|
| All Southern men | 10.4% |
| American Indian Alaska Native | 15.2% |
| Black | 15.1% |
| Hispanic | 12.4% |
| Asian | 8.9% |
| White | 8.3% |
Note: Five-year averages are used to ensure adequate sample sizes for all racial and ethnic groups.
Source: Author’s analysis of U.S. Census Bureau, American Community Survey. 2023a. Published tables B17001–BB17001I: Poverty Status in the Past 12 Months by Sex by Age. Public data series accessed via the Census data tool. Accessed March 2025.
Figure E shows poverty rates for women by race and ethnicity. While women overall have a poverty rate of 13.9%, Asian women (9.5%) have the lowest poverty rate, followed by white women (11%). Hispanic (17.7%), AIAN (19.3%), and Black (19.9%) women have the highest poverty rates with almost one in five falling below the poverty line.
Perhaps more strikingly, women have substantially higher poverty rates than men, independent of racial and ethnic background, but especially white men. White women (11%) have a poverty rate that is 2.7 percentage points higher than white men (8.3%), while Black (19.9%), AIAN (19.3%), and Hispanic (17.7%) women have poverty rates more than twice that of white men.
These disparities reflect several different factors. First, women are generally the primary providers of unpaid care work in the home, caring for children and elderly, sick, or disabled family members. Many, especially among women of color, lack access to basic work-family supports such as affordable child care, paid family leave, and assistance with eldercare that would facilitate their participation in the labor market (Childers 2024c).
In the labor market women are overrepresented in low-wage jobs, making up more than two-thirds of these workers with Black, Hispanic, and Native American women particularly overrepresented (Tucker and Vogtman 2023).
Even women not in low-wage jobs are paid less than their male counterparts. All women are paid just 82.7% of the pay of all men, and just 72.7% of the pay of white men. There are large differences by race and ethnicity, however. White women are paid 79.6% of white men’s earnings, while Black (66.5%) and Hispanic (57.8%) women are paid significantly less (Hegewisch, Peterson, and Doorley 2024).
Almost one in five Black and AIAN women live in poverty, followed closely by Hispanic women: Poverty rates for women by race and ethnicity, 2023
| Race | Female Poverty Rate |
|---|---|
| All Southern women | 13.9% |
| Black | 19.9% |
| American Indian Alaska Native | 19.3% |
| Hispanic | 17.7% |
| White | 11.0% |
| Asian | 9.5% |
Note: Five-year averages are used to ensure adequate sample sizes for all racial and ethnic groups.
Source: Author’s analysis of U.S. Census Bureau, American Community Survey. 2023a. Published tables B17001–BB17001I: Poverty Status in the Past 12 Months by Sex by Age. Public data series accessed via the Census data tool. Accessed March 2025.
Children across the South are more likely to live in poverty than children in any other region
Not surprisingly, high rates of poverty for men and women across the region also mean higher rates of poverty among children. Children are one of the most vulnerable groups when it comes to poverty. Research shows that children who grow up in poor households have less access to adequate amounts of nutritious foods, to safe stable housing in safe and nurturing environments and communities, and less access to basic medical care. They do, however, face higher exposure to unstable housing, crowded living conditions, and environmental toxins such as lead or other hazardous chemicals (NASEM 2019; Redd, Thomson, and Moore 2024; Wodtke, Ramaj, and Schachner 2022).
These factors not only impact children’s immediate development but have implications for their long-term cognitive, social, emotional, and economic outcomes. One study by the National Academies of Sciences found “overwhelming evidence” that children growing up in poor families have worse outcomes on “virtually every dimension” than children in wealthier households (NASEM 2019, 67).
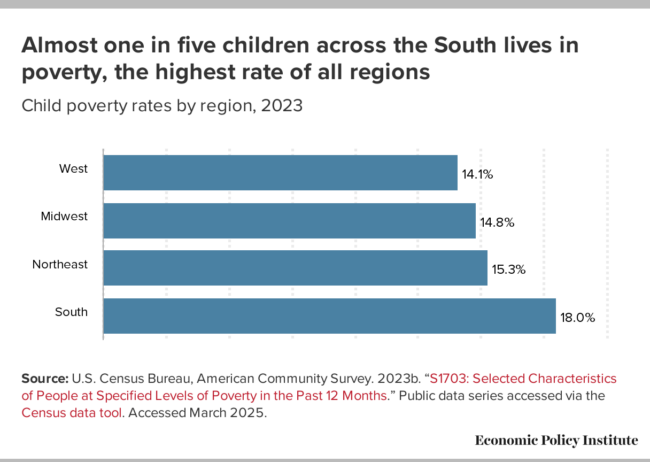
Figure F shows that despite the tremendous harm that growing up in poverty causes children—and the lasting harm this has on communities and the country as a whole—child poverty rates are extremely high across every region of the country. Western states have the lowest child poverty rate of any region at 14.1%, yet this still means one in seven children there are living in poverty. The Midwest (14.8%) and Northeast (15.3%) have slightly higher rates than the West, but the South has the highest child poverty rate of all regions at 18%.
Almost one in five children across the South lives in poverty, the highest rate of all regions: Child poverty rates by region, 2023
| Region | Child Poverty Rate |
|---|---|
| West | 14.1% |
| Midwest | 14.8% |
| Northeast | 15.3% |
| South | 18.0% |
Source: U.S. Census Bureau, American Community Survey. 2023b. “S1703: Selected Characteristics of People at Specified Levels of Poverty in the Past 12 Months.” Public data series accessed via the Census data tool. Accessed March 2025.
These high levels of child poverty are not the result of the pandemic. Childers (2023) showed that in 2019, before the pandemic, child poverty rates were even higher at 20.9% across the South, 17.2% in the Midwest, 17.1% in the West, and 16.6% in the Northeast. The lower rates in Figure F reflect the impact of federal policy. During the pandemic, the expansion of the safety net at the national level led to a 46% drop in the number of children in poverty (Burns, Fox, and Wilson 2022). These programs have since ended and research indicates that poverty rates are sadly moving back up across the country, highlighting that policy has the power to effectively reduce child poverty (Burns, Fox, and Wilson 2022; Banerjee and Zipperer 2022).
As with poverty rates overall, high rates of child poverty across the South are not the result of arbitrary factors; they are consistently higher in states with a history marred by slavery and that today have adopted most components of the Southern model. Figure G shows child poverty rates by state. The lowest rates of child poverty are in Maryland (10.6%) and Delaware (15.2%), where the Southern model is largely rejected, and in Virginia (12.7%) and Florida (15.7%). In the remaining 13 Southern states (including D.C.), child poverty rates are higher than the national average, with child poverty rates exceeding 20% in seven Southern states and one in four children living in poverty in Louisiana (25%).
More than one in five children fall below the poverty line in seven of the 17 Southern states: Child poverty rates by state, 2023
| Southern states plus D.C. and U.S. | Child poverty rate |
|---|---|
| Louisiana | 25.0% |
| Mississippi | 23.2% |
| Alabama | 21.1% |
| Kentucky | 21.0% |
| Arkansas | 20.9% |
| Oklahoma | 20.8% |
| West Virginia | 20.1% |
| Tennessee | 19.7% |
| South Carolina | 19.1% |
| Georgia | 18.4% |
| Texas | 18.4% |
| North Carolina | 17.6% |
| District of Columbia | 17.1% |
| United States | 16.0% |
| Florida | 15.7% |
| Delaware | 15.2% |
| Virginia | 12.7% |
| Maryland | 10.6% |
Source: U.S. Census Bureau, American Community Survey. 2023b. “S1703: Selected Characteristics of People at Specified Levels of Poverty in the Past 12 Months.” Public data series accessed via the Census data tool. Accessed March 2025.
Figure F showed that 18% of children across the South fall below the poverty line. However, that overall rate obscures differences for children from different racial and ethnic backgrounds as shown in Figure H. These data show that Asian children have the lowest rates of poverty across the region, with fewer than one in 10 Asian children living in families with incomes below the poverty line. They are followed closely by non-Hispanic white children at 11.1%. Poverty rates more than double for Hispanic (24%) and AIAN (24.4%) children. Black children across the region have the highest poverty rate of 30.1%, almost three times the poverty rate for white children.
Black, AIAN, and Hispanic children are more than twice as likely as white or Asian children to live in poverty: Child poverty rates by race and ethnicity, 2023
| Race | Child Poverty Rate |
|---|---|
| All children | 18.0% |
| Black | 30.1% |
| American Indian Alaska Native | 24.4% |
| Hispanic | 24.0% |
| White | 11.1% |
| Asian | 9.2% |
Note: Five-year tables used to ensure adequate sample sizes for children of each racial and ethnic background. Poverty rate for all children based on one-year U.S. Census Bureau’s American Community Survey Table S1703.
Source: Author’s analysis of U.S. Census Bureau, American Community Survey. 2023a. Published tables B17001–BB17001I: Poverty Status in the Past 12 Months by Sex by Age. Public data series accessed via the Census data tool. Accessed March 2025.
The high rates of poverty for Black and brown children and families across the region reflect multiple factors, including the legacy of slavery and anti-Black discrimination embedded in the Southern economic development model (Baker 2021; Childers 2024a; Tomaskovic-Devey and Roscigno 1996). One of the most pernicious features of this model is that the harm and precarity it creates is self-reinforcing and persists across generations. Children raised in high-poverty areas may never have the means to seek economic opportunities outside of the impoverished communities in which they are raised. If they become parents, the cycle begins anew.
This is consistent with the findings of a report from the National Academy of Sciences that found the South had the largest number of children (22.1%) in persistently high child poverty counties—that is, counties that had child poverty rates of 20% or more over four decades from 1980 through 2011 (NASEM 2019, 53–54).
The Southern economic development model’s design to suppress wages and maintain a weak safety net means children in the South are not only more likely than those in other regions to live in persistently high-poverty areas, but to also live in extremely low-wage households. Figure I shows that while just 38.7% of all U.S. children live in Southern states, more than half (55.1%) of all children in households where the head is paid less than $10 an hour live in the South.
More than half of all children in households where the head is paid less than $10/hour are in the Southern United States, 2024: Regional distribution of all children compared with children in households where the head is paid less than $10/hour
| Chart | South | West | Midwest | Northeast |
|---|---|---|---|---|
| Children, overall | 38.7% | 23.7% | 21.8% | 15.7% |
| Children, household head <$10/hr | 55.1% | 15.3% | 17.8% | 11.8% |
Source: Economic Policy Institute. 2025. Current Population Survey Extracts, Version 1.0.60, https://microdata.epi.org, 2024 data.
The economic insecurity these families face is a direct consequence of the emphasis on low wages in the Southern economic development model.
Economic mobility in Southern states
One reason many Southerners may accept high rates of poverty generally, and persistent poverty specifically, is an overestimation of Americans’ economic mobility rates, leading many to believe that a better quality of life for the poor is more within reach than it truly is (Alesina, Stantcheva, and Teso 2018; Cohen 2019). Alesina, Stantcheva, and Teso (2018), for example, found that American survey respondents estimated that the likelihood of a child born into the poorest quintile of earnings making it into the highest quintile was 12%, but it is really 8%.
There were also large differences across states in estimates of American economic mobility. In states across the South, for example, estimates of mobility from the poorest quintile to the richest were much higher than estimates from respondents in other regions of the country. For example, 6.9% of children born into the bottom income quintile in Arkansas will make it to the top quintile as adults. Survey respondents in the state, however estimated that 18.9% of Americans born into the bottom fifth of households in terms of income will reach the top fifth of households in adulthood. In Alabama 5.2% of children in the state are likely to move from the bottom quintile to the top, compared with an estimate of 16.2% from survey respondents. And in South Carolina, the probability is 4%, compared with an estimate of 12.4%. For comparison with estimates from other regions, the estimate was 11.1% in California (9.9% actual mobility rate), 9.7% in Arizona (7%), and 7.7% in New Mexico (8.6%; see Cohen 2019 for all state-by-state numbers).
Research on economic mobility using commuting zones further reinforces these findings. Chetty et al. (2014) examined the probability that a child born to parents at the 25th percentile of income would rank in the top quintile of earnings as an adult by commuting zones. Figure J shows their results: Children born into the poorest quintile were the least likely to reach the highest-earning quintile in states across the South.
Most states across the South provide children with far fewer chances of upward mobility: Mobility rates by commuting zones
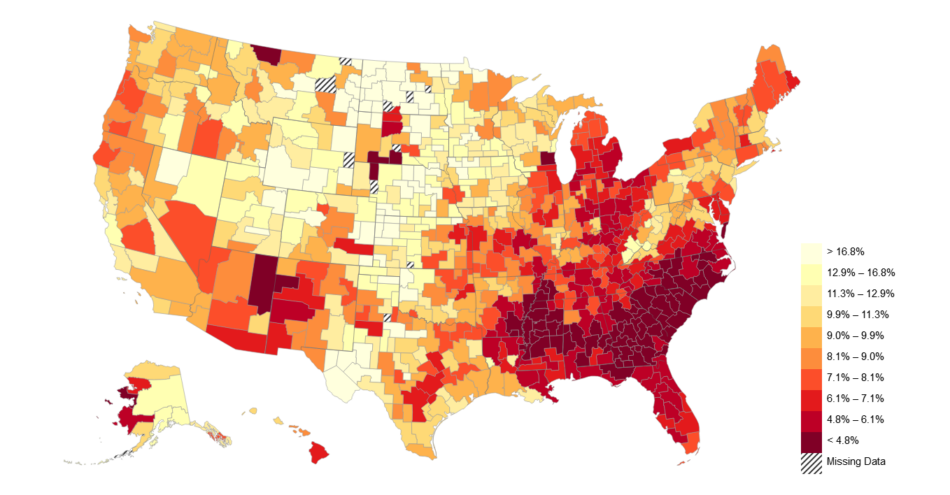
Note: This figure presents a heat map of the probability that a child reaches the top quintile of the national family income distribution for children conditional on having parents in the bottom quintile of the family income distribution for parents. Children are assigned to commuting zones based on the location of their parents (when the child was claimed as a dependent) irrespective of where they live as adults. This figure is constructed using data from Online Data Table V of Chetty el al., 2014.
Source: Chetty, Raj, Nathaniel Hendren, Patrick Kline, and Emmanuel Saez. 2014. “Where Is the Land of Opportunity? The Geography of Intergenerational Mobility in the United States.” National Bureau of Economic Research Working Paper no. 19843, January 2014. https://doi.org/10.3386/w19843.
As we saw with high rates of persistent poverty in the South, there is a close association between the history of extreme racial subordination, slavery, and economic mobility for those living in these communities to this day. Southern states have consistently shown lower levels of intergenerational mobility than other regions (Berger 2018; Connor and Storper 2020; Chetty et al. 2014). These states are also largely the same states with the largest enslaved population prior to the Civil War (See Berger 2018; Pariona 2018). Berger (2018), for example, shows that children in places where slavery was more prevalent had lower expected earnings in adulthood than children with parents earning similar incomes in other areas of the country. Further, there is evidence that as inequality continues to grow, young people’s own talents and hard work play a smaller and smaller role in their economic outcomes as an adult while their family background takes on great importance (Corak 2013).
Chetty et al. (2017) note that the idea of the “American Dream” is the notion that one’s children will have a higher standard of living than they have. This has been a core belief in this country since its inception, along with the belief that hard work and “grit” were the keys to making it happen. The research in the Rooted in Racism series and the work cited in this report illustrate the utter fallacy of this belief, particularly for people in the South. Indeed, the Southern economic development model has been an intentional strategy to limit economic mobility and allow (if not generate) high rates of poverty and economic hardship for workers and families across the region but especially for Black and brown Southerners.
Conclusion
The Southern economic development model emerged after slavery was outlawed in an intentional effort to continue accessing the labor of Black men and women with as little compensation as possible. This meant the lowest possible wages (if paid at all), a weak safety net for workers, few regulations on businesses, and the prevention of worker empowerment at all costs.
Today, this model is presented as a way to attract businesses, create jobs, and ensure broad, shared prosperity while obscuring its true roots. The data in this report and across this series, however, have shown that this model has repeatedly failed to provide for the basic economic security, let alone prosperity, of workers and families across the region. This is because the model was not designed for this purpose and cannot achieve this outcome. Policies that would facilitate broadly shared prosperity for Southerners of all backgrounds include empowering workers, respecting their right to organize and form unions, raising the minimum wage to a living wage, strengthening the social safety net, and ensuring adequate funding for public schools and healthy communities. These are the policies that support families and enable their success.
Appendix
Poverty thresholds by size of family and number of related children under age 18, 2023
| Related children under 18 years | ||||||||||
|---|---|---|---|---|---|---|---|---|---|---|
| Size of family unit | Weighted average thresholds | None | One | Two | Three | Four | Five | Six | Seven | Eight or more |
| One person (unrelated individual): | $15,480 | |||||||||
| Under 65 years | $15,850 | $15,852 | ||||||||
| 65 years and over | $14,610 | $14,614 | ||||||||
| Two people: | $19,680 | |||||||||
| Householder under 65 years | $20,490 | $20,404 | $21,002 | |||||||
| Householder 65 years and over | $18,430 | $18,418 | $20,923 | |||||||
| Three people | $24,230 | $23,834 | $24,526 | $24,549 | ||||||
| Four people | $31,200 | $31,428 | $31,942 | $30,900 | $31,008 | |||||
| Five people | $36,990 | $37,901 | $38,452 | $37,275 | $36,363 | $35,807 | ||||
| Six people | $41,860 | $43,593 | $43,766 | $42,864 | $41,999 | $40,714 | $39,952 | |||
| Seven people | $47,670 | $50,159 | $50,472 | $49,393 | $48,640 | $47,238 | $45,602 | $43,808 | ||
| Eight people | $52,850 | $56,099 | $56,594 | $55,575 | $54,683 | $53,416 | $51,809 | $50,136 | $49,710 | |
| Nine people or more | $62,900 | $67,483 | $67,810 | $66,908 | $66,151 | $64,908 | $63,198 | $61,651 | $61,268 | $58,907 |
Source: U.S. Census Bureau. 2023. “Poverty Thresholds by Size of Family and Number of Children” [Excel file], Poverty Thresholds. Updated January 23, 2025.
Notes
1. While the 13th amendment to the U.S. constitution abolished slavery and involuntary servitude it included a loophole for those convicted of a crime (see Mast 2025).
2. Previous reports in the Rooted in Racism series have summarized the key findings of the series (Childers 2023); analyzed the Southern economic policy model’s history and evolution (Childers 2024a); demonstrated that states that have closely adhered to the model are underperforming in terms of economic growth and job creation (Childers 2024b); and highlighted the poor job quality, low wages, and working conditions in the South (Childers 2024c). See Economic Policy Institute, “Rooted in Racism and Economic Exploitation” (web page), https://www.epi.org/rooted-in-racism.
3. The reports in this series use the U.S. Census Bureau’s (2021a) definition of the South but note that the states of Maryland and Delaware and the District of Columbia do not adopt or strictly adhere to the Southern economic development model. Their policy approaches and outcomes for residents are contrasted with those adopting this model to illustrate the impact of the Southern economic development model. It should also be noted that Virginia, a state that does adopt the model, is influenced by its position as part of the District of Columbia-Maryland-Virginia (DMV) metropolitan statistical area.
4. Pre-tax income is gross income from earnings, Social Security, pensions, and disability benefits. It does not include tax credits or noncash benefits, such as subsidized housing or nutritional assistance programs (Benson 2024).
5. For more information, see David Cooper, “Census Tries to Better Identify Poverty and Finds What? More of It, ” Working Economics Blog (Economic Policy Institute), November 9, 2011.
6. The seven states that had more than 300,000 enslaved people in 1860 were Virginia (490,865), Georgia (462,198), Mississippi (436,631), Alabama (435,080), South Carolina (402,406), Louisiana (331,726), and North Carolina (331,059). Tennessee (275,719) and Kentucky (225,485) held over 200,000, while several other states held smaller numbers (Pariona 2018).
References
Alesina, Alberto, Stefanie Stantcheva, and Edoardo Teso. 2018. “How Closely Do Our Beliefs About Social Mobility Match Reality?” (blog post). Kellogg Insight (Kellogg School of Management), November 6, 2018.
Baker, Regina S. 2021. “The Historical Racial Regime and Racial Inequality in Poverty in the American South.” Luxembourg Income Study Working Paper no. 820, November 2021.
Banerjee, Asha, and Ben Zipperer. 2022. “Pandemic Safety Net Programs Kept Millions Out of Poverty in 2021, New Census Data Show.” Working Economics Blog (Economic Policy Institute), September 13, 2022.
Benson, Craig. 2024. Poverty in States and Metropolitan Areas: 2023. United States Census Bureau.
Berger, Thor. 2018. “Places of Persistence: Slavery and the Geography of Intergenerational Mobility in the United States.” Demography 55 (July): 1547–1565. https://doi.org/10.1007/s13524-018-0693-4.
Burns, Kalee, Liana Fox, and Danielle Wilson. 2022. “Expansions to Child Tax Credit Contributed to 46% Decline in Child Poverty Since 2020.” Commentary, U.S. Census Bureau website, September 13, 2022.
Chetty, Raj, David Grusky, Maximilian Hell, Nathaniel Hendren, Robert Manduca, and Jimmy Narang. 2017. “The Fading American Dream: Trends in Absolute Income Mobility Since 1940.” Science 356, no. 6336 (April): 398–406. https://doi.org/10.1126/science.aal4617.
Chetty, Raj, Nathaniel Hendren, Patrick Kline, and Emmanuel Saez. 2014. “Where Is the Land of Opportunity? The Geography of Intergenerational Mobility in the United States.” National Bureau of Economic Research Working Paper no. 19843, January 2014. https://doi.org/10.3386/w19843.
Childers, Chandra. 2023. Rooted in Racism and Economic Exploitation: The Failed Southern Economic Development Model. Economic Policy Institute, October 2023.
Childers, Chandra. 2024a. The Evolution of the Southern Economic Development Strategy. Economic Policy Institute, May 2024.
Childers, Chandra. 2024b. Breaking Down the South’s Economic Underperformance. Economic Policy Institute, June 2024.
Childers, Chandra. 2024c. Southern Policymakers Leave Workers with Lower Wages and a Fraying Safety Net. Economic Policy Institute, July 2024.
Cohen, Patricia. 2019. “Southerners, Facing Big Odds, Believe in a Path Out of Poverty.” New York Times, July 4, 2019.
Connor, Dylan Shane, and Michael Storper. 2020. “The Changing Geography of Social Mobility in the United States.” Proceedings of the National Academy of Sciences 117, no. 48 (November): 30309–30317. https://doi.org/10.1073/pnas.2010222117.
Cooper, David. 2011. “Census Tries to Better Identify Poverty and Finds What? More of It.” Working Economics Blog (Economic Policy Institute), November 9, 2011.
Corak, Miles. 2013. “Income Inequality, Equality of Opportunity, and Intergenerational Mobility.” Journal of Economic Perspectives 27, no. 3 (Summer): 79–102. http://dx.doi.org/10.1257/jep.27.3.79.
Dalaker, Joseph. 2022. Poverty in the United States in 2020. Congressional Research Service, February 2022.
Dixon, Rebecca. 2021. “From Excluded to Essential: Tracing the Racist Exclusion of Farmworkers, Domestic Workers and Tipped Workers from the Fair Labor Standards Act.” Testimony on behalf of National Employment Law Project before the U.S. House of Representatives Education and Labor Committee, Workforce Protections Subcommittee, Washington, D.C., May 3, 2021.
Economic Policy Institute (EPI). 2025. Current Population Survey Extracts, Version 1.0.60, https://microdata.epi.org.
Fisher, Gordon M. 2008. “Remembering Mollie Orshansky–The Developer of the Poverty Thresholds.” Social Security Bulletin 68, no. 3 (December).
Hegewisch, Ariane, Miranda Peterson, and Nina Besser Doorley. 2024. Gender and Racial Wage Gaps Worsened in 2023 and Pay Equity Still Decades Away (fact sheet). Institute for Women’s Policy Research, September 2024.
Mast, Nina. 2025. Forced Prison Labor in the “Land of the Free.” Economic Policy Institute, January 2025.
National Academies of Sciences, Engineering, and Medicine (NASEM). 2019. A Roadmap to Reducing Child Poverty. Washington, D.C.: The National Academies Press. https://doi.org/10.17226/25246.
O’Connell, Heather A. 2012. “The Impact of Slavery on Racial Inequality in Poverty in the Contemporary U.S. South.” Social Forces 90, no. 3 (March): 713–734. https://doi.org/10.1093/sf/sor021.
Perea, Juan F. 2011. “The Echoes of Slavery: Recognizing the Racist Origins of the Agricultural and Domestic Worker Exclusion from the National Labor Relations Act.” Ohio State Law Journal 72, no. 1: 95–138.
Pariona, Amber. 2018. “Which States Had the Most Slaves at the Start of the Civil War?” Commentary, World Atlas website, September 28, 2018.
Redd, Zakia, Dana Thomson, and Kristin Anderson Moore. 2024. Poverty Matters for Children’s Well-being, But Good Policy Can Help. Child Trends, May 2024.
Tomaskovic-Devey, Donald, and Vincent J. Roscigno. 1996. “Racial Economic Subordination and White Gain in the U.S. South.” American Sociological Review 61, no. 4 (August): 565–589. https://doi.org/10.2307/2096394.
Tucker, Jasmine, and Julie Vogtman. 2023. Hard Work Is Not Enough: Women in Low-Paid Jobs. National Women’s Law Center, July 2023.
U.S. Census Bureau. 2021a. “Geographic Levels.” Last modified October 2021.
U.S. Census Bureau. 2021b. Measuring America: How the Census Bureau Measures Poverty (fact sheet).
U.S. Census Bureau. 2023. “Poverty Thresholds by Size of Family and Number of Children” [Excel file], Poverty Thresholds. Updated January 23, 2025.
U.S. Census Bureau. 2024. “Table 9. Poverty of People by Region: 1959 to 2023” [Excel file], Historical Poverty Tables. Updated September 10, 2024.
U.S. Census Bureau, American Community Survey (U.S. Census Bureau ACS). 2023a. “B17001–B17001I: Poverty Status in the Past 12 Months by Sex by Age.” Public data series accessed via the Census data tool. Accessed March 2025.
U.S. Census Bureau, American Community Survey (U.S. Census Bureau ACS). 2023b. “S1703: Selected Characteristics of People at Specified Levels of Poverty in the Past 12 Months.” Public data series accessed via the Census data tool. Accessed March 2025.
Wodtke, Geoffrey T., Sagi Ramaj, and Jared Schachner. 2022. “Toxic Neighborhoods: The Effects of Concentrated Poverty on Environmental Lead Contamination in Early Childhood Development.” Demography 59, no. 4 (August): 1275–1298. http://doi.org/10.1215/00703370-10047481.