Mitch Daniels, deficit peacock
In issuing the Republican rebuttal to the State of the Union address, Indiana Gov. Mitch Daniels had the audacity to present himself as a fiscal conservative and lecture President Obama on economic policy. Daniels presenting himself as a fiscal conservative is farcical: The tax cuts he pushed through for President George W. Bush as director of the Office of Management and Budget (OMB) are responsible for roughly half of today’s structural budget deficit and half the public debt accumulated last decade. And as expensive as they were, those tax cuts failed to spur even mediocre job growth; Daniels and Bush presided over the weakest economic expansion since World War II, leaving Daniels with a dismal legacy as an economic policymaker.
Daniels ran OMB from Jan. 2001 to June 2003; during his tenure, he helped craft the 2001 and 2003 Bush tax cuts. (Later tax acts accelerated implementation of some of these tax cuts, but this is when the real fiscal malfeasance occurred.) When Daniels took charge of OMB, the Congressional Budget Office (CBO) was projecting a $5.0 trillion (4.0 percent of GDP) budget surplus over the next decade. When he left office, CBO was projecting a $1.4 trillion (-1.0 percent of GDP) budget deficit over the next decade. Roughly $4.8 trillion of the fiscal deterioration resulted from legislation enacted over 2001-2003; the tax cuts alone added $2.6 trillion to the public debt over 2001-2010. (The other major drivers of this fiscal deterioration were the wars in Afghanistan and Iraq, which Daniels didn’t bother to pay for or even put on budget.) The 2001 recession certainly contributed to the emerging deficits—just as half of this year’s deficit can be chalked up to economic weakness—but the Bush administration’s economic policies ensured a mediocre economic recovery.

From Flickr Creative Commons by republicanconference
Though this supply-side snake oil was peddled as economic stimulus, the Bush-era tax cuts failed every test of good stimulus: They were gradually phased-in, they were targeted to upper-income households likely to save rather than spend, and they were intended to be permanent. Better economic policy could have alleviated the ensuing ‘jobless recovery.’
These tax cuts were the dominant economic policy during the worst economic expansion since World War II, measured by economic growth, employment, or compensation (trough-to-peak from 4Q2001 through 4Q2007). Real GDP growth averaged only 2.7 percent annually, the slowest of all the post-war expansions (averaging 4.8 percent economic growth annually). The economy only gained 97,000 jobs a month on average—not even enough to keep pace with population growth. (By contrast, job growth averaged 237,000 per month under President Clinton, when we had higher tax rates.) Real total employee compensation grew only 2.3 percent annually, contrasted with average annual compensation growth of 5.0 percent growth in post-war expansions.
Instead, the Bush tax cuts exacerbated inequality with a huge giveaway to those who didn’t need it: The top 1 percent of earners received 38 percent of the Bush tax cuts even though these households captured 65 percent of income gains during this expansion, leaving just scraps for the middle class. The Bush-era tax cuts can only be characterized as a costly economic policy failure.
Michael Linden of the Center for American Progress coined the phrase “deficit peacock” for self-purported deficit hawks interested in attention but uninterested in fiscal responsibility. Paraphrasing Linden’s birding guide, these deficit peacocks: 1) Never mention revenues; 2) Offer easy answers; 3) Support policies that make the long-term deficit problem worse; and 4) Think our budget woes appeared suddenly in January 2009. This summarizes Daniels to a tee. For him to lecture President Obama on fiscal responsibility is shameful.
Obama’s State of the Union speech sends the right signals
President Obama’s State of the Union address builds on his speech in Osawatomie, Kan. in December and that is a very good thing. That speech identified “whether this will be a country where working people can earn enough to raise a family, build a modest savings, own a home, and secure their retirement” as the key issue and argued against “you’re-on-your-own economics,” the economic perspective that says everyone should fend for themselves. We have increasingly followed such a vision over the last few decades and the results are clear, “fewer and fewer of the folks who contributed to the success of our economy actually benefitted from that success. Those at the very top grew wealthier from their incomes and investments than ever before.”
In contrast, the SOTU speech said, “We can either settle for a country where a shrinking number of people do really well, while a growing number of Americans barely get by. Or we can restore an economy where everyone gets a fair shot, everyone does their fair share, and everyone plays by the same set of rules.”
Obama pointed the way with a “blueprint for an economy that’s built to last – an economy built on American manufacturing, American energy, skills for American workers, and a renewal of American values.”
This is a much more encouraging policy vision than that offered by any of the president’s possible political opponents in the upcoming election; their policies are various versions of cutting taxes, especially on incomes obtained from wealth, redistributing the tax burden onto middle-class and low-income families and generating large permanent deficits. This is doubling down on the failed policies of the past.
Of course, whether Obama’s plan can lead to the desired results will depend on a political configuration that allows such policies to be legislated. It also depends on having a budget policy that actually delivers on the expanded public investments in innovation, education, infrastructure and manufacturing that are central to this strategy. That requires reversing the current course of budgets which imply major retrenchment of public investments over the next 10 years. The president’s establishment of the Buffett rule can help in this regard, especially since the SOTU clarified it as, “If you make more than $1 million a year, you should not pay less than 30 percent in taxes.” It would be stronger and more effective if we just taxed earned and unearned income at the same rate.
Last, as the president has noted at other moments, the typical working family has not benefited from productivity gains and economic growth over the last three decades. His pillars of growth (clean energy, infrastructure, innovation, education and skills) will strengthen productivity growth but do not directly address the need to reconnect pay and productivity growth. That requires low unemployment, a much higher minimum wage, better and actually enforced labor standards, and establishing in practice the ability of workers to conduct collective bargaining. It requires a trade policy (and exchange rate policies) that does not undercut our manufacturing sector. It requires the administration to stop its silly mantra of doubling exports and ignoring imports since the reality is that it is the ‘net’ of these two that affects growth and jobs. It requires building an economy where the financial sector is not dominant. And, that will require policies opposed by wealthy interests, a difficult trick in the age of Citizens United. That means we will need to weaken the impact of money in our democracy. There’s nothing easy about this path, but there is no alternative if we truly seek a democracy and an economy that work for everyone.
Apple execs (like everyone else) overlook global exchange rates
Charles Duhigg and Keith Bradsher have a justly buzzed-about article in the New York Times this week on how the production of the iPhone (and Apple products more generally) has become almost completely globalized. A quick but important addition to their story, though, is the role of exchange rates. Yes, I’m getting boring on this topic, but, exchange rates are by far the single most important determinant of U.S. trade performance, so if the question is “why isn’t X made in the US anymore,” it’s very likely that the answer remains “the dollar is overvalued.”
And, strikingly, even the Apple-specific timeline fits the data regarding the biggest exchange rate development – China’s mammoth intervention in international currency markets to keep their own currency from rising vis-à-vis the dollar. This is how Duhigg and Bradsher write it up:
“In its early days, Apple usually didn’t look beyond its own backyard for manufacturing solutions. A few years after Apple began building the Macintosh in 1983, for instance, Mr. Jobs bragged that it was “a machine that is made in America.” In 1990, while Mr. Jobs was running NeXT, which was eventually bought by Apple, the executive told a reporter that “I’m as proud of the factory as I am of the computer.” As late as 2002, top Apple executives occasionally drove two hours northeast of their headquarters to visit the company’s iMac plant in Elk Grove, Calif. But by 2004, Apple had largely turned to foreign manufacturing….”
So, after 2002 Apple more and more turns to China for manufacturing? Huh. Not surprising – the graph below shows that the pace of Chinese accumulation of U.S. reserves (which leads inexorably to rising pressure on the dollar’s value, keeping Chinese products more competitive in U.S. and global markets) coincides with an accelerating increase in the U.S./China trade deficit around this time as well.
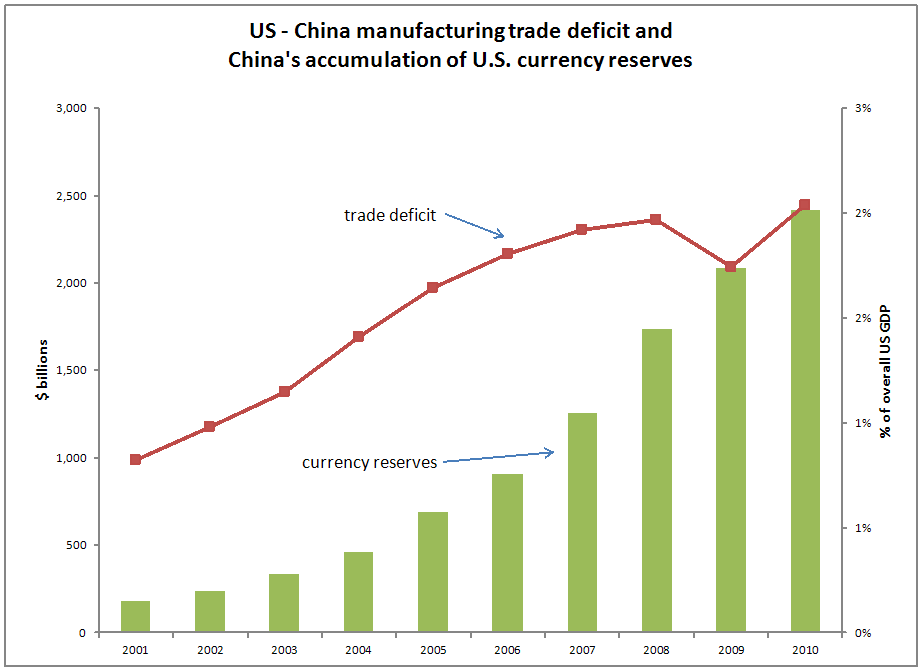
There is, after all, a reason why economists harp on the importance of the exchange rate – it drives lots and lots of hugely important economic decisions. As China intervenes to keep the value of its currency from rising against the dollar, this gives them an ever-increasing cost advantage versus the United States. The result is lots and lots of individual firm-level decisions (like Apple’s) to produce in China rather than the United States (because the exchange rate makes it cheaper) and the sum of these individual decisions cumulate to a huge aggregate trade deficit. The macro downsides of this trade deficit have been documented plenty of places, but if you’re writing about any feature of the US/China economic relationship and not mentioning this currency issue, you’re essentially writing Hamlet without the prince.
It’s frankly kind of amazing that Apple executives quoted in the article tell stories about how their global sourcing shifts are really about American skills, while managing to not mention global exchange rates. After all, there is an obvious trend in exchange rates and currency intervention that hamstring American competitiveness vis-à-vis China in the early-to-mid 2000s – but it’s awfully hard to make the case that American workers just got a lot dumber at the same time. But maybe blaming American workers can get some government subsidies for Apple to hire and train people in the U.S., while pointing out the effect of exchange rates might just lead to calls to rebalance the status quo U.S./China trade relationship – a status quo that has served Apple (and many other global manufacturers) very well.
A firewall has risen
It’s a pretty cool name for an otherwise drab concept. Yet, firewalls should matter to anyone who cares about government’s ability to promote economic growth, broadly shared prosperity, and social justice. Let’s start from the beginning, with the entire budget at $3.5 trillion (budget authority in 2011). Set aside mandatory programs—such as Social Security, Medicare, Medicaid, unemployment insurance, and other social safety net programs—and interest payments. All told, that’s about $2.1 trillion of the budget, or two-thirds of the total. The remaining third of the budget is discretionary spending, about 58 percent of which is defense and war spending. The rest (the green slice) is everything else: homeland security, veterans benefits, roads and bridges, education, energy , health, and environmental research, consumer protection, law and order, community development… it’s all in there. This portion of the budget, which comprises a paltry 14 percent of the total, is referred to with the exciting name “non-defense discretionary.”

Because discretionary spending is appropriated each year, Congress can only cut it for the current or upcoming budget year. Instead, it can cap discretionary spending, as it did last August when it passed the Budget Control Act (BCA). These caps act as procedural obstacles to appropriating more than a specified amount in future years (also known as “out-years”). BCA institutes caps on the out-years, but only a single discretionary cap (excluding war spending). This worried progressives because it could allow conservatives in Congress to increase spending on the Department of Defense and pay for the increase with even further reductions in non-defense. In other words, it would provide conservatives with a double-win: They get to spend more on the Department of Defense even as the rest of the government faces cuts, and they get to use those defense increases to their advantage, to force even larger cuts to the non-defense budget than would otherwise be required if the entire discretionary budget were cut proportionately. This is where firewalls come in. Earlier this month, the Office of Management and Budget and the Congressional Budget Office each released an update on what happens next now that the Super Committee has failed. Most people have been focused on the sequestration provisions, which don’t take effect until 2013 (and will be heavily impacted by the election outcome). But, quietly, something else happened: As per the BCA law, automatic firewalls between defense and non-defense are now the law of the land. We should always be worried that conservatives will play the defense budget against the non-defense budget, but the new caps, which put separate limits on defense and non-defense, will make that eminently more difficult. And without further ado, here are your new budget caps!

And a little historical context…

Obviously, this isn’t exactly shared sacrifice. Non-defense discretionary, at 3.2 percent of GDP, is already below the 35-year average of 3.9 percent. Yet these caps cut this portion of the budget by almost $100 billion more than the defense budget, bringing it down to 2.5 percent of GDP, the lowest level in more than 35 years (as far as the budget authority data extends).
‘Reformers’ playbook on failing schools fails a fact check
Education “reformers” have a common playbook. First, assert without evidence that regular public schools are “failing” and that large numbers of regular (unionized) public school teachers are incompetent. Provide no documentation for this claim other than that the test score gap between minority and white children remains large. Then propose so-called reforms to address the unproven problem – charter schools to escape teacher unionization and the mechanistic use of student scores on low-quality and corrupted tests to identify teachers who should be fired.
The mantra has been endlessly repeated by Secretary of Education Arne Duncan, and by “reform” leaders like former Washington and New York schools chancellors Michelle Rhee and Joel Klein. Bill Gates’ foundation gives generous grants to school systems and private education advocates who adopt the analysis. In Chicago, Mayor Rahm Emmanuel makes the argument, and in New York, Mayor Michael Bloomberg has frequently sung the same tune.
And now, New York Gov. Andrew Cuomo has joined in. On Dr. Martin Luther King Jr.’s birthday last week, the governor cast attacks on unionized teachers as a defense of minority students against the adult bureaucracy. “It’s about the children,” Mr. Cuomo said. Because of failing public schools, “the great equalizer that was supposed to be the public education system can now be the great discriminator.”
But this applause line about school failure is an “urban myth.” The governor, mayor and other policymakers have neglected to check facts they assume to be true. As a result, they may be obsessed with the wrong challenges, while exacerbating real, but overlooked problems.
Careful examination discloses that disadvantaged students have made spectacular progress in the last generation, in regular public schools, with ordinary teachers. Not only have regular public schools not been “the great discriminator” – they continue to make remarkable gains for minority children at a time when our increasingly unequal social and economic systems seem determined to abandon them.
We have only one accurate performance measure. The government administers periodic reading and math tests to samples of fourth, eighth and 12th graders. Called the National Assessment of Educational Progress (NAEP, pronounced “nape”), it is less subject to corruption than standardized tests now legally required of all schoolchildren.
NAEP samples are only large enough to produce reliable national and (for fourth and eighth graders) state estimates, but not for classrooms or schools. Thus, principals or teachers suffer no consequences for poor NAEP scores, giving them no incentive to steal time from instruction to drill on NAEP-type questions.
Not every selected student gets identical NAEP questions. Scores aggregate answers from different students’ booklets, covering different topics from the math and reading curriculums. In contrast, state and city standardized tests change little each year; teachers can predict which of many topics will likely appear, and focus instruction on those.
Here’s what NAEP shows: Average black fourth graders’ math performance in regular public schools has improved so much that it now exceeds average white performance as recently as 1992. The improvement has been greatest for the lowest achievers, those in the bottom 10 percent. Eighth graders show similar, though less dramatic trends. The black-white gap has narrowed little because whites have also improved.
These irrefutable facts characterize both the nation as a whole, and New York State specifically. In fact, New York State’s black children made enormous gains in the 1990s, and much slower gains once the federal No Child Left Behind, and Mayor Bloomberg’s and Chancellor Klein’s test-based reforms kicked in. From 1992 to 2003, for example, black fourth graders’ math performance jumped 22 scale points (about two-thirds of a standard deviation). From 2003 to 2011, the gain was only 5 scale points.
There is something perverse about using Dr. King’s birthday as the occasion for an accusation that schools have been the “great discriminators” when those schools have been boosting the achievement of African Americans at a far more rapid rate than they’ve been able to boost the achievement of whites.
Overall, the national and New York State data are hard to reconcile with a story that schools are filled with teachers having low expectations, poor training, and complacency arising from excessive job security, and the way to fix public schools is more accountability for student test scores.Read more
You can’t measure tax progressivity while ignoring income trends
Mark Thoma does a terrific job explaining why the purported measure of tax progressivity favored by many conservatives doesn’t measure tax progressivity. Former George W. Bush Press Secretary Ari Fleischer, the inspiration behind Thoma’s post, insinuated that those lucky duckies at the bottom and middle of the earnings distribution should be paying more because their share of federal taxes paid has been falling while that of the top earnings quintile has risen substantially since 1979. As Thoma elucidates, Fleischer’s captious reading of the Congressional Budget Office’s series on average federal taxes by income group ignores the heavily skewed income trends of the last 30-plus years.
This State of Working America chart depicts just how lopsided those gains have been: The top 10 percent have captured 64 percent of economy wide income gains, while the bottom 60 percent of earners received only 11 percent of income gains.

Data compiled by economists Emmanuel Saez and Thomas Piketty show that this trend intensified during the Bush economic expansion, when the top 1 percent of households captured a stunning 65 percent of income gains, leaving just 13 percent for the bottom 90 percent of households. (The top 1 percent of households was simultaneously rewarded with 38 percent of the Bush-era tax cuts, when fully phased in.) These data don’t square with calls to shift the tax burden from capital to labor, and correspondingly from upper-income households to the middle class.
A progressive tax system embodies the principle that groups with more resources should pay a higher portion of their income in taxes than groups with fewer resources; taxes as a share of income—or effective tax rates—are intended to rise with income. Ignoring income necessitates disregarding this proper measure of tax progressivity. By Mr. Fleischer’s concept of tax fairness, Mitt Romney’s 15 percent preferential tax rate is a non-issue and there’s no need for a Buffett Rule. Similarly, ignoring effective tax rates is terribly convenient for conservatives attempting to shift the distribution of taxation down the income distribution, as proposed in many of the former and current GOP presidential candidates’ tax plans.
Without looking at taxes paid relative to income, one ignores ability to pay and progressivity, period. This may be politically expedient for those who want to abolish the Sixteenth Amendment and replace it with a regressive flat tax, but it’s intrinsically problematic when income inequality has returned to Gilded Age-levels. A greater degree of progressivity must be restored to the tax code, which must also raise more revenue for the realities of an aging population, spiraling health care costs, and a large structural budget deficit. Specious concepts of tax fairness cannot be condoned; they mask deep, growing inequities and provide cover for regressive tax plans that would further exacerbate income inequality.
Don’t blame the robots: It’s not productivity growth that’s holding job growth back
The Wall Street Journal ran an article a couple of days ago implicitly arguing that accelerating productivity growth is a prime reason why labor market recovery from the Great Recession has been so sluggish. Another reporter asked me about it yesterday, so I figured I’d write up a couple of thoughts on it.
First, we should be clear that the pace of labor market recovery since the Great Recession has not been uniquely bad; since the trough of the recession, private sector employment growth has actually been exactly in line with the (admittedly too-slow) recoveries from the recessions of the early 1990s and 2000s. Overall employment growth has actually outperformed the recovery from the early 2000s recession. Figure A below shows the trends for private sector employment. Note that the jobs lost during the latest recession dwarf those lost during other recessions – but since the official recovery began, job growth has been on-par with recent recoveries. Note that policymakers should not be graded on this generous curve – it’s a disaster that we haven’t had a better recovery from that perspective. But one doesn’t need to generate new theories to explain this allegedly atypically bad recovery – it just hasn’t been atypically bad.

Second, and in line with Dean Baker’s response to the article, productivity growth has not been particularly fast since the Great Recession. Figure B below shows the behavior of productivity averaged over all recessions between 1947 and 1981, the average of the early 1990s and early 2000s recoveries, and growth since the Great Recession. So, again, one cannot argue that fast productivity growth presents unique challenges in the current recovery since its performance just hasn’t been all that unique.

Lastly, and maybe wonkiest, fast productivity growth doesn’t change the validity of Keynesian diagnoses of what the economy needs at all. In fact, it would just strengthen them. The root of the Keynesian diagnosis is that there is a large gap between aggregate demand and potential supply in the economy – or, a large “output gap.” Figure C below shows the problem – the large output gap between actual and potential GDP is the reason why we have such high unemployment today. Productivity growth just pulls the potential GDP curve upwards, which means, all else equal, that the output gap will rise (on the chart I illustrated this with the “actual, if productivity growth accelerated” line).
But, the obvious solution to this problem is simply to push up demand to make actual GDP equal potential GDP again. Basically, accelerating productivity growth would just make measures to boost demand more necessary, and would insure that no adverse supply-side response (say accelerating inflation or rising interest rates) would kick-in.

The root cause of today’s underperforming economy remains insufficient spending by households, businesses and governments to fully employ all those who want a job. And the cure for this is simply policy measures to boost spending. Yes, I’m sure this has gotten boring for many economy watchers who want newer and more exciting diagnoses and cures, but sometimes what’s true is pretty boring.
One quick thought on why explanations based on productivity growth can sound convincing: At any point over the past century you could have walked into a factory and been told about the big technological improvements that had been made over the past four years. If you’re a business writer who walks into a factory today looking for a root cause of the labor market’s doldrums, guess what? You’ll be told about the big technological improvements made over the past four years, and then you might think, “hey, that’s why the jobs aren’t here!” But, if you had walked into a factory in 2000 – when the unemployment rate reached 3.8 percent – You also would’ve been told about an amazing four-year run of technological advance. In the end, high rates of unemployment are about demand falling short of supply, period.
Romney may not like government, but he loves its tax subsidies
Former Massachusetts Gov. Mitt Romney has at long last revealed his tax rate, which he says is “probably closer to 15 percent than anything,” largely because his income “comes overwhelmingly from some investments made in the past, rather than ordinary income or earned annual income.”
Two points. One, generally speaking this isn’t a product of the ingenuity of Romney’s expensive tax accountants. Over the past 30 years, Congress has gradually lowered the top tax rate on capital gains from 40 percent in 1977 to the preferential rate of 15 percent today. In fact, the only significant increase in the capital gains tax rate in the last few decades was when it was paired with an even larger tax cut for high-income earners, a reduction in the top rate for ordinary income from 50 percent to 28 percent. (It should be noted, however, that Romney does benefit from the carried interest loophole, a defect in the tax code that allows private equity and hedge fund partners to reclassify their compensation as capital gains and thereby enjoy the 15 percent rate on all of their income, not just their capital income. But this loophole only exists because capital income enjoys a preferential tax rate in the first place.)

Second, this is a tax rate that most Americans would love to pay. According to the Tax Policy Center, an average family of four pays about 20 percent of its income in federal taxes (taking into account the employer-side payroll tax). This family’s tax rate will likely rise further if, as Romney’s tax plan calls for, the recent expansions of the EITC, the Child Tax Credit, and the Hope Credit (renamed the American Opportunity Tax Credit) are allowed to expire. Speaking of the Romney tax plan, 80 percent of its benefits would go to taxpayers like himself with income over $200,000—the same people that already disproportionately benefit from the preferential tax rate on capital income.
This gets to a more fundamental question: Why is the government favoring Romney’s income over that of most Americans? After all, it’s not like he’s been working recently—he’s been running for president for the better part of five years. And even if he did have the time to actively manage his investments, he’s not able to because they’re in a blind trust. As for the risk factor, sure he’s risking his capital, but he’s not bearing any more risk that most households in this economy face. So tell me again, why is it so important for the government to subsidize rich people like Romney at the expense of average American households?
The Gingrich nonsense
Newt Gingrich has been using the fast exchanges of the Republican presidential debates to ignore facts, misdiagnose economic problems and then present wrongheaded solutions. The key fact that he is ignoring is the Great Recession—the greatest economic downturn the country has seen since the depression of the 1930s. It is amazing that anyone could miss this fact, but, apparently, Gingrich has.
Once we acknowledge the existence of the Great Recession, Gingrich’s ideas stop making sense. His statement that “more people have been put on food stamps by Barack Obama than any president in American history” is ludicrous. The recession began in Dec. 2007; President Obama took office in Jan. 2009, more than a year later. The Supplemental Nutrition Assistance Program (SNAP, formerly known as food stamps) exists to reduce hunger in America. During this period of extreme economic hardship when the rate of hunger in America is high, our leaders should want the needy to turn to SNAP. Would a President Gingrich eliminate SNAP or prevent the number of SNAP recipients from rising during a recession?
Gingrich’s latest idea is to fire janitors in schools and “hire 30-some kids to work in the school for the price of one janitor, and those 30 kids would be a lot less likely to drop out.” It is true that teen (i.e., 16-to-19 years old) employment is correlated with positive student outcomes including high school graduation. But this is a horrible idea.
Think of a family where one parent is a janitor and one child is in high school. Gingrich is proposing to layoff the parent and replace the parent’s income with one-thirtieth the salary brought in by the child. Who knows how many hundreds of thousands of families would be plunged into poverty if this idea is ever implemented. We know that poorer children do worse in school, so any possible benefit from the increase in teen employment would likely be undone by the increase in poverty. One important reason that the teen unemployment rate is so high today is because of the Great Recession, the recession that began in the final year of the George W. Bush administration.

From Flickr Creative Commons by Gage Skidmore
It is great that Gingrich wants “to find ways to help poor people learn how to get a job, learn how to get a better job, and learn someday to own the job.” All Americans support these goals. But the real issue is this: What policies should we pursue right now to speed a full recovery from the Great Recession?
Gingrich wants to slash taxes. But we know that this is not the path to prosperity that Gingrich thinks it is. Mark Zandi, chief economist of Moody’s Analytics, tells us that tax cuts are among the weakest things we could do to stimulate the economy and that increased SNAP spending is among the best. The reason is simple. People on SNAP are experiencing economic hardship. They spend their benefits, circulating those dollars in the economy. Much of the added income produced by tax cuts to people who are well-off is saved and not spent.
We also know to be skeptical of the tax-cut strategy because we tried it during the George W. Bush administration and it failed. President Bush cut taxes and “the U.S. economy experienced the worst economic expansion of the post-war era.”
Further, after examining the Gingrich Jobs plan, Howard Gleckman of the Tax Policy Center reports that “Newt Gingrich is proposing a massive tax cut aimed at the highest earning American households. Gingrich’s plan would add about $1 trillion to the federal deficit in a single year.” It is hard to imagine worse economic policy than Gingrich’s economic ideas.
Once we begin the discussion with acknowledgement that the Great Recession, which began more than a year before President Obama took office, is the root cause of the massive loss of jobs we’ve seen since 2007, we can see that Gingrich’s economic proposals are disastrous for the U.S. economy. Apparently, he wants hungry Americans to stay hungry. He wants to lay off workers and replace them with children making a tiny fraction of the prior wage. During this period of high unemployment, this policy guarantees an increase in poverty. And, while he has increased hardship and misery for the poorest Americans, he wants to make sure that the richest Americans get even richer with massive tax cuts. Gingrich’s vision for America is an American nightmare.
Krueger links progressive taxation, income inequality, and economic mobility
At a Center for American Progress (CAP) event yesterday, Alan Krueger, chair of the president’s Council of Economic Advisers, gave a presentation on the rise and consequences of inequality. As mentioned in a post by Ross Eisenbrey, Krueger dove into a lot of interesting statistics, many of which were compiled into a PowerPoint presentation, and many of which are also documented on our website.
One point in particular that merits highlighting is that the U.S. tax code isn’t terribly progressive compared to other OECD countries. This chart (Figure 10 in Krueger’s slideshow) shows the Gini coefficient – a measure of inequality – for OECD countries both before and after taxes and transfers. Contrary to conservative fears of the consequences of policies that promote any sort of redistribution, the U.S. tax code is actually uniquely modest in its attempt to reduce income inequality. As shown below, each of the tax codes of every OECD country save Turkey, Mexico, and Chile do a better job of promoting broadly shared prosperity than the U.S.

Krueger links this to the issue of income mobility—that is, the ability of people to move between income classes—which has been eroding over time. The graph he presents (below) shows the strong link between these two issues, showing that higher income inequality is associated with lower intergenerational mobility.

One of the fundamental tenets of the American Dream is opportunity and economic mobility, which have been moving in the wrong direction. As Krueger points out, one way to arrest this disturbing trend is by making the tax code more progressive. And as the first graph shows, we have a lot of room to improve.