Briefing Paper #214
In early May, the Economic Policy Institute released a paper that argued the United States had entered a new recession, and compared the expansion that had just ended to previous ones. EPI found that the latest expansion ranked either at or near the bottom on a range of measures, especially those most relevant to working families like job creation and compensation growth.
Last week, the National Bureau of Economic Research, the arbiter of recession dating, confirmed EPI’s judgment on the recession’s timing. In light of that official recognition, EPI is re-releasing its comparison paper, which has also been updated to reflect government data revisions in many of the key series cited in the report.
December 9, 2008
Evidence is mounting that the U.S. economy is in a recession. If this is the case, a complete business cycle from 2001 through the end of 2007 (or perhaps the start of 2008) is now on the books, and the economic performance of the current decade can be held up in comparison to that of past business cycles. By almost all measures, the most recent expansion was the worst since WWII.
A variety of recent economic data now show a pattern consistent with the start of a recession. Since 1951, three consecutive months of job declines have always been signals of a recession; the U.S. employment rate declined for the first three months of 2008. Furthermore, the unemployment rate rose from 4.4% in March 2007 to 5.1% in March 2008.
Economic output also began decelerating in the fourth quarter of 2007 to a 0.6% annual rate, an anemic pace that continued into the first quarter of 2008. Several of the internal indicators in the recent gross domestic product report—including consumption of goods and business investment—saw outright declines. Other monthly indicators—including industrial production and payroll employment—peaked in either the fourth quarter of last year or the first quarter of this year. Real income (less transfers) has been flat since last September.
While it will be many months before an “official” recession is declared, evidence shows that the economic expansion that began in 2001 has almost surely ended.1 Furthermore, if these trends continue, the start of a new recession will likely be dated either at the end of the last quarter of 2007, or at some point during the first quarter of 2008.2
Finally, financial market turmoil, housing price declines, and higher energy costs are all likely to place continued downward pressure on the macro economy, thus leading to a longer period of diminished economic activity.
Safely assuming that the expansion ended near the start of 2008, we can compare this cycle’s performance to those of the past.
The bottom line of such a comparison is that the economic performance from 2001 to 2007 was anemic by most measures, especially in regards to the labor market. For the vast majority of American households—that is, those who depend on earnings derived from the labor market for the bulk of their income—the economy has been seriously mismanaged.
How strong was the expansion?
Administration officials, including President Bush himself, have suggested that the “fundamentals are strong” even as the nation was clearly drifting toward recession:
“The fundamentals are strong, we’re just in a rough patch, as witnessed by the employment figures today.”
—President Bush, February 1, 2008
http://www.whitehouse.gov/news/releases/2008/02/20080201-7.html“The U.S. economy is structurally strong, but we are experiencing a period of economic challenge.”
—President Bush, March 14, 2008
http://www.whitehouse.gov/infocus/economy/
This paper retrospectively assesses these claims of “strong fundamentals” by examining U.S. economic performance over the full run of the latest business cycle that began in March 2001 and comparing this recent performance with past cycles. Key findings include:
- Of the 10 expansions since 1949, as measured from the end of the recession (trough) to the end of the expansion (peak), the expansion from 2001 through last year ranks last in average growth of GDP, investment, employment growth, and employee compensation.
- GDP growth in the latest expansion was a full 40% slower than the post-World War II average (2.7% versus 4.8% in previous expansions).
- Despite tax changes that were promoted as incentives to increase investment, average growth in total investment over the latest expansion was less than half of the post-WWII average, and ranked last in this group.
- Compared to the start of the last recession (the peak that occurred in the first quarter of 2001), the percent of the population employed declined by 1.5 percentage points by the end of 2007. The only previous drop in this measure relative to a previous business cycle peak came during the mini-expansion of the early 1980s, and the drop in the latest expansion was five times as large.
If this employment-to-population ratio had remained constant, there would have been roughly 3.2 million more jobs, or an additional 39,000 jobs created each month in the U.S. economy over the course of the most recent expansion.
- Corporate profits were the only area of strength in the latest full cycle, ranking 2nd strongest among the last the prior 10 cycles.
Assessing macroeconomic performance
Assessments of economic performance can vary substantially depending on the start and end dates chosen for comparison. For example, an assessment of GDP growth that starts in the middle of a recession and ends in the middle of a boom would look artificially good compared to a longer-term average over equivalent points within a cycle.
A fairer assessment compares the economy’s performance over equivalent phases of the business cycle. This paper does so by comparing the latest business cycle with former ones, both over the course of a complete recession-expansion cycle (a “peak-to-peak” measure) and over the course of the expansion alone (a “trough-to-peak” basis).
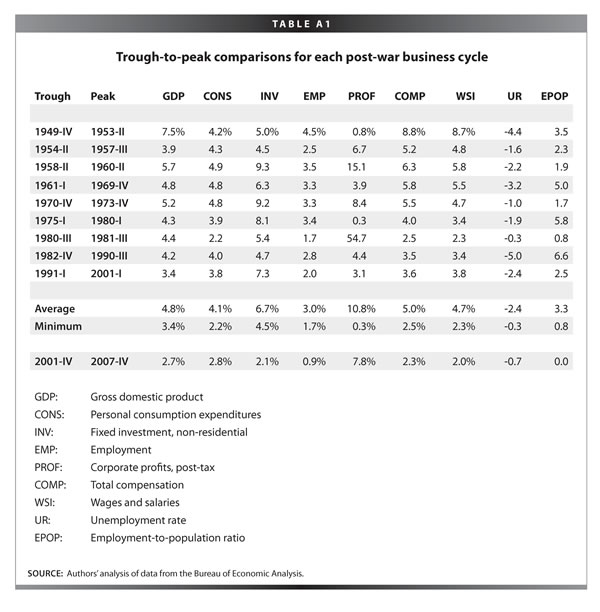
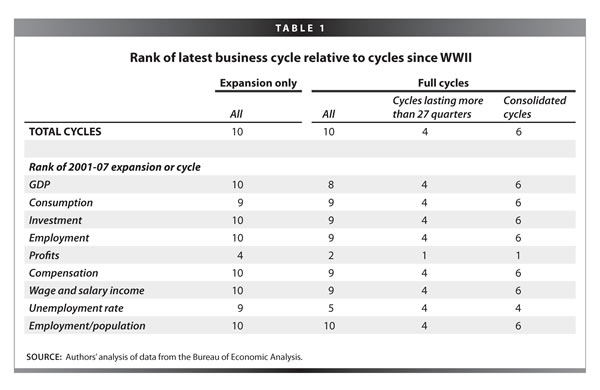
By nearly all measures, the expansion from 2001 to 2007 ranks as one of the worst on record. Table 1 provides the relevant rankings for all of the comparisons in this paper. Full data on growth rates for all of these indicators are available in Appendix Tables A1-A4.3
Measuring booms: Trough-to-peak
The first column of Table 1 ranks various indicators for each economic expansion since the end of World War II. This column measures from the beginning to the end of each expansion (trough-to-peak) as identified by the National Bureau of Economic Research (NBER)) since the end of World War II.4
Of the 10 trough-to-peak expansions since WWII, the 2000s rank last in growth of GDP, investment, labor compensation, and the employment-to-population ratio. The 2000s expansion is next-to-last in consumption, and in improving unemp
loyment rates. Profits in the 2000s did a bit better, coming in fourth overall.
It is frequently (and generally correctly) argued that economic policy makers cannot be held solely responsible for an economy entering recession. Many other factors beyond economic policy are important, and some cyclical variation is inevitable. Measuring from trough-to-peak could thus be considered a relatively generous way to evaluate economic policy, as it removes the effect of the recession from their grade. It is explained below how this method of comparison may actually harm the relative rankings of the 2000s, and its ranking over different phases of the business cycle is provided.
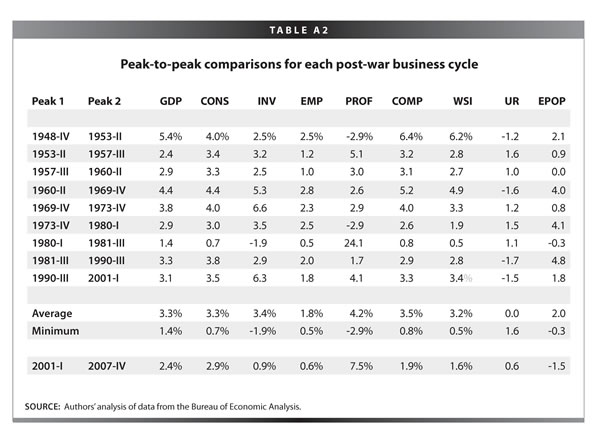
Measuring the full business cycle: Peak-to-peak
Column 2 of Table 1 uses an alternative metric: evaluating the economy over the course of a full business cycle, including a recession as well as the subsequent recovery. This is a “peak-to-peak” comparison.
While at first glance this comparison may seem ungenerous to current policy makers, it is actually quite loaded against a poor finding for the latest expansion. Deeper recessions tend to result in stronger expansions as the economy bounces back. The 2001 recession was quite mild in most terms, so this bounceback effect was weak.
The rankings for all 10 full business cycles since WWII show that the 2000s rank eighth in GDP, ninth in business investment, consumption spending, employment growth, and labor compensation, and last in the ratio of the population employed. The 2000s are middling (fifth) in improving unemployment rates and second-best overall in profits growth.
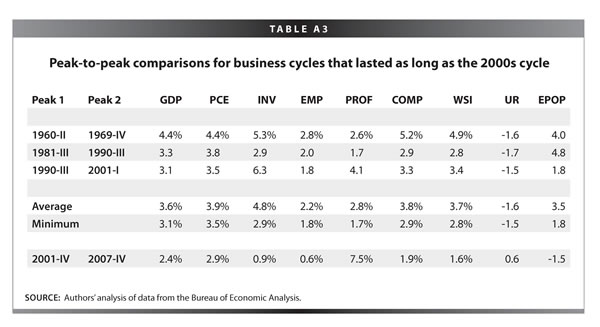
Peak-to-peak comparisons of comparably long cycles
Column 3 compares the 2000s to other peak-to-peak cycles that lasted at least as long as this most recent cycle (27 quarters). Peak-to-peak comparisons of business cycles of different lengths can potentially be misleading since the shorter cycles had less time to recover from recessions of varying length.
By this measure, the 2000s look particularly bad, ranking last in growth of GDP, personal consumption, business investment, labor compensation, employment-to-population ratio, and the reduction of unemployment. That is, in every single category except growth in corporate profits, the 2000s ranked last when compared to other business cycles that lasted at least as long.
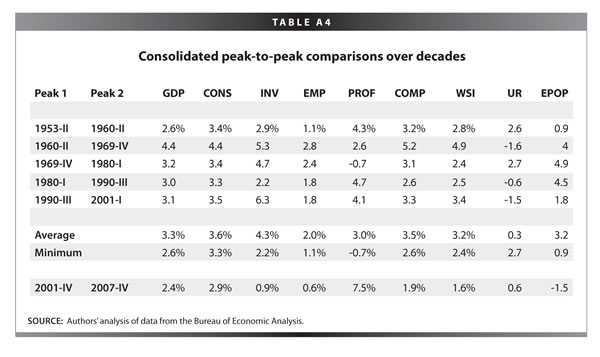
Peak-to-peak comparisons of decades
The last column in the table reports results gained from consolidating short cycles in the 1950s, 1970s, and 1980s, and using peak-to-peak comparisons to show the broad sweep of economic growth throughout each of the last six decades.
By this comparison, the most recent cycle ranks last in growth of GDP, personal consumption, business investment, labor compensation, and the employment-to-population ratio. Only corporate profits compared favorably, where the 2000s come in second overall.
Assessing job-growth and family incomes
As the recession began in the start of 2008, the unemployment rate was 5.1%, relatively low by historical standards. However, this low average rate masks the serious labor market weakness of the 2000s expansion.
Policy makers in 2001 inherited an economy that had sustained low unemployment (below 5%) for almost four years. This inheritance was driven overwhelmingly by a new recognition that unemployment rates at these levels were, contrary to previous wisdom, consistent with stable rates of inflation. This new recognition led the Federal Reserve to allow these low rates to persist without raising interest rates.5
Because the level of the unemployment rate is largely an expansion’s inheritance, the more relevant measure for comparing labor market performance across time is changes in the unemployment rate. On this measure, the 2000s unemployment performance is less than mediocre.
Perhaps the single most visible indicator of the economy’s performance for most American families is the simple availability of jobs. As noted before, the most recent cycle is a poor performer when compared to past cycles, both in regards to the slow payroll employment growth (0.6%) and also in the large drop in the employment-to-population ratio (-1.5 percentage points).
If the employment-to-population ratio had just remained constant over the cycle (which would still be a stark underperformance relative to the past), the economy would have an additional 3.2 million jobs today, or an additional 39,000 jobs created per month during the 2000s.6
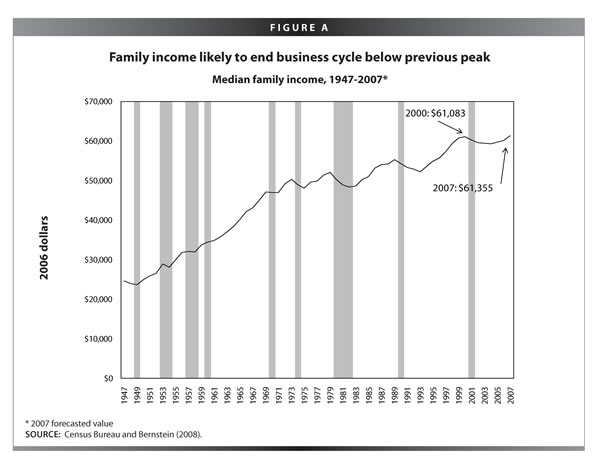
This weak job market is most likely the driver of another trend: the historically poor performance of median family income over the course of the 2000s. Figure A below shows that median family income—income earned by families in the middle of the income distribution, with half of all families poorer and half richer—took seven years to surpass its previous peak and tied for the longest such lag since World War II.7
Temporary influences: Housing and taxes
The anemic performance of the U.S. economy in the 2000s is even more striking when one considers that the economy was boosted greatly (in the short-run) by two unsustainable influences: the meteoric rise in housing prices and the over $1 trillion in deficit spending resulting from tax cuts passed by the Bush administration and the Congress.
First, the historic home price increases led to record levels of residential investment spending, and the ability of households to withdrawal equity from their homes to support current spending essentially gave disposable incomes a 5% boost over the run of this business cycle relative to those in the past.8 However, the recession resulting from the housing market decline will be more severe and protracted as residential construction continues to fall and consumer spending is slowed due to the decline in home equity withdrawals.
Secondly, the Bush administration and the Congress enacted two major tax changes (in 2001 and 2003) that added over $1 trillion in federal deficit spending to the U.S. economy. In the short-run, deficit spending can boost economic growth; however, it is unlikely to have a significant impact on longer-run growth. The resulting budget deficit puts further economic growth at risk as it constrains the nation’s ability to address other pressing problems: the Bush tax changes have meant that future policy makers have less leeway to address unmet social needs through public spending and have less room to use deficit spending to fight recessions. Again, these future costs come at the expense of a tax policy that that has not yielded much in the way of past or present benefits.
As noted above, whatever the impact has been of the Bush tax and economic policies, they have not led to superior macroeconomic performance. In fact, the economic performance of the last expansion has been one of the worst on record by most measures.
Conclusion
By most widely-accepted and honest measures, the most recent economic expansion should receive a failing grade. Measures of total output, investment, consumption, employment, wage and income growth, all rank at or near the bottom when compared with past business cycles.
Worse, these anemic results have been accompanied by rising inequality as well, meaning that the bulk of the (historically weak) gains have accrued to a small sliver of the population. This makes the fruits of the current recovery even smaller for the typical working family.
For most American families, this has been a fundamentally weak U.S. economy for some time, and it seems poised to get much worse. Now is the time for a new direction
in economic policy.
Endnotes
1. The National Bureau of Economic Research is commonly seen as the final word on determining business-cycle turning points. Final determination of the start and end of recessions typically does not happen until there is substantial economic data to indicate a prolonged downturn, which can be many months after the economy has entered a recession.
2. Further evidence on the slowdown and the possible timing of a recession can be found at http://www.recessionwatch.org.
3. Because most of the data analyzed comes out quarterly, this is the frequency used in this paper. For data that comes out monthly (employment, unemployment, and employment-to-population ratios), quarterly averages are calculated.
4. The NBER identifies both monthly and quarterly peaks and troughs. This paper uses quarterly data, measuring from the quarterly peaks and troughs.
5. There is also some evidence that the long-run rate of unemployment declined in the 1990s and 2000s as greater shares of the workforce entered their 40s and 50s—ages where people generally have higher rates of employment and less career instability.
6. The calculation for this simply multiplies 1.5% by the civilian non-institutional population at the end of 2007. While it could be true that some of the drop-off in the employment-to-population ratio is due to the aging of the population and withdrawal from the labor force of retirees, the measure tracked in this paper is actually the EPOP of the 25-54-year-old population, which, in the latest recovery, fell by exactly as much as the overall rate (1.5%).
7. Note that family income peak often occurs slightly before macroeconomic peak.
8. See http://www.epi.org/content.cfm/webfeatures_snapshots _20080319
Appendix