A minimum-wage increase in Illinois: Helping working families in the Land of Lincoln
The Illinois state legislature begins its next session this week and will likely debate a bill that will raise the state minimum wage from $8.25 to $10.65 over four years—providing a substantial boost to the state’s lowest-paid workers and the economy. The measure will mirror a similar proposal from last year, S.B. 1565, which would have raised the minimum wage in four steps and, after reaching $10.65, would have tied future increases to inflation. That measure would give 1.1 million low-wage workers a raise, providing more than $3.8 billion in increased wages for directly affected workers.
During the last 30 years, the real value of the Illinois minimum wage has eroded and working families’ incomes have essentially stagnated, reflecting the rest of the nation’s growing wage inequality. Restoring Illinois’ minimum wage to its pre-erosion level would help to return it to its original intent as a policy that sets wage standards for low-wage workers at a level that is high enough to be meaningful. Restoring the value of the minimum wage through incremental annual increases will ensure that it never again strays from its original purpose as a basic protection of fair wages.
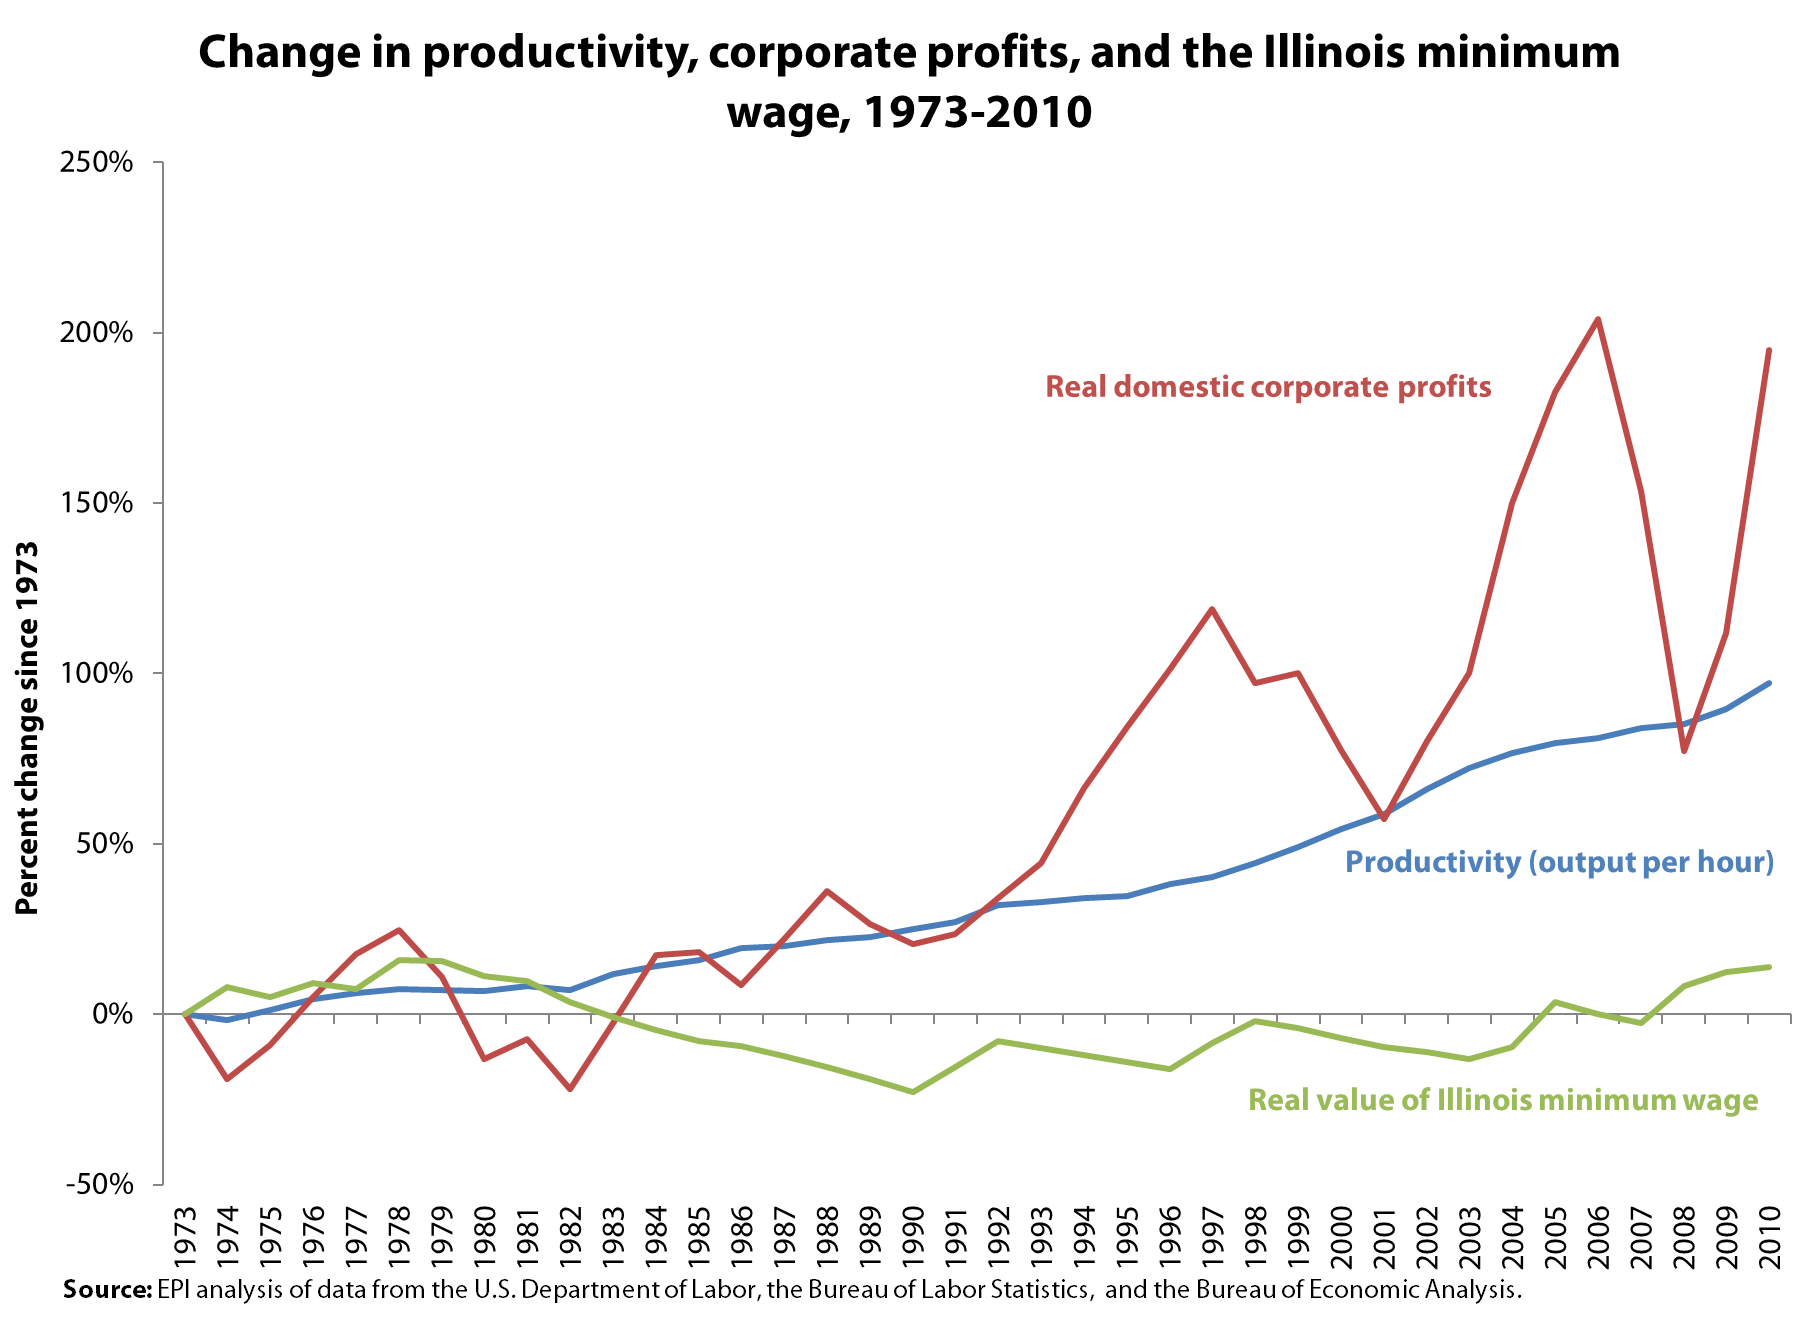
We know that a minimum-wage increase will boost the earnings of working families in Illinois—an added bonus is that it’s a tool for economic growth. It spurs spending by the workers who get the raise, thereby increasing economic activity and, in turn, creating jobs. It’s time that the American worker starts to share in the prosperity that corporate America has enjoyed—thanks to the growing productivity of workers—since the 1970s. A minimum-wage increase in Illinois would mean a shift from corporate profits to the America worker and would start to reverse the trend of increasing inequality evident since 1973. While corporate America enjoyed more than 200 percent growth in profits from 1973 to 2006, the real value of the Illinois minimum wage in 2010 was only 14 percent higher than it was in 1973. During the same period, American workers’ productivity increased almost 100 percent. The graph below shows this overwhelming disconnect:
Keeping the real value of the Illinois minimum wage at a level that allows low-wage workers to afford basic necessities is a policy that Illinois families cannot afford to lose—most minimum-wage workers are at least 20 years old and have total family incomes of less than $45,000. The consumer spending of workers affected by this increase will create a direct stimulus effect, pumping more than $2 billion into the economy and creating 20,000 jobs.
Amid persistently high unemployment (9.8 percent in Illinois), a resulting lack of wage growth, and a severe jobs deficit in Illinois, there will be no upward pressure on wages for a very long time. Since raising the minimum wage helps working families, does not cause job loss, and is a boost to the economy, now is exactly the time to increase the minimum wage.
Austerity’s effect on state job growth
David Leonhardt of the New York Times has a chart on the Economix blog today that shows how austerity measures at the federal, state, and local levels have held back growth in the U.S. economy over the past year and a half. As the blue line from his chart indicates, despite gains in the private sector, public sector growth was negative every quarter since Q3 2010.
What does this look like in terms of jobs? As you can guess, it isn’t pretty. In a blog post last September, I noted that government job losses are at the heart of overall job losses in numerous states since the recession officially ended in June 2009. Just to coincide with the timeframe I’ve noted from Leonhardt’s chart, the table below shows the change in government employment, total job losses for industries that lost jobs, and government losses as a percentage of total losses by state since Aug. 2010. The Dec. 2011 state unemployment rates and net change in employment figures are shown as well.

The numbers are pretty explicit: For the United States as a whole, every major industry except for government has gained jobs since Aug. 2010. Federal, state, and local governments have lost 440,000 jobs over that timeframe, accounting for 100 percent of losses for industries that lost jobs. Just to clarify, this does not mean that only government workers lost their jobs, but for every non-government worker in the country that lost a job over the past four months, at least one more job was created someplace else in that industry.
At the state level, government accounted for more than half of all job losses for industries that lost jobs since Aug. 2010 in 27 states, and made up 100 percent of losses for industries that lost jobs in Arizona, Idaho, Massachusetts, North Dakota, Oregon, Pennsylvania, and Texas. Government losses also made up more than 50 percent of losses in seven of the 10 states with the largest number of jobs lost, and six of the 10 states with unemployment rates above 9.5 percent.
Of course, the private sector will absorb some of these losses and thankfully we have seen a positive net change in employment for most of these states since Aug. 2010. But make no mistake, the idea that drastic cuts to public budgets would somehow spur private-sector growth is a myth that has undermined recovery efforts both in the United States and in Europe. In reality, cuts to public-sector budgets have a significant negative private-sector impact. As my colleague Ethan Pollack has demonstrated, “for every dollar of budget cuts, over half the jobs and economic activity will be lost in the private sector.” Net change in employment since Aug. 2010 may be positive for most states, but it’s frustrating to think how much better these job numbers might be if we hadn’t spent the past 16 months shooting ourselves in the foot.
Research assistance by Natalie Sabadish
Massive tax cuts don’t square with professed concerns about public debt
The Washington Post editorial board astutely notes that the budget busting tax plans of the GOP presidential candidates contradict purported concerns about the budget deficit and national debt. Relative to the inadequate revenue levels collected by current tax policies, the tax plans would lose between $180 billion and $900 billion in 2015 alone—or between 1.0 percent and 4.9 percent of GDP. Former Massachusetts Gov. Mitt Romney’s tax plan and former Pennsylvania Sen. Rick Santorum’s tax plans, respectively, represent the low and high end of this range, but former Speaker of the House Newt Gingrich gives Santorum a run for his money with a tax plan that would lose $850 billion, or 4.6 percent of GDP, in 2015.
Under an extension of current policies, the budget deficit is projected to average around 4.3 percent of GDP over the next decade, which is unsustainable in the sense that debt as a share of the economy will continue to rise instead of stabilizing in the second half of the decade. Despite all the fear mongering rhetoric about Washington’s fiscal malfeasance heard from the GOP campaign trail, some of the candidates’ tax plans would more than double the budget deficit over the next decade.
The Post’s editorial board notes that the revenue loss estimates (calculated by the Tax Policy Center) are static scores, meaning that they don’t include growth effects (i.e., dynamic scores). Yet the growth legacy of the last round of deficit-financed, regressive tax cuts—the kind supply-siders love and the kind being floated on the campaign trail—proved a massive flop. This new round of massive tax cuts would either be deficit financed—trading public (di)savings for private savings—and/or financed with deep cuts to public investments and economic security programs, which would drag on growth (among other adverse economic outcomes). Mr. Santorum’s proposed balanced budget amendment, for instance, would force unfeasibly draconian spending cuts across the entire federal budget. His tax plan wouldn’t raise anywhere close to 18 percent of GDP, where he has proposed capping federal spending—current tax policies will raise only 17.6 percent of GDP over the next decade.
The distributional implications of these tax plans are just as concerning as their revenue impact and are amplified by their budgetary impact, which will force spending cuts that don’t show up in TPC’s distributional table. As the Post notes: “It makes no sense to further benefit the wealthiest taxpayers at a time when spending programs for the most vulnerable would be on the chopping block — of necessity, given the candidates’ pledges to cap spending. In their fiscal consequences these cuts would be disastrous; as a matter of fairness, even more so.”
Massive tax cuts don’t square with fiscal responsibility, as aptly demonstrated during the George W. Bush administration. Massive tax cuts targeted toward upper-income households will, however, exacerbate income inequality and undercut the middle class by defunding public investments and economic security programs. But the fiscal debate is not about the budget deficit, the public debt, or the middle class: It is about federal revenue and spending levels as a share of the economy, as epitomized by Grover Norquists’ Taxpayer Protection Pledge. Until conservatives reenter the realm of reality and acknowledge that revenue levels must go up, not down, fiscal responsibility and a sustainable trajectory for debt will remain unattainable.
Maybe Reagan was onto something…
Paul Krugman makes some good points about “post-modern” recessions (i.e., the last three, starting in 1990, 2001, and 2007, and which have all been followed by agonizingly slow recoveries) and then ends by asking, “And what about Reagan? Reagan who?” in making the point that very fast recovery following the 1981 recession was largely driven by monetary policy decisions.
This is mostly right, but, let’s look at the behavior of government spending following the last four recessions (i.e., the 1981 recession as well as the three “post-moderns”). The graph below measures real government spending relative to the previous business cycle peak.

So, 16 quarters after the start of the 1981 recession government spending was up nearly 19 percent relative to the pre-recession peak, while 16 quarters after the Great Recession of 2007, it’s up less than 1 percent. Let’s do some quick math. If we mimicked government spending growth from the 1981 recovery, government spending today would be about 18 percent higher than it was in the last quarter before the recession began – adding about $440 billion (in $2005) to overall GDP. This would lead to a roughly 3 percent boost to GDP and more than 3 million extra jobs not including any multiplier effects. Put a run-of-the-mill 1.4 multiplier on this and you have well over 4 million extra jobs – or roughly 40 percent of the entire “jobs gap” caused by the Great Recession that would now be filled.
Yeah, this is one thing about the 1981 recovery I’d like to replicate.
The Fed’s longer-run goals: Defining success down?
Yesterday, the Federal Reserve released a statement regarding its “longer-run goals and monetary policy strategy.” What seemed to the biggest news for most covering the release was the Fed’s identification of an explicit inflation target: 2 percent annualized growth in the personal consumption expenditures’ price index (oddly, they don’t specify just the “core” price index that removes more volatile items – not sure why).
This is pretty big news – and pretty bad news. While they leave themselves plenty of wiggle room to go above this target during particular circumstances, the economy could benefit greatly from an inflation target substantially above this 2 percent for the next several years, and it’s hard to see how yesterday’s statement makes this much easier. One could argue that by establishing a “long-run target” of 2 percent, the Fed could then justify shorter-term inflation targets above this level to make up for particularly disinflationary periods (like, say, the past four years), but again, the statement was pretty explicit about the 2 percent long-run target and not explicit at all about going above this in the near-term.
Bigger news, perhaps, was the statement’s identification of the “longer-run normal rate of unemployment” as being between 5.2 and 6 percent. This was always going to be the danger of a deep, drawn-out recession – policymakers will be tempted to declare “mission accomplished” well before unemployment has reached pre-recession levels (5 percent in Dec. 2007, 4.6 percent for the annual average of 2007), let alone before reaching levels that actually sparked widespread (and non-inflationary) wage-growth (the 4.1 percent average for 1999 and 2000, for example).
This is an old story – policymakers, particularly at the Fed, have for much of the past 30 years preemptively moved against higher rates of inflation by slowing the economy as unemployment has reached predetermined “longer-run normal” rates (the exact jargon and acronym for this magical rate that the economy allegedly cannot go below without sparking runaway inflation varies). Through much of the 1980s and early 1990s, economists more concerned with lower rates of unemployment than battling incipient inflation (sometimes called “inflation doves,” though I prefer “unemployment hawks”) argued that the Fed should at least test the limits of lower unemployment before short-circuiting recovery. And the late 1990s expansion proved them right – unemployment fell far below the contemporaneous estimates of the “longer-run normal rate” and yet inflation failed to accelerate.
Failing to heed this lesson and declaring that the best possible outcome that can be reached is an unemployment rate up to 1.5 percent higher (translating to three million extra unemployed workers) than what prevailed in the year before the Great Recession hit will just constitute one more severe casualty of this episode.
Discriminatory mortgage lending intensifies racial segregation
On December 21, Bank of America settled a Justice Department complaint alleging racial discrimination in mortgage lending by its Countrywide subsidiary. But underlying issues are far from resolved. Longstanding federal inaction in the face of widespread discriminatory mortgage lending practices helped create, and since has perpetuated, racially segregated, impoverished neighborhoods. This history of “law-sanctioned” racial segregation has had many damaging effects, including poor educational outcomes for minority children.
Bank of America’s Countrywide subsidiary was not alone in charging higher rates and fees on mortgages to minorities than to whites with similar characteristics, or in shifting minorities into subprime mortgages with terms so onerous that foreclosure and loss of homeownership were widespread. Racially discriminatory practices in mortgage lending (known as “reverse redlining”) were so systematic that top bank officials as well as federal and state regulators knew, or should have known, of their existence and taken remedial action.
Such complicity in racial discrimination by federal and state banking and thrift regulators is nothing new; in the past, they were complicit in “redlining”—the blanket denial of mortgages to minority homebuyers.
In the cases both of redlining and reverse redlining, regulatory failure has been destructive to the goal of a racially integrated society. Redlining contributed to racial segregation by keeping African Americans out of predominantly white neighborhoods; reverse redlining has probably had a similar result. Exploitative mortgage lending has led to an epidemic of foreclosures among African American and Hispanic homeowners, exacerbating racial segregation as displaced families relocate to more racially isolated neighborhoods or suffer homelessness.
The legal settlement requires Bank of America to spend $335 million to compensate victims of Countrywide’s discriminatory lending practices. This sum, while the largest fund to date for compensation of victims of discriminatory subprime lending, is still insufficient to restore their access to homeownership markets and to middle-class neighborhoods. In consequence, it will also do little to address the comparatively poor educational outcomes of children who are now more likely to grow up in racially segregated communities, nor the damage to learning that results when schooling has been disrupted by an unstable housing situation.
SNAPSHOT: Good credit didn’t protect Latino and black borrowers
State of the Union: Manufacturing a Better Future
In his State of the Union Speech last night, President Obama outlined a blueprint for rebuilding the economy the right way, by rebuilding American manufacturing, expanding clean energy investments and by fixing our broken infrastructure. Kudos to him for continuing to highlight this important issue, but he failed to mention the main cause of our manufacturing woes in the first place: currency manipulation.
First, some background. China currently engages in massive intervention in currency markets, buying U.S. dollar-denominated assets to boost the value of the dollar and keep their own currency artificially cheap. This acts as a subsidy to U.S. imports from China, and it raises the cost of U.S. exports — both to China and to every country where U.S. exports compete with goods coming from there. Of the nearly 6 million manufacturing jobs we lost between Jan. 2000 and Dec. 2009, 2.8 million jobs were displaced by growing trade deficits with China between 2001 and 2010.
Manufacturing employment is growing again, with 322,000 jobs added in the past two years. But millions of jobs have been left on the table. By ending currency manipulation with China and other Asian countries, we could create up to 2.25 million jobs over the next 18 to 24 months, boost GDP by up to $285.7 billion, and reduce the federal budget deficit by up to $857 billion over the next 10 years.
The president proposed some well-intended changes in tax policy designed to reduce incentives for manufacturing firms to outsource production abroad and to encourage them to bring jobs home. But tax policies only work around the margins of manufacturing employment. We need to go after root causes of manufacturing job loss such as currency manipulation by China and other Asian nations.
The Senate passed a bill last fall that would allow the Commerce department to penalize imports from China that have benefited from illegal currency manipulation. But House leaders will not allow the measure to come to a vote. The Obama administration has failed to do its part as well. Six times they have refused to identify China as a currency manipulator, denying the elephant in the room.
There are certainly other unfair trade practices beyond currency manipulation worth fighting. China provides illegal subsidies to domestic and foreign firms in a wide range of industries including steel, glass and paper. It also subsidizes clean and green technology industries, and maintains extensive barriers to imports of manufactured goods from the United States and other countries. The president announced important steps to create a new trade enforcement unit to bring together resources from across the government to attack unfair trade practices. This will allow the government to initiate new unfair trade cases against China and other unfair traders.
But with a gridlocked Congress held hostage by the Republican controlled House that has refused to compromise with the Senate or the administration, President Obama’s hands are tied on new initiatives that require congressional approval. Certainly, there is more that he could do to fight unfair trade, for example by confronting China over currency manipulation. But the administrative measures outlined in his SOTU address will begin to make a difference.
Mitch Daniels, deficit peacock
In issuing the Republican rebuttal to the State of the Union address, Indiana Gov. Mitch Daniels had the audacity to present himself as a fiscal conservative and lecture President Obama on economic policy. Daniels presenting himself as a fiscal conservative is farcical: The tax cuts he pushed through for President George W. Bush as director of the Office of Management and Budget (OMB) are responsible for roughly half of today’s structural budget deficit and half the public debt accumulated last decade. And as expensive as they were, those tax cuts failed to spur even mediocre job growth; Daniels and Bush presided over the weakest economic expansion since World War II, leaving Daniels with a dismal legacy as an economic policymaker.
Daniels ran OMB from Jan. 2001 to June 2003; during his tenure, he helped craft the 2001 and 2003 Bush tax cuts. (Later tax acts accelerated implementation of some of these tax cuts, but this is when the real fiscal malfeasance occurred.) When Daniels took charge of OMB, the Congressional Budget Office (CBO) was projecting a $5.0 trillion (4.0 percent of GDP) budget surplus over the next decade. When he left office, CBO was projecting a $1.4 trillion (-1.0 percent of GDP) budget deficit over the next decade. Roughly $4.8 trillion of the fiscal deterioration resulted from legislation enacted over 2001-2003; the tax cuts alone added $2.6 trillion to the public debt over 2001-2010. (The other major drivers of this fiscal deterioration were the wars in Afghanistan and Iraq, which Daniels didn’t bother to pay for or even put on budget.) The 2001 recession certainly contributed to the emerging deficits—just as half of this year’s deficit can be chalked up to economic weakness—but the Bush administration’s economic policies ensured a mediocre economic recovery.

From Flickr Creative Commons by republicanconference
Though this supply-side snake oil was peddled as economic stimulus, the Bush-era tax cuts failed every test of good stimulus: They were gradually phased-in, they were targeted to upper-income households likely to save rather than spend, and they were intended to be permanent. Better economic policy could have alleviated the ensuing ‘jobless recovery.’
These tax cuts were the dominant economic policy during the worst economic expansion since World War II, measured by economic growth, employment, or compensation (trough-to-peak from 4Q2001 through 4Q2007). Real GDP growth averaged only 2.7 percent annually, the slowest of all the post-war expansions (averaging 4.8 percent economic growth annually). The economy only gained 97,000 jobs a month on average—not even enough to keep pace with population growth. (By contrast, job growth averaged 237,000 per month under President Clinton, when we had higher tax rates.) Real total employee compensation grew only 2.3 percent annually, contrasted with average annual compensation growth of 5.0 percent growth in post-war expansions.
Instead, the Bush tax cuts exacerbated inequality with a huge giveaway to those who didn’t need it: The top 1 percent of earners received 38 percent of the Bush tax cuts even though these households captured 65 percent of income gains during this expansion, leaving just scraps for the middle class. The Bush-era tax cuts can only be characterized as a costly economic policy failure.
Michael Linden of the Center for American Progress coined the phrase “deficit peacock” for self-purported deficit hawks interested in attention but uninterested in fiscal responsibility. Paraphrasing Linden’s birding guide, these deficit peacocks: 1) Never mention revenues; 2) Offer easy answers; 3) Support policies that make the long-term deficit problem worse; and 4) Think our budget woes appeared suddenly in January 2009. This summarizes Daniels to a tee. For him to lecture President Obama on fiscal responsibility is shameful.
Obama’s State of the Union speech sends the right signals
President Obama’s State of the Union address builds on his speech in Osawatomie, Kan. in December and that is a very good thing. That speech identified “whether this will be a country where working people can earn enough to raise a family, build a modest savings, own a home, and secure their retirement” as the key issue and argued against “you’re-on-your-own economics,” the economic perspective that says everyone should fend for themselves. We have increasingly followed such a vision over the last few decades and the results are clear, “fewer and fewer of the folks who contributed to the success of our economy actually benefitted from that success. Those at the very top grew wealthier from their incomes and investments than ever before.”
In contrast, the SOTU speech said, “We can either settle for a country where a shrinking number of people do really well, while a growing number of Americans barely get by. Or we can restore an economy where everyone gets a fair shot, everyone does their fair share, and everyone plays by the same set of rules.”
Obama pointed the way with a “blueprint for an economy that’s built to last – an economy built on American manufacturing, American energy, skills for American workers, and a renewal of American values.”
This is a much more encouraging policy vision than that offered by any of the president’s possible political opponents in the upcoming election; their policies are various versions of cutting taxes, especially on incomes obtained from wealth, redistributing the tax burden onto middle-class and low-income families and generating large permanent deficits. This is doubling down on the failed policies of the past.
Of course, whether Obama’s plan can lead to the desired results will depend on a political configuration that allows such policies to be legislated. It also depends on having a budget policy that actually delivers on the expanded public investments in innovation, education, infrastructure and manufacturing that are central to this strategy. That requires reversing the current course of budgets which imply major retrenchment of public investments over the next 10 years. The president’s establishment of the Buffett rule can help in this regard, especially since the SOTU clarified it as, “If you make more than $1 million a year, you should not pay less than 30 percent in taxes.” It would be stronger and more effective if we just taxed earned and unearned income at the same rate.
Last, as the president has noted at other moments, the typical working family has not benefited from productivity gains and economic growth over the last three decades. His pillars of growth (clean energy, infrastructure, innovation, education and skills) will strengthen productivity growth but do not directly address the need to reconnect pay and productivity growth. That requires low unemployment, a much higher minimum wage, better and actually enforced labor standards, and establishing in practice the ability of workers to conduct collective bargaining. It requires a trade policy (and exchange rate policies) that does not undercut our manufacturing sector. It requires the administration to stop its silly mantra of doubling exports and ignoring imports since the reality is that it is the ‘net’ of these two that affects growth and jobs. It requires building an economy where the financial sector is not dominant. And, that will require policies opposed by wealthy interests, a difficult trick in the age of Citizens United. That means we will need to weaken the impact of money in our democracy. There’s nothing easy about this path, but there is no alternative if we truly seek a democracy and an economy that work for everyone.
Apple execs (like everyone else) overlook global exchange rates
Charles Duhigg and Keith Bradsher have a justly buzzed-about article in the New York Times this week on how the production of the iPhone (and Apple products more generally) has become almost completely globalized. A quick but important addition to their story, though, is the role of exchange rates. Yes, I’m getting boring on this topic, but, exchange rates are by far the single most important determinant of U.S. trade performance, so if the question is “why isn’t X made in the US anymore,” it’s very likely that the answer remains “the dollar is overvalued.”
And, strikingly, even the Apple-specific timeline fits the data regarding the biggest exchange rate development – China’s mammoth intervention in international currency markets to keep their own currency from rising vis-à-vis the dollar. This is how Duhigg and Bradsher write it up:
“In its early days, Apple usually didn’t look beyond its own backyard for manufacturing solutions. A few years after Apple began building the Macintosh in 1983, for instance, Mr. Jobs bragged that it was “a machine that is made in America.” In 1990, while Mr. Jobs was running NeXT, which was eventually bought by Apple, the executive told a reporter that “I’m as proud of the factory as I am of the computer.” As late as 2002, top Apple executives occasionally drove two hours northeast of their headquarters to visit the company’s iMac plant in Elk Grove, Calif. But by 2004, Apple had largely turned to foreign manufacturing….”
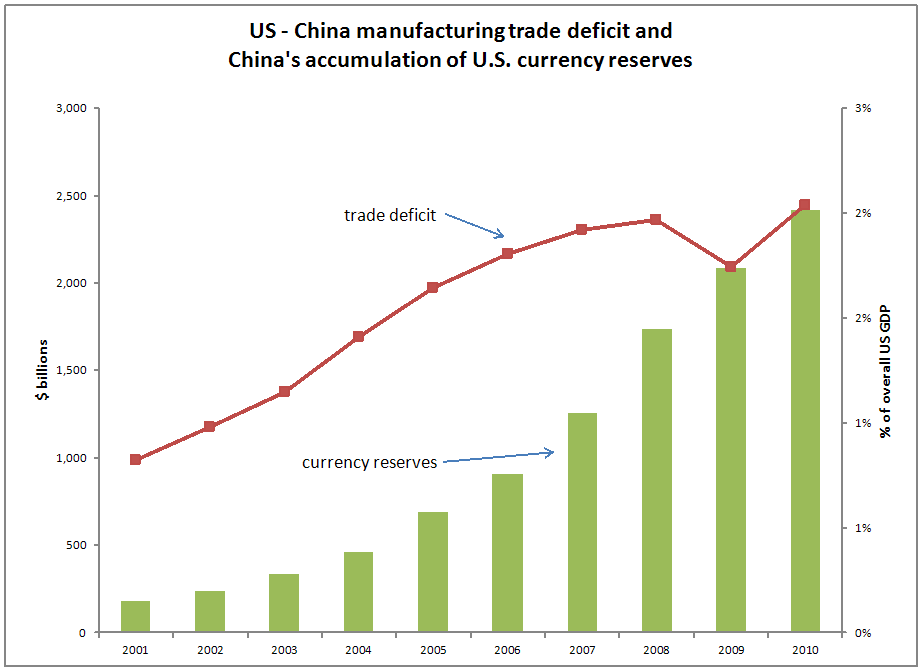
So, after 2002 Apple more and more turns to China for manufacturing? Huh. Not surprising – the graph below shows that the pace of Chinese accumulation of U.S. reserves (which leads inexorably to rising pressure on the dollar’s value, keeping Chinese products more competitive in U.S. and global markets) coincides with an accelerating increase in the U.S./China trade deficit around this time as well.
There is, after all, a reason why economists harp on the importance of the exchange rate – it drives lots and lots of hugely important economic decisions. As China intervenes to keep the value of its currency from rising against the dollar, this gives them an ever-increasing cost advantage versus the United States. The result is lots and lots of individual firm-level decisions (like Apple’s) to produce in China rather than the United States (because the exchange rate makes it cheaper) and the sum of these individual decisions cumulate to a huge aggregate trade deficit. The macro downsides of this trade deficit have been documented plenty of places, but if you’re writing about any feature of the US/China economic relationship and not mentioning this currency issue, you’re essentially writing Hamlet without the prince.
It’s frankly kind of amazing that Apple executives quoted in the article tell stories about how their global sourcing shifts are really about American skills, while managing to not mention global exchange rates. After all, there is an obvious trend in exchange rates and currency intervention that hamstring American competitiveness vis-à-vis China in the early-to-mid 2000s – but it’s awfully hard to make the case that American workers just got a lot dumber at the same time. But maybe blaming American workers can get some government subsidies for Apple to hire and train people in the U.S., while pointing out the effect of exchange rates might just lead to calls to rebalance the status quo U.S./China trade relationship – a status quo that has served Apple (and many other global manufacturers) very well.