Labor Department tackles guest worker problems
On Friday, Feb. 10, the Department of Labor (DOL) announced a new set of rules for the H-2B program, the country’s main temporary foreign labor program for less-skilled workers in non-agricultural positions. The new rules are set to become effective in late April, and as the New York Times reported on Saturday, “the changes were hailed by advocates for guest workers, who said they would make it more difficult for businesses to exploit vulnerable foreign migrants and hire them to undercut Americans.”
I join in the applause for the H-2B rule changes. For several years, the H-2B program has operated in ways that defy common sense. For example, in the District of Columbia, where more than 30,000 people were unemployed in 2010 and the unemployment rate hovered around 10 percent, common sense tells you that hotels should have an easy time finding local residents to take jobs as maids or cooks. And if they really couldn’t find anyone from D.C. to clean hotel rooms, surely they’d find qualified applicants in Northern Virginia or Maryland.
Yet lodging giant Marriott Hotels claimed they couldn’t find anyone here or elsewhere in the United States for 48 hotel maid and cook positions. They got government approval to bring 48 H-2B workers from abroad to do work that local people (with a high school education or less) could have been trained to do very quickly.
How did Marriott do it? How did they convince the DOL that no one in the D.C. area was interested in and qualified for these jobs? One possibility is that Marriott might have dishonestly claimed that they tried to recruit U.S. workers but failed. Under the old program rules, DOL didn’t have to check the accuracy of Marriott’s claims; DOL in all likelihood simply accepted Marriott’s “attestation,” i.e., simply took their word for it. Widespread fraud and abuse, documented by government and news reports and legal cases, are the main reason DOL has done away with the attestation procedure in its new rule.
More likely, Marriott fully complied with the minimal recruiting requirements mandated by the current rules, and few qualified local residents responded, because few ever heard there were positions open and because the wages offered were well below the prevailing wage in the D.C. area.
Marriott offered to pay the cooks $9.80 an hour. Here are the median, mean (or average), and annual wages paid to cooks in D.C. in 2010. Marriott’s wage offer was $3.80 an hour less than the average paid to the lowest paid of the hotel, cafeteria, or restaurant cook occupations in D.C.
 |
Marriott offered to pay the maids $8.50 an hour, even though the median wage for maids in D.C. was $14.58 and the mean was $14.44. Marriott’s offered wage was only 59 percent of the prevailing wage for maids in D.C. That might have been enough all by itself to discourage anyone in D.C. from applying for the jobs. It’s likely, however, that potential hotel maids in D.C. either didn’t see Marriott’s ad if it ran only for the required minimum of three days in some local paper, or if they did see it, it could have been months before the position was available and therefore job seekers ignored it.
|
If Marriott had been looking to employ cooks and maids in the broader, D.C.-Virginia-Maryland-West Virginia area, the prevailing wage would have been somewhat lower but still far above what the company actually offered.
|
It’s easy to see why employers like Marriott love the current H-2B program. They can legally pay temporary foreign workers less than the local market rate for essential jobs. Fixing this aspect of the H-2B program was the impetus for an earlier rule proposed by DOL, but that common sense rule was blocked by Congress after a lobbying firestorm. Employers claimed they’d go out of business if they were forced to pay the local average wage to maids and cooks (and especially landscapers), even though the employers they compete with are doing just that. But the fact that employers don’t have to document and prove their efforts to recruit U.S. workers—even at the below-average wages permitted by the H-2B program—exacerbates the problem and allows employers to ignore the employment needs of the local workforce where they do business, at the expense of the local workers’ ability to earn a living wage.
The new H-2B rules will help local workers find jobs at the prevailing wage for the work that they do. They will help put more unemployed Americans back to work, and also prevent the undercutting of employers who pay a living wage. Unfortunately, H-2B employers are already up in arms about these common sense reforms. Congress should not allow the desire of H-2B employers to lower American wages trump the need of unemployed workers to earn a decent wage.
Exports and growth: Running harder and falling behind
In his 2010 State of the Union address, President Obama pledged to double exports over the next five years, which would “support two million jobs.” How’s that working out? Not so well, despite claims to the contrary from the White House. In this year’s SOTU address, the president pointed to newly signed Free Trade Agreements (FTAs) with South Korea, Colombia and Panama as policies that will generate more exports, and they are, but the U.S trade deficit with those countries also increased last year. In short, it’s hard to argue that the Obama administration has taken any serious steps to make trade flows move from a minus to a plus in generating growth and employment in coming years.
Their rhetoric often suggests otherwise. Just last week, Deputy National Security Advisor for International Economic Affairs Michael Froman claimed that “last year our exports of goods alone to China exceeded $100 billion, and have been growing almost twice as fast as our exports to the rest of the world.” While this was a nice welcome for China’s Vice President Xi Jinping, who visits the White House today, it turns out that this nice round (and arbitrary number) was only reached if one is willing to overlook some key issues in trade data.
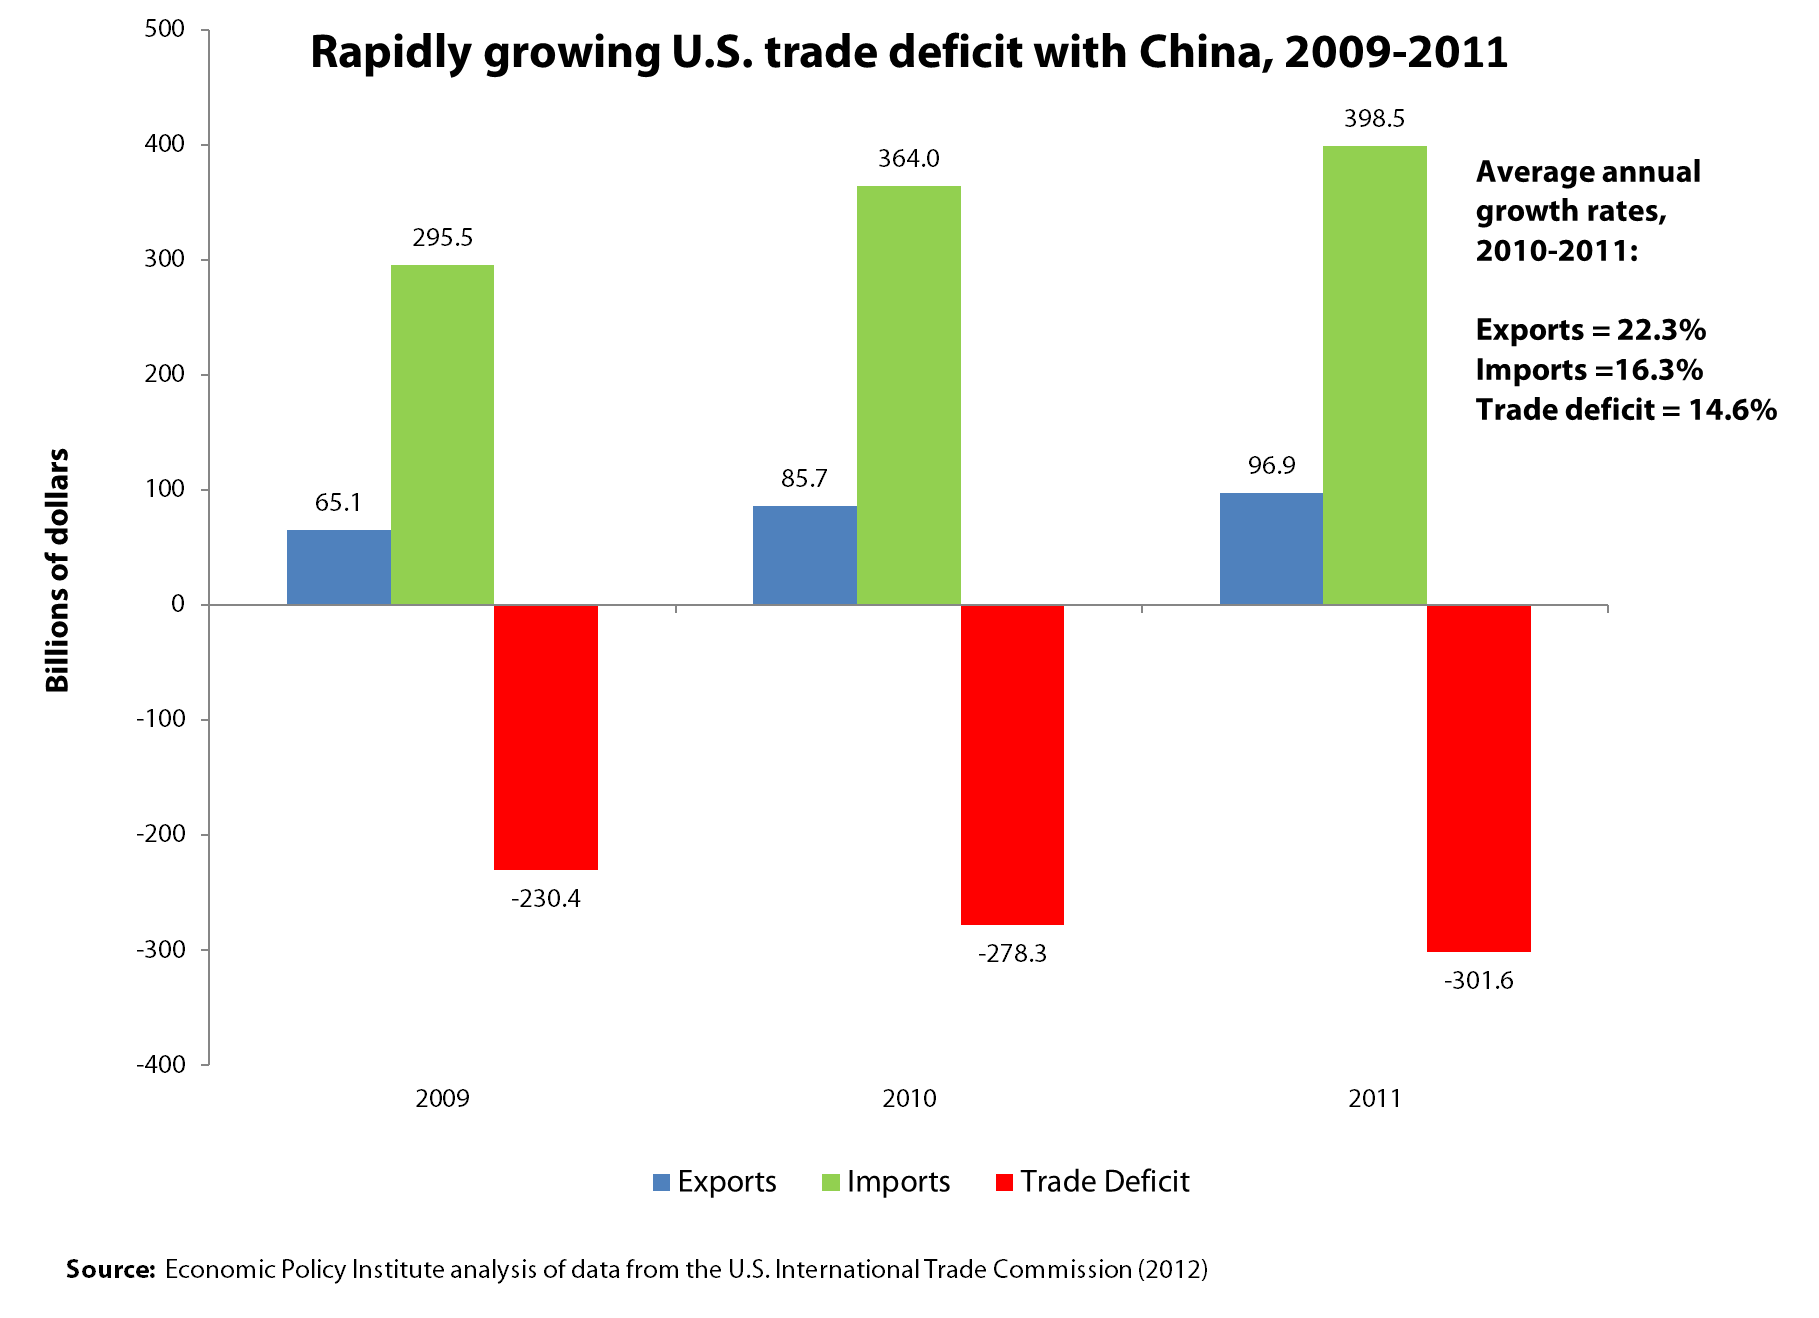
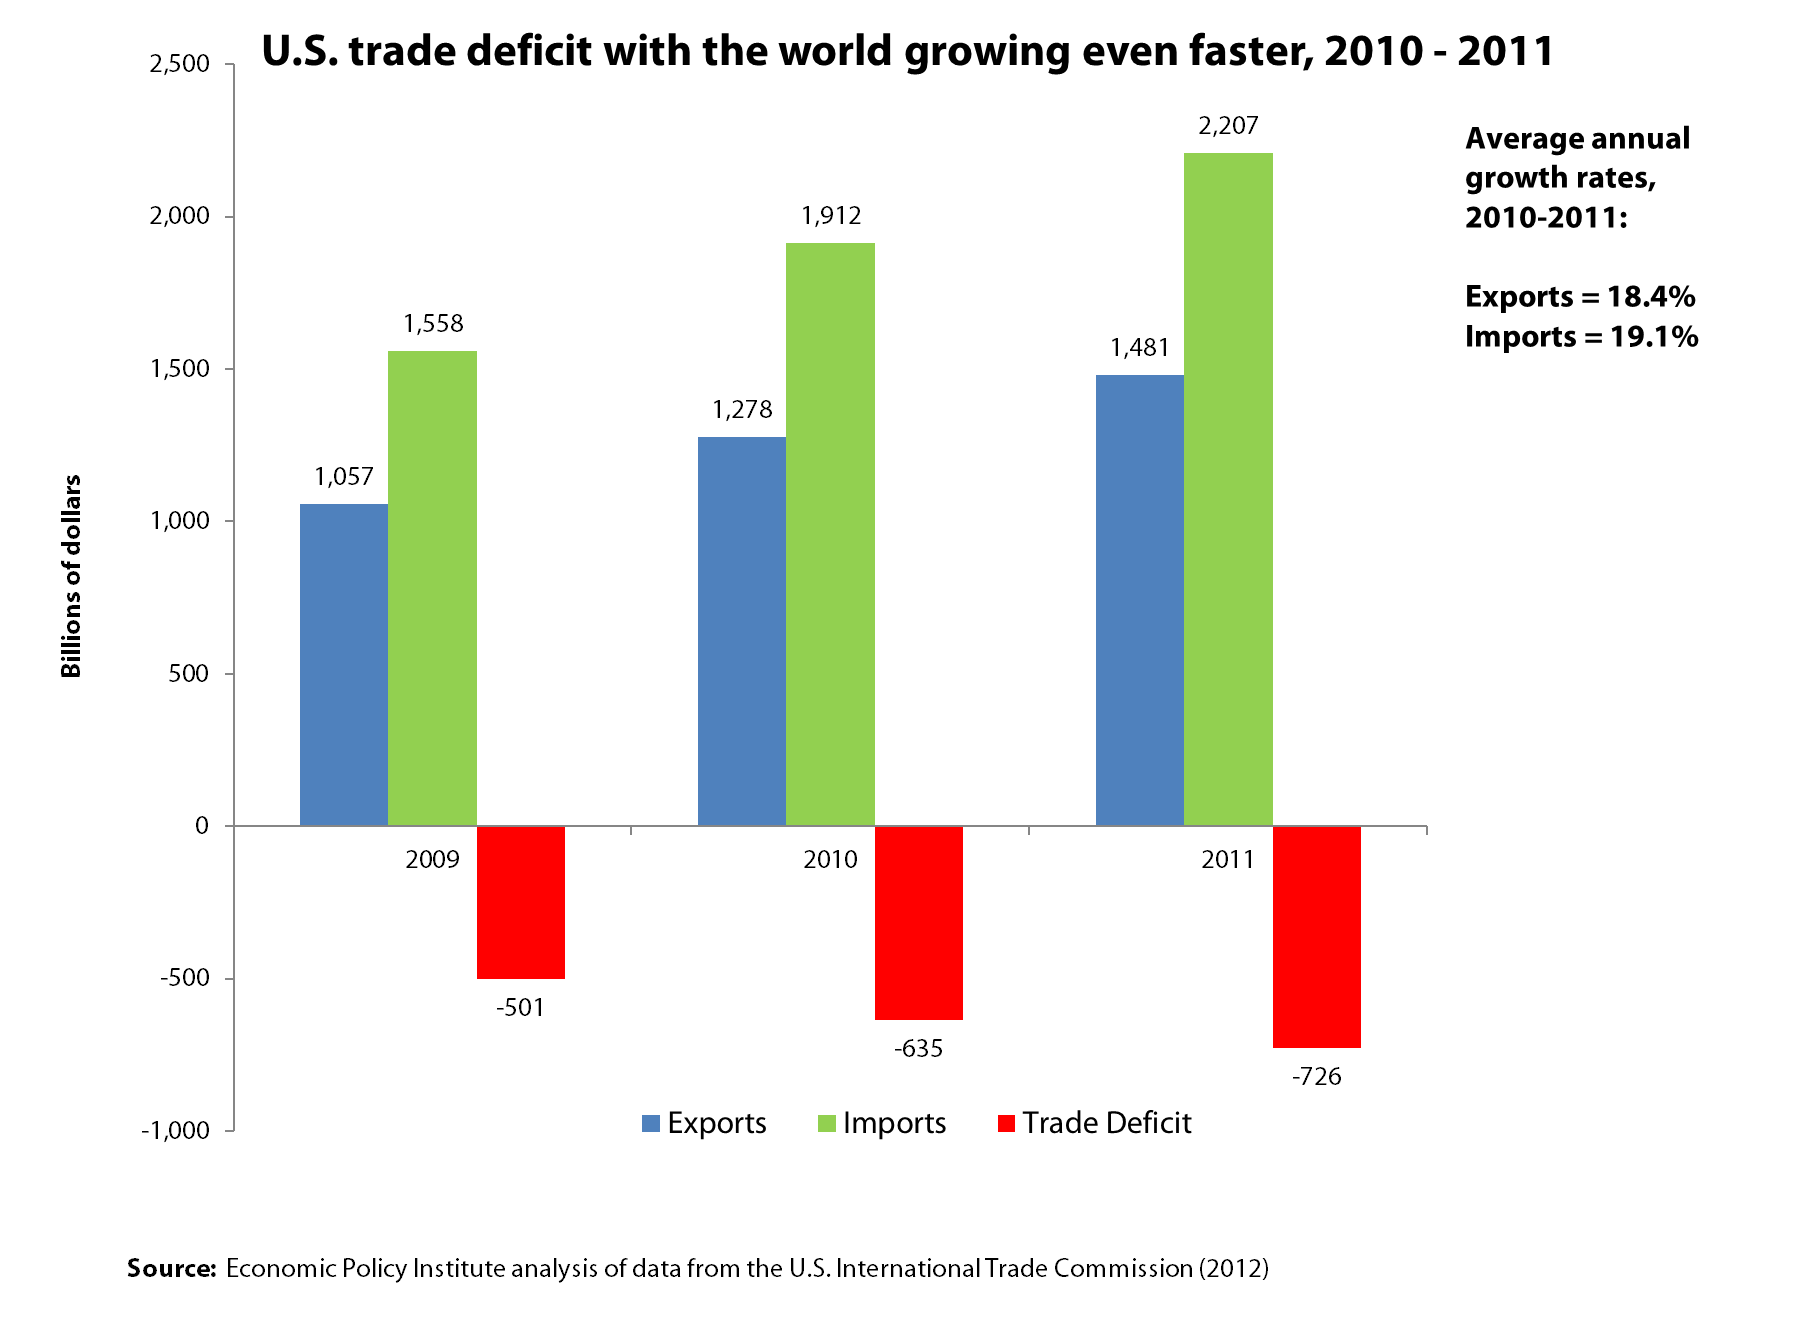
On the broader question of export growth, while exports to China and the world have been growing rapidly, the volume of U.S. imports increased much more rapidly – and this means that U.S. trade deficits with China and the world have increased rapidly over the past two years. This increasing trade deficit has generated a net loss in trade-related jobs with both China and the world as a whole. Thus, while export growth may have supported some new U.S. jobs, the growth in imports has displaced a much larger number of jobs. Between 2008 and 2010, the growth of U.S. trade deficits with China alone resulted in the loss of 453,100 U.S. jobs. A thorough jobs analysis of U.S. trade in the 2009-2011 period has not yet been completed. However, the U.S. trade deficit in non-oil manufactured goods, the most labor intensive portion of U.S. goods trade, increased by $129.3 billion in this period, displacing hundreds of thousands of U.S. manufacturing jobs.
Exports to China increase at a relatively brisk pace of 22.3 percent on average over the past two years (since President Obama’s announced goal of doubling exports), as shown in the figure below. While this number sounds great in isolation, it was more than offset by the growth of imports from China, as shown in the figure; and U.S. trade deficits with China have soared.¹ So, even though exports to China are growing rapidly, the base (their initial level) is tiny compared with imports, which exceeded exports by more than 4-to-1 throughout this period. Therefore, in order to merely stabilize our trade deficit with China, exports would have to grow at least four times as fast as imports. In fact, imports from China grew nearly as fast as our exports to that country, and our bilateral deficit has increased 14.6 percent per year on average over the past two years.
U.S. exports to the world have increased at a slightly slower rate of 18.4 percent per year over the past two years. Although this is slightly lower than the rate of growth of exports to China, at this rate, exports will double between 2009 and 2013, one year ahead of the goal set by President Obama. Time for a celebration and a tour of all those shiny new factories shipping exports to China, right? Not if we care about jobs. If imports and exports continue to grow at present rates, the U.S. global trade deficit will more than double by 2013 to more than $1 trillion. Millions more jobs will be lost, most of them in manufacturing. Again, the story is simple: Trade flows have two sides, imports and exports. Counting only one side tells you nothing about how policy has aided or hindered U.S. competitiveness in the global economy.
Readers will note that exports to China have grown only slightly faster than exports to the world over the past two years.Read more
Don’t cut the non-security discretionary budget!
One of the most overlooked items of the federal budget is the non-security discretionary budget. Despite accounting for only about 15 percent of federal expenditure, it includes some pretty important government functions. Half of the non-security discretionary budget accounts for the entirety of the federal government’s role in economic development, consumer protection, public safety, environmental protection, as well as portions of the safety net. The other half is made up of vital public investments in infrastructure, education, and research and development, which are necessary to keep the economy strong and globally competitive for decades to come. In fact, the non-security discretionary budget is practically the sole provider of these investments, with few existing elsewhere in the budget.
We’ve given good marks to President Obama’s 2013 budget for its upfront job creation proposals, efforts to promote tax fairness, and for realistically stabilizing the debt-to-GDP ratio over the second half of the decade (as the output gap shrinks). But unfortunately, his budget proposal achieves much of its savings by maintaining the non-security discretionary cuts in the first phase of the Budget Control Act, the debt ceiling deal that established 10-year caps on discretionary spending. As a result, his budget forces non-security discretionary outlays down to their lowest level as a share of GDP ever recorded (the data begins at 1962). That’s even lower than the Bowles-Simpson proposal!
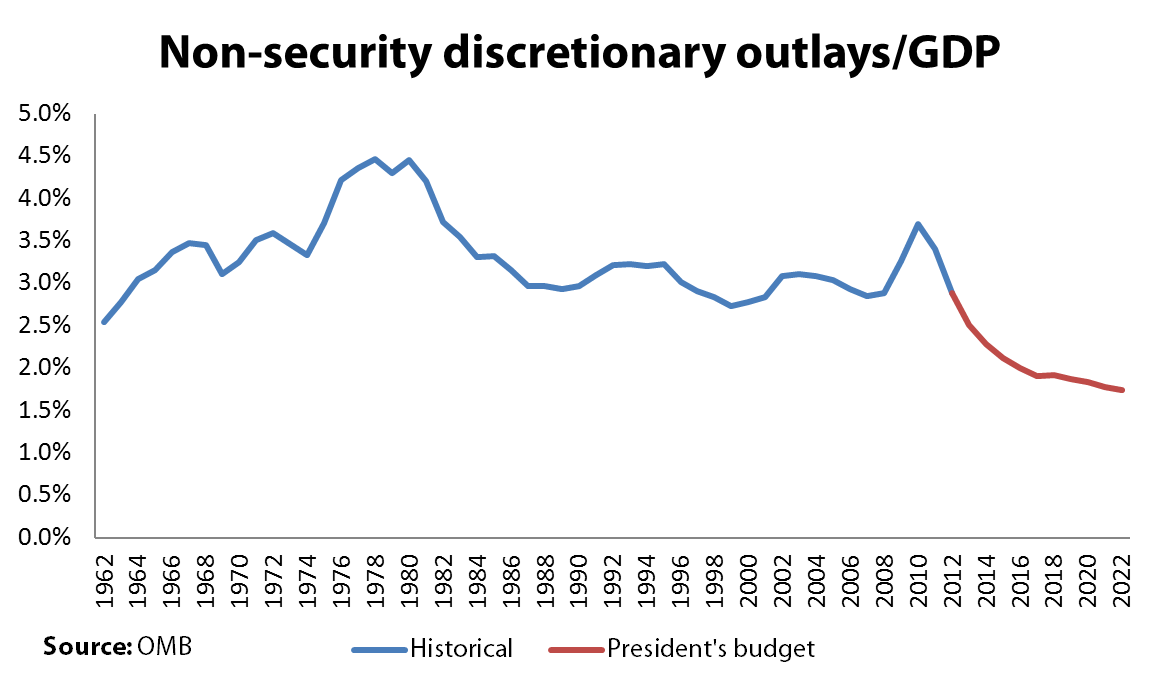
The president has admirably made public investments a high priority, promoting increases in transportation, school facility repair and modernization, job training, R&D, and college access. But this vision is hard to reconcile with a rapidly shrinking non-security discretionary budget, as it will lead to even steeper reductions to everything else, with disastrous consequences.
Working spouses cause inequality? Can this emerging zombie lie be killed?
A major new zombie lie is being launched: The claim that high inequality is due to more working spouses in high-income households and well-off people increasingly marrying other well-off people. This was part of James Q. Wilson’s recent op-ed in the Washington Post, which I addressed in an earlier blog post (though not on this point). My zombie lie detector went wild, however, after reading a very good New York Times article detailing new research showing “the [education] achievement gap between rich and poor children is widening, a development that threatens to dilute education’s leveling effects.” At the end of the article are two statements by conservative public intellectuals, one from Douglas Besharov and one from Charles Murray, attributing income inequality to working spouses.
To recall, here’s what Wilson wrote: “Affluent people, compared with poor ones, tend to have greater education and spouses who work full time.” Wilson then suggests that if these are the drivers of inequality, then it is best not to do anything about the problem, since, in his words, “We could reduce income inequality by trying to curtail the financial returns of education and the number of women in the workforce—but who would want to do that?”
Here’s what the Times‘ Sabrina Tavernise attributed to Murray in her piece:
The growing gap between the better educated and the less educated, he [Murray] argued, has formed a kind of cultural divide that has its roots in natural social forces, like the tendency of educated people to marry other educated people, as well as in the social policies of the 1960s, like welfare and other government programs, which he [Murray] contended provided incentives for staying single.”
And here’s what Besharov told Tavernise:
There are no easy answers, in part because the problem is so complex… . Blaming the problem on the richest of the rich ignores an equally important driver, he [Besharov] said: two-earner household wealth, which has lifted the upper middle class ever further from less educated Americans, who tend to be single parents. The problem is a puzzle, he [Besharov] said. “No one has the slightest idea what will work. The cupboard is bare.”
The basic claim, it seems, is that well-off families are more likely to have working spouses and that the spouses in well-off families are both more likely to have high earnings. Presumably this phenomenon has been growing, or else it cannot explain growing inequality. I address the issue of the role of the growth of two-earner households and inequality in this post but do not address the issue of assortative mating (rich marrying rich). Also, my focus is whether the “working spouses factor” contributes at all to our understanding of the key dynamic of income inequality, the growing income gap between the top 1 percent and the middle class.
To these folks demographic, rather than economic, trends are generating income inequality. Consequently, economic policy has had no role in causing inequality and can not ameliorate inequality either. Of course, this is only the latest effort to reduce inequality to a demographic phenomenon: The State of Working America has addressed other such claims going back to the first edition in 1988.
To explain inequality is to explain first and foremost the tremendous growth of income, wages and wealth that have accrued to the top 1 percent and the top 0.1 percent since 1979. How does the “working spouse” explanation hold up?
The first thing to note is that the presence of a working spouse, even a highly paid one, can potentially impact household income inequality but says nothing about the tremendous divergence of individual wages over the last few decades. Household incomes aggregate the labor income of all household members (which depends on how many members work, how much they work and how much they are paid), non-labor income (capital gains and so on) and any pensions, government transfers and other income. As we know, the top 1 percent of households managed to more than double its share of national income between 1979 and 2007. Josh Bivens and I have argued that the dynamics underlying growing household income inequality are rising wage inequality, rising inequality in receipt of capital income (capital gains, dividends and so on) and the shift toward more capital income and less wage income. The demographic factor of working spouses is about how people combine into households and does not address and certainly cannot explain the huge increase in the wage growth of the top 1 percent of wage earners versus every other group. Here is the chart on wage growth showing the top 1 percent gaining 131 percent between 1979 and 2010 while those in the bottom 90 percent saw their annual wages rise by 15 percent (mostly in the late 1990s).

Second, we can look directly at the two–earner phenomenon among the upper 1 percent and the top 0.1 percent from the work of Jon Bakija, Adam Cole and Bradley T. Heim who analyzed tax returns from 1979 to 2005.Read more
David Brooks’ bad example
Update (4:10 p.m. ET): Here’s some data (from EPI analysis of the Current Population Survey) on the share of those employed lacking a high school diploma or a GED certificate, labeled “less than high school,” by race/ethnicity and immigration status:
Share of employment with ‘less than high school’ education, 2011 |
|||
|
Race/ethnicity |
All | Native | Immigrant |
| All | 8.4% | 5.1% | 25.9% |
| White* | 4.2% | 4.1% | 6.0% |
| Black* | 7.2% | 6.7% | 10.6% |
| Hispanic | 28.6% | 11.6% | 44.3% |
| * Excluding Hispanics | |||
Note that just 4.1 percent of the native born white workforce is in this category. Only 5.1 percent of employment of all native-born Americans lacks a high school degree or a GED, with a slightly higher share among employed native-born blacks (6.7 percent).
Original post: I was struck by David Brooks’ example of bad behavior in his New York Times column today, writing, “I don’t care how many factory jobs have been lost, it still doesn’t make sense to drop out of high school.” Paul Krugman was struck by that same sentence. Brooks’ assumption, I guess, is that many workers have low wages because they never completed high school. He’s not alone in thinking that there are a lot of high school dropouts, but this is definitely not true. As the graph shows, the share of the workforce (ages 18-64) who have neither a high school or further degree (including a GED) has dropped tremendously in the last four decades, from 28.5 percent in 1973 to just 8.4 percent in 2011, a trend true among men as well as women. Oh, by the way, half of the “high school dropouts” in the workforce are immigrants, many of whom did not go to school in the United States and came here in their teens or later. You definitely can’t blame the erosion of workers’ wages on their failure to graduate from high school, since the vast majority did.

In fact, the education levels of our workforce have grown tremendously. As another example, the share of the workforce with a college degree or further education has doubled since 1973, growing from 14.6 percent in 1973 to one-third in 2011. And, by the way, the wages of those with a college degree (but no further education) have not increased in inflation-adjusted terms in 10 years, neither in the last recovery between 2002 and 2007 nor since. I wonder what bad behavior on their part caused this to happen.
A budget for adults (especially those who’d like a job)
President Obama’s FY2013 budget request, released today, is bound to get ample criticism from the right (and center-right) for not going far enough on near-term deficit reduction. As a few different articles have already highlighted today (for instance here and here), the president’s budget request does not honor a pledge he made to halve the deficit by the end of his first term. In reality, we’d all be in pretty big trouble if this budget chose to focus on promises as opposed to economic realities. Instead, the budget put forth by the administration today is a remarkably serious one – particularly given that Obama is running for reelection this year. The administration could have relied on gimmicks and austerity measures to focus solely on deficit reduction; instead we got a document that both emphasizes job creation and manages to hit fairly reasonable fiscal targets in the medium term.
The budget includes about $350 billion in temporary tax relief and investments to create jobs and jump-start growth. These investments are heavily front-loaded between FY2012-FY2014 – in fact, 96 percent of the proposed spending on these measures takes place in those years. Much of this investment in job creation is familiar, including policies such as:
- $94 billion for an extension of the payroll tax holiday for two years
- $44 billion for reforming and extending unemployment insurance for two years
- $30 billion to modernize schools over four years
- $30 billion for teacher stabilization and supporting first responders
- $50 billion to fund surface transportation priorities through 2022, with the investment front-loaded in the first three years
As we’ve stated before, this job creation package should be evaluated based on its scale, the difference it will make in the coming few years, its effectiveness and efficiency, and the way in which it is funded. The $350 billion figure is a decent amount to be spending on job creation, an amount that would raise employment levels significantly in 2012 and 2013. That is more than we can expect to see Rep. Paul Ryan (R-Wisc.) propose in this year’s House Budget resolution. But with an 11 million jobs deficit, it still falls short of what’s needed.
Though not perfect, the investments highlighted in the budget are fairly well-targeted. Macroeconomic multipliers show that across-the-board, spending on public investments, income-support payments, state-and-local fiscal support, food stamps, infrastructure projects, unemployment insurance, and targeted refundable tax credits garner a much larger bang-per-buck than spending on various tax cuts and credits. And since our economic problems generally still stem from a lack of demand, it makes sense that boosting the ability of consumers to spend should be a top priority for the administration.
The president’s budget “funds” this investment by proposing a greater level of taxation on those who can most afford to pay – rhetoric we have been hearing from Obama for a while now. This includes around $1.5 trillion over 10 years from upper-income tax provisions, which include, among other things, letting the George W. Bush-era tax cuts expire and taxing qualified dividends as ordinary income for those making above $250,000 per year ($200,000 single filers).
Along with addressing the jobs crisis, this budget also puts the federal government on a sustainable fiscal path. The president’s budget achieves primary balance in 2018, meaning that, excluding interest payments, spending does not exceed revenues. Primary balance is a good measure for two reasons. First, interest payments are essentially payments on past—rather than current—policy decisions, so primary balance allows us to use a measure that doesn’t punish current presidents for debt that may have been incurred by past presidents. Second, primary balance also results in a stabilized debt as a share of GDP, and this budget stabilizes debt at 76.5 percent in 2022 after peaking at 78.4 percent of GDP in 2014 and gradually coming down. And while the budget does propose around $4 trillion in deficit reduction over 10 years, around $850 billion of these savings comes from capping Overseas Contingency Operations, and a good deal more comes from pursuing high-income tax cuts and other revenue proposals. Additionally, the president proposes achieving around $600 billion of that deficit reduction through health and other mandatory initiatives, almost half of which would come from Medicare providers.
As we said in a statement earlier today, this budget is not perfect and particularly disappoints when it comes to non-defense discretionary spending levels. Despite this reality, this budget does a pretty good job of investing in job growth while at the same time promoting greater fairness and responsibility.
President Obama’s FY 2013 budget: The Buffett Rule and progressive tax reform
The tax policies in President Obama’s budget request for fiscal year 2013 more closely resemble those proposed for the Joint Select Committee on Deficit Reduction (i.e., the Super Committee) last September than those included in last year’s budget request. Consequently, this year’s budget raises more revenue (ostensibly to finance job creation) and does more to restore tax progressivity than previous budgets. Like the administration’s Super Committee proposals, the president’s 2013 budget proposes comprehensive tax reform, which would aim to raise $1.5 trillion over a decade, relative to current policies, from businesses and households making over $200,000 ($250,000 for joint filers).
In his recommendations to the Super Committee, President Obama proposed that tax reform should be guided by the Buffett Rule – that “no household making over $1 million annually should pay a lower share of its income in taxes than middle-class families pay.” The 2013 budget adopts a more clearly defined Buffett Rule from the president’s State of the Union address, which stated: “If you make more than $1 million a year, you should not pay less than 30 percent in taxes.” In a progressive tax code, effective tax rates are intended to rise with income, but tax code loopholes—overwhelmingly the preferential treatment of capital income over labor income—allow some millionaires and billionaires to pay lower tax rates than middle-class households. While short on details, the president’s 2013 budget suggests that the Buffett Rule would be implemented as a new minimum tax for millionaires, replacing the existing alternative minimum tax (which falls predominantly on upper-middle-class households). The budget also suggests that the Buffett Rule would give some deference to millionaires’ charitable contributions, but would nonetheless likely ensure that tax rates rise with ability to pay.
A recent Congressional Research Service report noted: “Tax reforms that are consistent with the Buffett rule would likely include raising tax rates on capital gains and dividends.” The president’s 2013 budget moves further in this direction than his previous budget requests. The 2013 budget again proposed ending the carried interest loophole and restoring the top rate on capital gains to 20 percent, but this budget also proposes taxing upper-income households’ qualified dividends as ordinary income (instead of a preferential 20 percent rate, as previously proposed). Again equalizing the tax treatment of income derived from work and that derived from investments should be at the core of progressive tax reform. This focus reflects income and inequality trends and raises revenue from those households best able to contribute to deficit reduction (the same households that disproportionately benefit from the last decade’s regressive, deficit-financed tax cuts).
To steer Congress toward tax reform, the president’s budget identifies revenue increases of $1.9 trillion, almost $1.6 trillion of which would come from sunsetting the upper-income George W. Bush-era tax cuts, capping the rate at which tax preferences reduce tax liability for upper-income households, and reinstating the estate tax at 2009 parameters, again all relative to current policy. The remaining tax proposals include closing business tax loopholes, ending fossil fuel preferences, and reforming the international tax code, which look quite familiar. (See For Joint Select Committee, many good options: Progressive revenue proposals would narrow budget gap by trillions for an analysis of the president’s tax proposals for the Super Committee.) Relative to current policies, the tax proposals in the 2013 budget would increase revenue as a share of GDP by 1.5 percentage points over the next decade – nowhere close to restoring revenue adequacy, but nonetheless an improvement over last year’s proposed 1.3 percentage point revenue increase.
Critically, the president’s tax proposals for 2013 appear to raise more revenue than those in his previous budget requests in order to finance a slew of job creation proposals closely resembling the American Jobs Act (which the president proposed financing with many of the progressive tax reforms in this budget, including caps on a wider range of tax preferences for upper-income households). The emphasis on near-term fiscal support gradually financed by tax increases on upper-income households—which will have a relatively small adverse impact on economic activity, unlike spending cuts—is good economic and fiscal policy. Federal tax and budget policy should accommodate bigger deficits today and reduce deficits as the output gap shrinks. The president’s tax policy proposals move in the right direction on this front, but they would also help to restore fairness to the tax code and begin to temper Gilded Age-levels of income inequality.
China responsible for bulk of the U.S. trade deficit in non-oil manufactured goods
The U.S. Census Bureau recently reported that the U.S. goods trade deficit increased from $645.9 billion to $737.1 billion in 2011 (an increase of $91.2 billion, or 14.1 percent). Crude and refined petroleum products were responsible for $61.3 billion, or 67.2 percent of the increase in the total goods trade deficit, as reported by the Census Bureau. The U.S. trade deficit in non-oil manufactured goods increased by $48.9 billion, or more than the residual.¹ The U.S. has a small, growing trade surplus in agricultural goods which increased from $36.2 billion in 2010 to $43.1 billion in 2011. We are, in effect, trading energy and capital intensive cash grains and other farm products for labor intensive manufactured goods.
The U.S. has a large and rapidly growing trade deficit in non-oil manufactured goods, as shown in the figure below. This deficit reached a peak of $515 billion in 2006 (shown on the right axis), improved slightly in 2007 and then collapsed during the recession in 2008 and 2009 as employment, consumer incomes and demand for manufactured goods—especially durable products like automobiles—fell sharply. As a result, imports and the non-oil manufacturing trade deficit also declined in the same period.
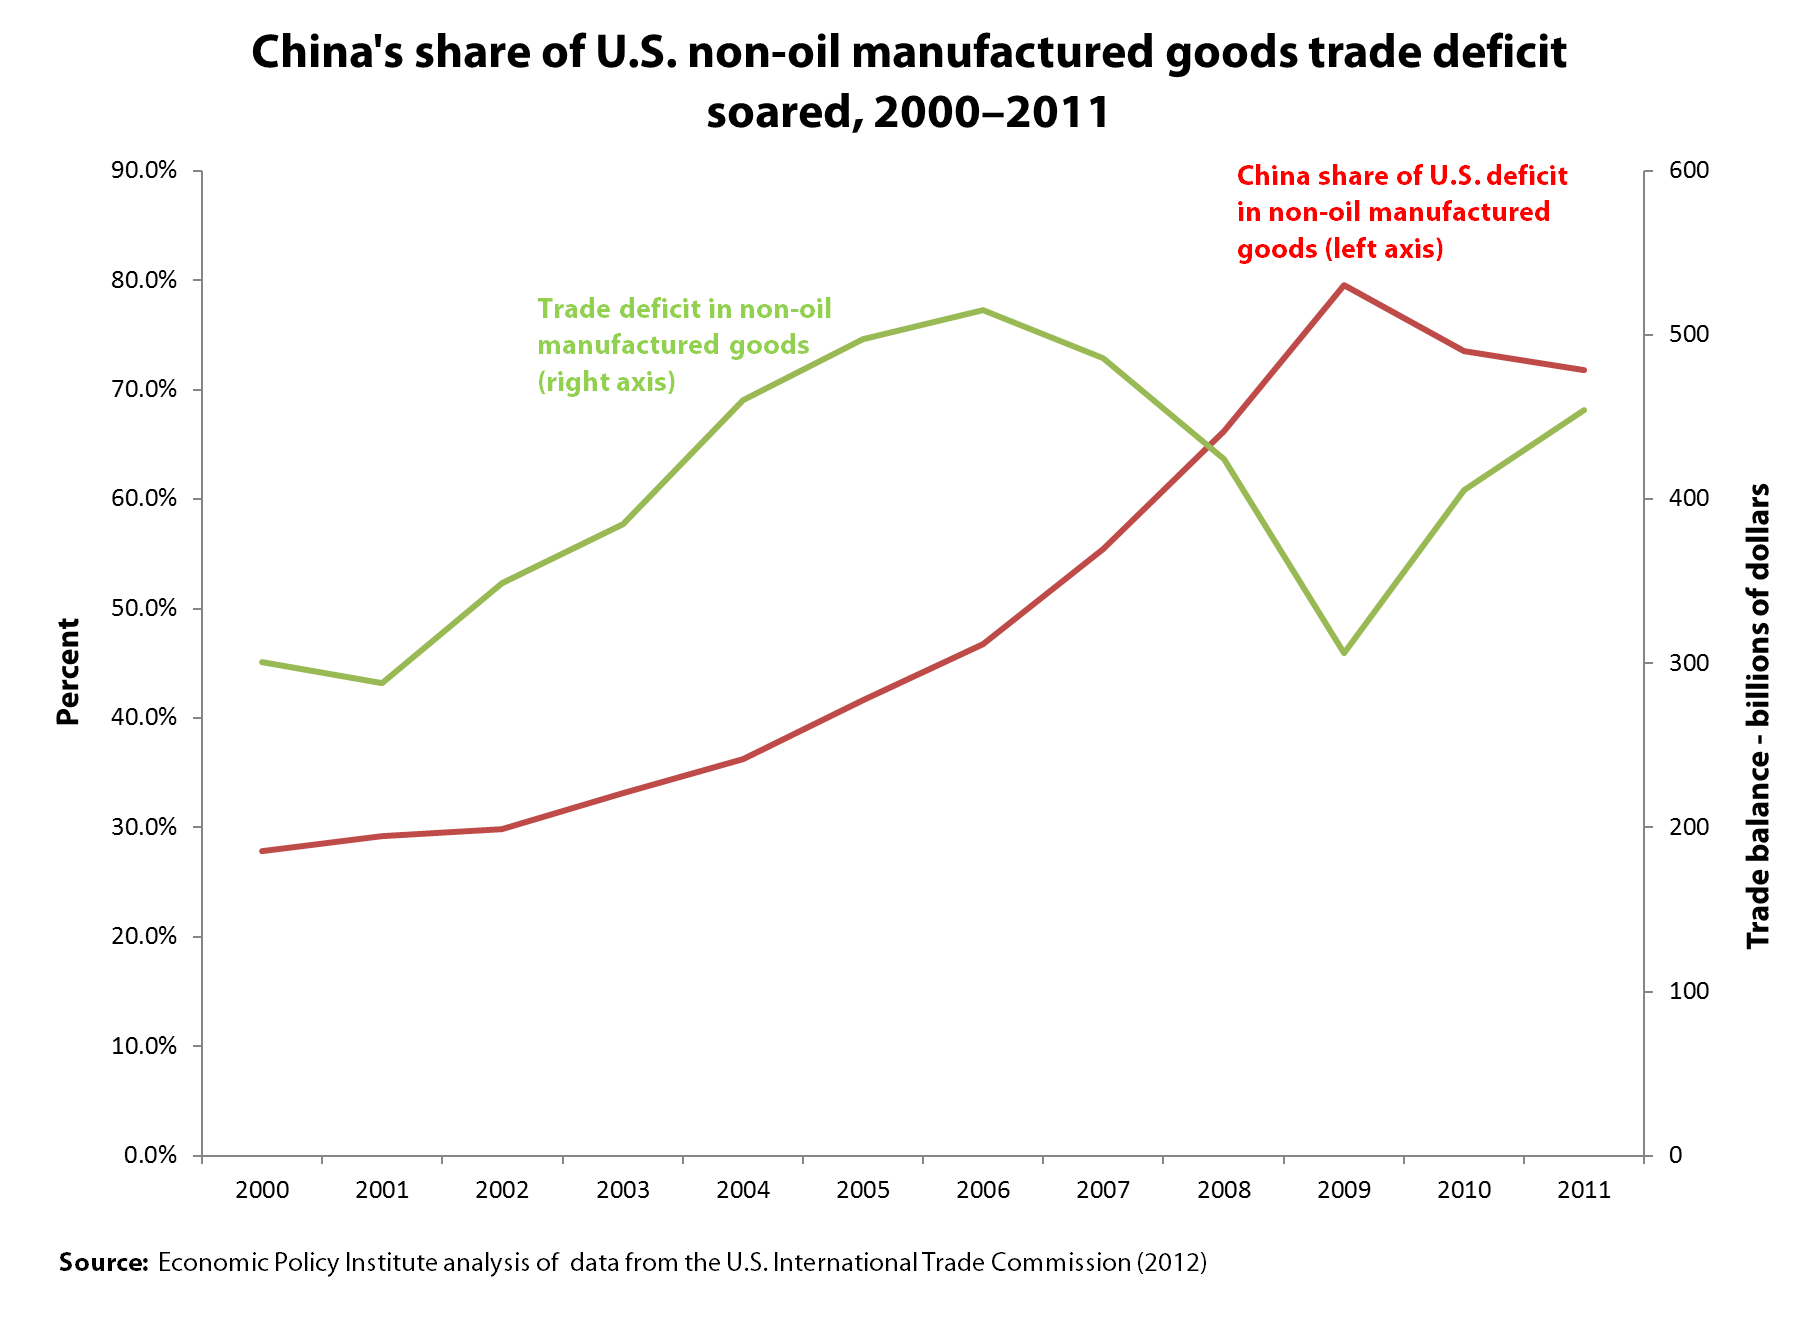
The U.S. trade deficit in non-oil manufactured goods has been growing rapidly since 2009, as shown in the figure, which has contributed to the slow growth of manufacturing employment since the Great Recession. The U.S. lost 2.3 million manufacturing jobs between Dec. 2007 and the employment trough in Jan. 2010. Only 354,000 manufacturing jobs were added through Dec. 2011, an increase of 3.1 percent (BLS 2012). Manufacturing output, on the other hand, which reached its nadir earlier, in June 2009, has recovered much more strongly, up 16.0 percent since the trough. The difference is due, in part, to the rapid growth of the manufacturing trade deficit shown in the figure.
Throughout this period, imports of manufactured goods from China have continued to grow rapidly. Their share of the U.S. non-oil trade deficit in manufactured goods trade deficit rose steadily and more than tripled between 2000 and 2009 as shown on the red line in the figure (measured on the left axis). The U.S. trade deficit with China in these products increased in every year between 2000 and 2008. They fell only briefly in 2009, and hit new, record levels each year in 2010 and 2011, peaking at $326.1 billion in 2011. The U.S. trade deficit with China in non-oil manufactured products exceeded the overall bilateral deficit because the United States had a small trade surplus with China in raw agricultural products.²
Although China’s share of the manufacturing trade deficit has declined slightly in the past two years, as shown in the figure, China and five other Asian trading partners have been responsible for 80 percent or more of the U.S. trade deficit in non-oil manufactured products for the past three years. These trading partners are South Korea, Hong Kong, Taiwan, Indonesia and Malaysia. These countries have been forced to manipulate their currencies and compete with China on unfair trade practices to avoid loss of market share and falling behind.
Each of these countries has engaged in substantial currency manipulation and four of the six (China, Hong Kong, Taiwan, and Malaysia) have been identified as maintaining heavily undervalued currencies, relative to the dollar. The share of these six countries in the U.S. manufacturing trade deficits ranged from 92.4 percent in 2009 to 81.0 percent in 2011.
What China has in common with most, if not all, of its Asian trading partners are a set of illegal trade practices including currency manipulation and subsidies and other markets barriers. As noted by the Alliance for American Manufacturing’s Scott Paul, China’s unfair trade policies “are now the single largest impediment to job growth in America.” It is time for the United States to get tough with China and other unfair traders and put an end to these policies. The first and most important step is to get tough with currency manipulators.
¹Detailed data on product and industry trade by country in this post were all based on EPI analysis of data from the U.S. International Trade Commission (2012).
²Note, however, that China has sustained a small trade surplus in processed food and beverage products with the United States for the past four years; this surplus was $386 million in 2011 (U.S. International Trade Commission 2012).
References
U.S. International Trade Commission (U.S.I.T.C.). 2012. USITC Interactive Tariff and Trade DataWeb. Washington, D.C.: U.S.I.T.C. Available at: http://dataweb.usitc.gov/scripts/user_set.asp (registration required). Accessed December 9, 2012.
No, NYT, there’s been no expansion of government benefits, no ‘entitlement society’
There was a very interesting story on the front page of the Sunday New York Times, “Even Critics of Safety Net Increasingly Depend on It,” detailing a range of views of people who have an anti-government political orientation yet depend heavily on government supports.
I want to strongly object to one part of the story that seems to support the notion that we’re becoming an “entitlement society.” The story claims that there’s been a major “expansion of government benefits,” which it says “has become an issue in the presidential campaign.” The Center for Economic and Policy Research’s Dean Baker sees some of the same problems.
Many of the facts presented in the story do not support that conclusion and the ones that do seem to support it are misleading. Here’s the key portion:
In 2000, federal and state governments spent about 37 cents on the safety net from every dollar they collected in revenue, according to a New York Times analysis. A decade later, after one Medicare expansion, two recessions and three rounds of tax cuts, spending on the safety net consumed nearly 66 cents of every dollar of revenue.
The recent recession increased dependence on government, and stronger economic growth would reduce demand for programs like unemployment benefits. But the long-term trend is clear. Over the next 25 years, as the population ages and medical costs climb, the budget office projects that benefits programs will grow faster than any other part of government, driving the federal debt to dangerous heights.
There are two things problematic with the comparison between 2000 and 2010. One is that the denominator is revenue when it should be expenditures since revenue has eroded because of tax cuts (acknowledged in the article) and because revenues fall in a recession (2000 had 4.0 percent unemployment, 2010 had 9.6 percent) since the fall in economic activity and income reduces revenue. Revenue as a share of GDP hit a 60-year low in 2010. Here’s what you find when you look at federal budget data: Entitlements (i.e., mandatory spending) as a share of federal expenditures were the same 53 percent of total outlays in 2007 as they were in 2000, so there was no trend towards expansion, at least before the recession hit. The mandatory share rose to 55 percent in fiscal year 2010 and 56 percent in 2011, a small increase.
The second problem is that the article suggests it is describing a situation of expanded benefits when, in actuality, the 2010 endpoint largely reflects that response of existing programs to the recession – more people do get unemployment insurance, Medicaid, food stamps and so on but once unemployment returns to low levels the expanded benefit rolls will retreat. (The American Reinvestment and Recovery Act and subsequent legislation also temporarily expanded the earned income tax credit, child tax credit, unemployment insurance, and food stamp benefits, among other programs – all cost effective fiscal stimulus and prudent economic policies but unlikely to be continued indefinitely.) It is easy to see that the bump up between 2007 and 2010 or 2011 was due to the greater income supports that are generated in a recession; if you take out the “income security” portion of mandatory outlays, which includes unemployment insurance and food stamps, then the mandatory share of outlays was roughly the same 45 percent of outlays in 2011 as its 46 percent share in 2000.
So, there’s no evidence to show we’re becoming an “entitlement society,” just that we’re low on revenues and the economy remains depressed. The citation of the safety net going from 37 percent to 66 percent (of revenues) has nothing to do with permanently expanding program eligibility or higher benefits, but much to do with cyclical factors and revenue erosion.
What about the future path of entitlement spending? Well, the article itself notes that the rise is due primarily to rising medical costs and an older population (i.e., more old people). This is an old story and given that the bulk of the increase is the fast-rising cost of medical services, the answer needs to be controlling the growth of health care costs. It is also the case that these rising health care costs will be a major burden to private-sector employers, so we are not facing a government problem but a national economic challenge. If we were to limit federal health expenditures, a la House Budget Committee Chairman Paul Ryan (R-Wisc.), then the burden of this problem would fall on the elderly, their families, state and local governments, and private-sector employers. This doesn’t solve the problem, it just shifts the costs, likely exacerbating national health care expenditure in the process.
More lessons from testifying: Must explain that one person’s income is another’s cost
I’ve written one blog post already about my testimony this week on the EPA’s new standards for power plants and about how repeating near-universally held views about the economy flummoxed many of the subcommittee members to whom I was testifying.
Here’s another one that puzzled them: my claim that “one person’s income is another’s cost.” This one really buffaloed Rep. Mike Pompeo (R-Kan.), who seemed to think it was an idiosyncratic belief taught only where I went to graduate school.
The context is that I noted that the EPA’s new standards (sometimes referred to as the “toxics rule”) would create some jobs because firms would have to install and purchase pollution abatement and control equipment (scrubbers for smokestacks, for example). I noted that the need to undertake this pollution abatement investment was a cost from the perspective of the power plants, but would end up as income in the hands of workers doing the building and installation of the equipment and owners of firms in the pollution abatement sector.
Pompeo went on a strange tear about setting money on fire (yeah, I didn’t really get it either), but, just to prove that my “one person’s income is another’s cost” formulation is not some liberals-only shibboleth, check out the third slide in this PowerPoint presentation, based on the textbook of Greg Mankiw, an economic official in George W. Bush’s administration. Or this blog post on Freakonomics. Or this, from self-described libertarian Arnold Kling:
“It means that one person’s spending is another person’s income. When I buy a meal at a restaurant, the money I spend ends up as income for restaurant owners, cooks, wholesale food distributers, farmers, and so on.”
Is basic economics really this hard to get?
Anyway, in case Pompeo would like an honest-to-goodness businessman to make the same case, check out this from a story in Bloomberg Businessweek:
Meanwhile, Thermo Fisher Scientific in Waltham, Mass., is building emission monitors that power plants will need to measure toxins under the new rules. The regulations “could easily add $50 million to $100 million dollars in revenue in a year or two years,” says Chief Executive Officer Marc Casper, “which is significant for a company like ours.” The Institute of Clean Air Companies, a trade association representing businesses that make products to reduce industrial emissions, forecasts the industry will add 300,000 jobs a year through 2017 as a result of the EPA rules.