What I Learned as an EPI Intern
As my summer internship draws to a close at EPI, I thought I’d reflect on some of the things I’ve learned.
1. Time-and-a-half may not be standard for many today, but it should be.
Current overtime rules provide nowhere near enough protection for workers. The salary threshold of $455 a week, set by the Fair Labor Standards Act, is actually below the poverty line for a family of four. Further, the “primary duty” test to classify an employee as an executive, professional, or administrator who is exempt from overtime is easily manipulated by employers—unless you actually believe that lots of workers officially classified as managers and supervisors make a lot of organizational decisions while mopping floors and stocking shelves.
The impact on millions of workers and their families is stark. I spoke with “managers” with no control over their own schedules who were forced to work grueling 80 hour weeks with salaries of $35,000 and no overtime pay. Some went months on end without a single day off. Their lives are riddled with stress and anxiety. The time they can spend with family and friends has eroded. One store manager was even prevented from seeing her dying niece—called into work despite having scheduled the day off. These stories, unfortunately, go on and on for far too many American workers.
Thankfully, President Obama has directed the Department of Labor to update its overtime rule. Hopefully this new rule (scheduled to be proposed in November) will at the very least raise the salary threshold to $984 a week and index it to inflation, as proposed by Ross Eisenbrey and Jared Bernstein. Such a change would benefit 5 – 10 million workers. While this would be a modest step forward, ideally the salary test would be raised even higher—Heidi Shierholz found that a $1,122 threshold would be consistent with historic levels.
Should Race-Based Affirmative Action be Replaced by Race-Neutral Preferences for Low-Income Students? The Discussion Continues
The Supreme Court has nearly abolished the obligation of selective colleges and universities to give an advantage in admissions to African Americans, as a way to compensate for centuries of racially discriminatory public policy. According to the Court, such “affirmative action” violates the Constitution, which requires public universities to be “colorblind”—equally resistant to discriminating against African Americans as to favoring them to undo the effects of past discrimination.
The only race-conscious admissions programs the Court continues to permit is the pursuit of “diversity.” Universities may seek to ensure that their entering classes include a few violinists, jai-alai players, modern dancers, chess whizzes, computer nerds and, oh yes, some African Americans as well. This is a very small hoop through which admissions officers can jump.
In response, many liberals have attempted to develop a proxy for affirmative action—policy to increase the admission of African Americans by selecting characteristics that are not specifically black, but that in practice heavily favor blacks. The most common proxy is favoring the admission of low-income students of all races, or the admission of students of all races who live in low-income communities. As Justice Ginsburg has observed, “only an ostrich” can pretend that such policy is colorblind, because everyone knows that its true purpose is to evade the Court’s prohibition of affirmative action for African Americans.
But so far, the subterfuge has worked. The academic top-tier public universities in Texas, California, and Florida have guaranteed admission to graduates with the best grade-point averages from each high school in their states. Because large numbers of African Americans in these states are trapped in segregated low-income neighborhoods, the top students from ghetto high schools are guaranteed university admission, even if their academic qualifications are weaker than those of students who are not guaranteed admission but who attend high schools in middle class communities. Some private colleges have also developed policies that favor low-income students and these, too, necessarily enroll a disproportionate number of African Americans.
A Primer: What’s Going on with Part-time Work?
Part-time work—by definition, working less than 35 hours in a week—rose fairly steeply in the recession, but has remained roughly flat for the last five years. Currently, part-time employment makes up 19 percent of total employment, compared to 17 percent before the recession began.
To understand what’s driving those trends, it’s important to distinguish between two kinds of part-timers:
- People who work part time for “noneconomic reasons.” These are workers who work part time by their own preference, because they want or need a part-time schedule given other interests or obligations. This is often referred to as “voluntary” part-time work. Most part-time work is voluntary. Before the recession, 82 percent of part-time work was voluntary. Due to trends discussed below, that dropped to 66 percent in the immediate aftermath of the recession, and has since been recovering. Currently, 72 percent of part-time work is voluntary.
- People who work part time for “economic reasons.” These are workers who want and are available for full-time work but have had to settle for a part-time schedule, because their employer doesn’t give them enough hours or because they can only find a part-time job. This is often referred to as “involuntary” part-time work.
The figure below shows trends in full-time, voluntary part-time, and involuntary part-time work in the recession and recovery (specifically, it shows the growth rate in each type of job since December 2007, the official start of the Great Recession).
Thinking Like an RA, Jobs Day Edition: What I’ve learned in the last three years
In a month, I’ll be leaving EPI to begin graduate school in Seattle, which makes this my last jobs day. I’ve learned a lot in my three years at EPI, and I thought it might be useful to write a series of posts explaining how the work we do has shifted the way I think about economics.
Of all the tasks at EPI, frantically gathering and analyzing new employment data on the first Friday of every month has been one of the most formative. Jobs day is like monthly report card on how the labor market is doing for workers. While almost every news station covers the unemployment rate and jobs numbers, the full report contains a wealth of indicators and information that take a bit more analysis to understand.
My first jobs day reported the release of June 2011 data: a month that, like the months prior, showed painfully slow growth in the recovery of the Great Recession. The unemployment rate was undeniably high (9 percent), payroll employment had added an average of only 115,000 jobs per month over the last year, and both real wages and average weekly hours—two measures of how workers with jobs were faring—had fallen from the month before. We were in the beginning stages of the severe public-sector austerity that would strangle growth in coming years—governments (mostly state and local) had laid off an additional 130,000 workers within the last six months, adding to a cumulative half a million public sector jobs cut between 2007-2011. These indicators reflected a truly terrible economy. Two years out from the height of the Great Recession, many economists and policy makers were still arguing for another stimulus act, and the Fed had already launched two rounds of “quantitative easing.”
Remember the Last Time the Fed Tightened After a Recession? I Didn’t Either, So…
[Updated – somehow didn’t get the GDP row in previous table to come along—should be fixed now]
Ten years ago (July 2004) was the last time the Fed started raising the effective Federal Funds Rate to provide less support to an economic recovery. Many observers—even presidents of regional Fed banks—think the Fed should start tightening today. I thought I’d just take a quick look at some measures of slack and inflationary pressures to see if the economy does indeed look at least as tight as it did in July 2004. Indicators are in the table below.

First, the unemployment rate—it was 5.6 percent in the second quarter of 2004 (i.e., right before tightening began) and it’s 6.2 percent today.
Next, we look at the employment to population ratio for prime-age adults—simply the share of prime-age (25-54) adults with a job. This was 79 percent in July 2004 and is 76.5 percent today.
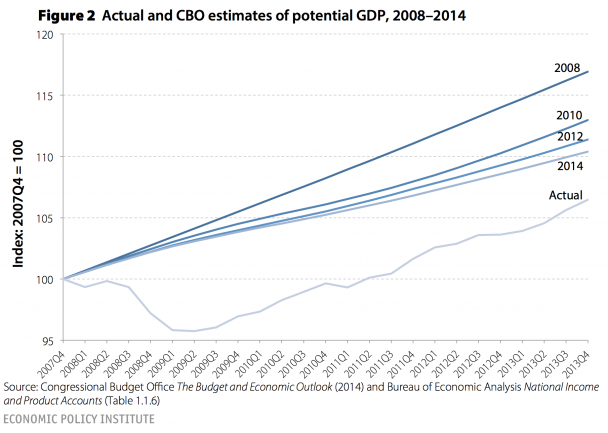
Third, we examine the output gap, as measured by the Congressional Budget Office. This is a measure of how much of the economy’s productive potential is being unused—the most direct attempt to measure economic slack. In the second quarter of 2004 this measure indicated that 0.9 percent of potential output being unused, while today this number is 4.5 percent—and this even after the CBO has made very large downward revisions in the unobserved “potential” measure.
I So Want to See Accelerating Job Growth, and It Is So Not Happening
Second quarter job growth was delightfully strong—277,000 jobs added per month on average—and even I got excited that maybe the pace of job growth was meaningfully accelerating. But July’s job growth of 209,000 certainly dampens those hopes. Over the 12 months from July 2013–June 2014, job growth averaged, yes, 209,000 per month. Sigh. At this pace, it will take nearly four years to get back to health in the labor market.

Tightening Labor Market Will at Some Point Strengthen Wage Growth, but No Sign of That Today
The weak labor market of the last seven years has put enormous downward pressure on wages. Employers just don’t have to offer big wage increases to get and keep the workers they need when their workers don’t have anywhere else to go. As the labor market continues to tighten, at some point wage growth will accelerate and workers will see real wage growth, which will be a very good thing. But as the figure shows, there is no sign of that yet in today’s jobs report.

Hope Springs Eternal, But The Data Is Actually Pretty Mixed About Whether Or Not Recovery Is Accelerating
The last couple of months have provided some data points that have raised hopes that the recovery is about to step into a higher gear.
Unemployment fell by 0.6 percent between December 2013 and June 2014, and essentially all of the decline was driven by actual job-growth rather than falling participation. Payroll job-growth for the second quarter of 2014 averaged 272,000, a rate that, if continued, would see us back to pre-Great Recession labor market health by early 2017. Not soon enough, but much better than the November 2018 recovery that would have happened had the pre-2014 pace of job-growth in the recovery persisted. And yesterday it was reported that gross domestic product grew at an annualized rate of 4.0 percent in the second quarter.
How excited should we be by all of this?
Let’s take GDP first, since the story is pretty unambiguous: not very excited at all. Yesterday’s second quarter number was largely a pretty predictable bounceback from the disastrous first quarter numbers, which showed that the economy contracted at a 2.1 percent rate. Average these two quarters and you have the economy growing at less than a 1 percent rate for the first half of the year. This sad performance comes even as the fiscal drag from federal and state governments has relented a lot since 2013. It’s very hard to see us moving ahead of the same 2 percent growth in final demand that we have seen over the past three years.
What To Watch On Jobs Day—Have We Really Kicked It Into A Higher Gear?
Last month’s jobs report was a strong one. We added 288,000 jobs, bringing the second-quarter average growth rate to 272,000 jobs per month. Meanwhile, the unemployment rate dropped for good reasons—because people found work, not because people stopped looking. Indeed, last month’s report made me unusually optimistic; at a growth rate of 272,000 jobs per month, we would get back to a healthy labor market in early 2017. That would still mean that the Great Recession, all told, will have caused roughly ten years of weakened labor market opportunities for American workers, but at least there’s light at the end of the tunnel.
So July’s jobs numbers, which will be released on Friday, will help answer the all-important question: have we really kicked it into higher gear? A jobs number north of 270,000 would be a pretty clear sign that the answer is yes—but anything much less than that would push us back to “we have to wait and see” territory. Unfortunately, consensus forecasts are for job growth around 235,000—if true, that sets us back to growth rates that put health in the labor market more than three years away.
Social Security and Medicare Trustees Reports Show the Impact of Slowing Health Costs
The big news in the Social Security and Medicare trustees reports released this afternoon is the improvement in Medicare’s finances due to slowing health cost inflation. As a result, the Medicare Hospital Insurance Trust Fund is projected to remain solvent until 2030, four years later than projected last year. The projected HI Trust Fund’s 75-year shortfall is 0.87 percent of taxable payroll, down from 1.11 percent of payroll last year.
On the other hand, the trustees also assume the Medicare Sustainable Growth Rate formula will not take effect. Though Congress has overridden the legislated reduction in physician payment rates since 2003, it has also included provisions offsetting part or all of the cost to Medicare. Implicitly, the projections now assume the “doc fix” will no longer include such provisions, raising projected Medicare Part B costs by about 0.3 percentage points annually over the next 75 years.
The combined effect of these changes is a reduction in projected short- and medium-term costs and an increase in long-term costs. Last year, costs were projected to rise to 3.6, 5.8, and 6.5 percent of GDP in 2012, 2040 and 2087, respectively. This year, costs are projected to rise to 3.5, 5.6, and 6.9 percent of GDP in 2013, 2040 and 2088, respectively.
Social Security projections show little change from last year, with the combined old age and disability trust funds projected to remain solvent through 2033—the same as last year—and a modest increase in the long-term shortfall from 2.72 percent of taxable payroll last year to 2.88 percent of taxable payroll this year. The change in the valuation period—one fewer year of surplus and one more year of deficit—accounts for 0.6 percentage points of the decline. The rest is due to small changes in demographic and economic assumptions (such as a reduction in the inflation rate from 2.8 to 2.7 percent), methodological improvements, and the repeal of parts of the so-called Defense of Marriage Act.