National Retail Federation Report Suggests Huge Positive Impact for Labor Department Overtime Rules
The National Retail Federation (NRF), a lobbying organization for department store corporations, sporting goods and grocery chains, and other large retailers, is opposed to the Department of Labor’s update of the rules governing the right of salaried workers to overtime pay. The reasons the NRF gives are somewhat contradictory and are sometimes surprising. But they boil down to this: the retail lobby doesn’t think businesses should have to pay for the overtime hours most of their employees work.
In March 2014, President Obama directed the Secretary of Labor to update the rules intended to exclude high-level employees like executives and professionals from overtime protections. The rules are currently so out of date that they define even workers earning below-poverty salaries as exempt, even though the pay of true executives and professionals like lawyers and CPAs has been soaring for decades. To fix this problem, the Labor Department is reportedly considering raising the threshold for exemption from $23,660 a year to $42,000 or more. Some advocates are calling for a threshold as high as $70,000 a year, which would protect the same share of the salaried workforce as was covered in 1975.
If the threshold is raised to $42,000, the NRF predicts significant changes in retail employment: while some employers will raise salaries for employees near the threshold to guarantee that they continue to be excluded from overtime protection, many salaried employees (some of whom work 60-70 hours a week for no extra pay) will have their hours reduced and as a result, 76,000 new jobs will be created averaging 30 hours per week. Altogether, half of the retail workforce that is currently excluded from coverage will be guaranteed coverage by the law’s overtime protections. That all sounds pretty good to me.
TPP Panic: Playing the China Card
Stung by the sudden derailment in the House of Representatives of their rush to pass the Trans-Pacific Partnership (TPP), the Washington establishment has wasted no time in warning us of the terrifying menace of a rising China, should the trade deal not be put back on track next week.
Echoing previous remarks by the president, House Speaker John Boehner warned “we’re allowing and inviting China to go right on setting the rules of the world economy.” Pro-TPP Democratic Congressman Jim Hines (D-Conn.) said that Friday’s vote, “told the world that we prefer that China set the rules and values that govern trade in the Pacific.”
These remarks are both fatuous and revealing of how weak the case for the TPP is, even among its own promoters.
As a matter of obvious fact, the rules of the world economy within which the Chinese have been taking the United States to the economic cleaners were not set in China. They were set in Washington, DC by our own American policymakers and fixers who in one way or another were, and still are, are in the pay of multinational corporate investors.
Under Ronald Reagan, the two Bushes, Bill Clinton and now Barack Obama the United States government designed and imposed the global model of “free trade” which promoted the shift of investment from the United States to parts of the world where labor is cheap, the environment is unprotected, and the public interest is even more up for sale than it is here.
TiSA: A Secret Trade Agreement That Will Usurp America’s Authority to Make Immigration Policy
Proponents of Trade Promotion Authority (aka fast-track trade negotiating authority), which the House of Representatives will likely vote on soon, have made an unequivocal promise that future trade agreements like the Trans-Pacific Partnership (TPP) and the Transatlantic Trade and Investment Partnership (TTIP) will explicitly exclude any provisions that would require a change to U.S. immigration law, regulations, policy, or practices. Many members of Congress in both parties have expressed concern that trade agreements might limit America’s ability to set immigration policy. Republican congressmen Paul Ryan and Robert Goodlatte have responded by explicitly assuring members of their party that there will be no immigration provisions in any trade bill.
U.S. Trade Representative Michael Froman has stated in an interrogatory with Sen. Chuck Grassley (R-Iowa) and via letter that nothing is being negotiated in the TPP that “would require any modification to U.S. immigration law or policy or any changes to the U.S. visa system.”
Furthermore, just a few weeks ago, the Senate Finance Committee released a statement titled “TPA Drives High-Quality Trade Agreements, Not Immigration Law: The Administration Has No Authority Under TPA or Any Pending Trade Agreement to Unilaterally Change U.S. Immigration Laws,” and the committee’s May 12 report on the Fast Track bill that was eventually passed by the full Senate contained this relevant language:
For many years, Congress has made it abundantly clear that international trade agreements should not change, nor require any change, to U.S. immigration law and practice…
The Committee continues to believe that it is not appropriate to negotiate in a trade agreement any provision that would (1) require changes to U.S. immigration law, regulations, policy, or practice; (2) accord immigration-related benefits to parties to trade agreements; (3) commit the United States to keep unchanged, with respect to nationals of parties to trade agreements, one or more existing provisions of U.S. immigration law, policy, or practice; or (4) expand to additional countries immigration-related commitments already made by the United States in earlier trade agreements.
The Politics of Fast Track: Exports, Imports and Jobs
The House is expected to vote this week on fast track authority to negotiate two massive trade deals, including the proposed Trans-Pacific Partnership (TPP) and the Transatlantic Trade and Investment Partnership (T-TIP). The Wall Street Journal noted on Sunday that “the decade’s old argument that major trade agreements boost both exports and jobs at home is losing its political punch, even in some of the country’s most export-heavy Congressional Districts.” One reason is that counting exports is less than half the story. While it’s true that exports support domestic jobs, imports reduce demand for domestic output and cost jobs.
As I’ve written before, trade is a two-way street, and talking about exports without considering imports is like keeping score in a baseball game by counting only the runs scored by the home team. It might make you feel good, but it won’t tell you who’s winning the game. The Journal story included a table showing the ten congressional districts with the biggest gains in exports since 2006. The authors expressed surprise that only three of the ten members representing these districts have announced support for fast track (trade promotion authority, or TPA).
Looking at jobs supported and displaced by trade in these districts provides a very different picture, which helps explain why supporters of fast track are having trouble rounding up votes in the House. In a recent study, I estimated the number of jobs supported and displaced by China trade between 2001 and 2013. We used the results of this study to examine the impacts of China trade on jobs by congressional district between 2006 and 2013—the period covered in the Wall Street Journal story. The results for the top ten districts identified by the Journal are shown in the following table.
Pension Politics in Pennsylvania
I testified last week in Harrisburg on a 410-page public pension “reform” bill (SB1) that neither I nor my fellow witnesses had read. Normally, we would have been able to rely on actuarial reports, but the actuaries weren’t given enough time to read the bill either. This didn’t stop 28 state senators from passing the bill on a party-line vote without even bothering to hold a hearing (the two I attended—one as a witness—were held by House committees after the Senate vote).
At the first hearing, supporters claimed the bill would help repair Pennsylvania’s credit rating and ensure intergenerational equity. You would never know that the bill actually delays paying down legacy costs. As a result, even the Manhattan Institute’s Richard Dreyfuss (the public pension scourge, not Jaws hero), couldn’t bring himself to support it.

Supporters also claim the bill “preserves current employee retirement benefits,” despite the fact that $13 billion of the projected $16 billion in cost savings comes from changes affecting current employees. At least one of these changes—removing a subsidy for lump sum distributions—might be a good idea in the abstract. But all cuts affecting mid-career workers will inevitably (and probably successfully) be challenged in court, as Dreyfuss pointed out.
Job Openings Rise as the Hires and Quits Rates Remain Stubborn
This morning’s Job Openings and Labor Turnover Survey (JOLTS) report reflects the solid employment situation for April, which is considerably better than the weakness we saw in March. Job openings were up, which, along with a slight drop in the unemployment level, meant that the job-seekers-to-job-openings ratio fell to 1.6 in April. While this reflects an improvement, it fails to include the 3.1 million missing workers in April and is still far above its low-point of 1.1 in 2000. Furthermore, it remains the case that even if we continue moving forward at the pace of average employment over the last six months (236,000 jobs per month), the economy won’t resemble the strength of the pre-recession economy (such as it was) until the end of next year.
The total number of job openings rose to 5.4 million in April while the number of hires was little changed at 5.0 million. While there has been a clear improvement, it is important to remember that a job opening when the labor market is weak often does not mean the same thing as a job opening when the labor market is strong. There is a wide range of “recruitment intensity” a company can put behind a job opening. If a firm is trying hard to fill an opening, it may increase the compensation package and/or scale back the required qualifications. On the other hand, if it is not trying very hard, it might hike up the required qualifications and/or offer a meager compensation package. Perhaps unsurprisingly, research shows that recruitment intensity is cyclical—it tends to be stronger when the labor market is strong, and weaker when the labor market is weak. This means that when a job opening goes unfilled and the labor market is weak, as it is today, companies may very well be holding out for an overly-qualified candidate at a cheap price.
Another indicator of the labor market’s continued weakness is the depressed quits rate. The figure below displays the rate of separations disaggregated into the hires rate, the quits rate, and the layoff rate. Layoffs shot up during the recession but recovered quickly and have been at pre-recession levels for more than three years. The fact that this trend continued in April is a good sign. That said, not only do layoffs need to come down before we see a full recovery in the labor market, but hiring also needs to pick up—the hires rate was down slightly to 3.5 percent in April. It has been generally improving, but it still remains below its pre-recession level.
Young Black High School Grads Face Astonishing Underemployment
Last week, I wrote about how high school graduates will face significant economic challenges when they graduate this spring. High school graduates almost always experience higher levels of unemployment and lower wages than their counterparts with a college degree, and their labor market difficulties were particularly exacerbated by the Great Recession. Despite officially ending in June 2009, the recession left millions unemployed for prolonged spells, with recent workforce entrants such as young high school grads being particularly vulnerable.
Underemployment is one of the major problems that young workers currently face. Approximately 19.5 percent of young high school graduates (those ages 17–20) are unemployed and about 37.0 percent are underemployed. For young college graduates (those ages 21–24) the unemployment rate is 7.2 percent and the underemployment rate is 14.9 percent. Our measure of underemployment is the U-6 measure from the BLS, which includes not only unemployed workers but also those who are part-time for economic reasons and those who are marginally attached to the labor force.
When we look at the underemployment data by race, we often see an even worse situation. As shown in the charts below, 23.0 percent of young black college graduates are currently underemployed, compared with 22.4 percent of young Hispanic college grads and 12.9 percent of white college grads. And as elevated as these rates are, the picture is bleakest for young high school graduates, who are majority of young workers.
Underemployment rate of young college graduates, by race and ethnicity, 2000–2015*
| Date | White | Black |
|---|---|---|
| 2000-01-01 | 7.6% | 17.5% |
| 2000-02-01 | 7.5% | 17.8% |
| 2000-03-01 | 7.8% | 17.8% |
| 2000-04-01 | 7.8% | 17.0% |
| 2000-05-01 | 7.9% | 16.1% |
| 2000-06-01 | 7.8% | 16.6% |
| 2000-07-01 | 7.7% | 15.4% |
| 2000-08-01 | 7.4% | 14.6% |
| 2000-09-01 | 7.3% | 15.1% |
| 2000-10-01 | 7.2% | 15.3% |
| 2000-11-01 | 7.0% | 15.7% |
| 2000-12-01 | 6.9% | 15.4% |
| 2001-01-01 | 6.8% | 14.2% |
| 2001-02-01 | 6.8% | 12.2% |
| 2001-03-01 | 6.9% | 11.6% |
| 2001-04-01 | 7.0% | 11.6% |
| 2001-05-01 | 6.9% | 11.3% |
| 2001-06-01 | 7.1% | 12.0% |
| 2001-07-01 | 7.1% | 12.3% |
| 2001-08-01 | 7.6% | 13.3% |
| 2001-09-01 | 8.1% | 13.3% |
| 2001-10-01 | 8.3% | 14.0% |
| 2001-11-01 | 8.5% | 14.7% |
| 2001-12-01 | 8.6% | 15.9% |
| 2002-01-01 | 8.8% | 16.4% |
| 2002-02-01 | 9.0% | 17.6% |
| 2002-03-01 | 8.9% | 17.6% |
| 2002-04-01 | 8.9% | 18.3% |
| 2002-05-01 | 9.0% | 18.5% |
| 2002-06-01 | 8.8% | 18.2% |
| 2002-07-01 | 8.9% | 18.3% |
| 2002-08-01 | 8.6% | 17.5% |
| 2002-09-01 | 8.6% | 17.5% |
| 2002-10-01 | 8.4% | 17.3% |
| 2002-11-01 | 8.4% | 17.1% |
| 2002-12-01 | 8.7% | 15.7% |
| 2003-01-01 | 9.0% | 15.3% |
| 2003-02-01 | 8.9% | 14.9% |
| 2003-03-01 | 9.2% | 14.8% |
| 2003-04-01 | 9.1% | 14.3% |
| 2003-05-01 | 9.3% | 15.9% |
| 2003-06-01 | 9.6% | 15.2% |
| 2003-07-01 | 10.0% | 15.5% |
| 2003-08-01 | 10.3% | 15.5% |
| 2003-09-01 | 10.2% | 15.4% |
| 2003-10-01 | 10.4% | 15.1% |
| 2003-11-01 | 10.5% | 15.0% |
| 2003-12-01 | 10.4% | 15.1% |
| 2004-01-01 | 10.3% | 15.9% |
| 2004-02-01 | 10.5% | 16.9% |
| 2004-03-01 | 10.5% | 17.5% |
| 2004-04-01 | 10.7% | 17.4% |
| 2004-05-01 | 10.5% | 15.9% |
| 2004-06-01 | 10.6% | 15.4% |
| 2004-07-01 | 10.3% | 15.5% |
| 2004-08-01 | 10.1% | 14.6% |
| 2004-09-01 | 10.0% | 14.5% |
| 2004-10-01 | 9.8% | 15.9% |
| 2004-11-01 | 9.8% | 16.5% |
| 2004-12-01 | 9.8% | 16.7% |
| 2005-01-01 | 9.8% | 16.3% |
| 2005-02-01 | 9.8% | 15.5% |
| 2005-03-01 | 9.7% | 15.7% |
| 2005-04-01 | 9.7% | 15.8% |
| 2005-05-01 | 9.9% | 16.6% |
| 2005-06-01 | 9.6% | 16.5% |
| 2005-07-01 | 9.5% | 16.6% |
| 2005-08-01 | 9.6% | 17.5% |
| 2005-09-01 | 9.7% | 17.6% |
| 2005-10-01 | 9.6% | 16.5% |
| 2005-11-01 | 9.6% | 15.8% |
| 2005-12-01 | 9.5% | 15.5% |
| 2006-01-01 | 9.4% | 15.0% |
| 2006-02-01 | 9.4% | 15.2% |
| 2006-03-01 | 9.3% | 15.2% |
| 2006-04-01 | 9.0% | 14.5% |
| 2006-05-01 | 8.8% | 13.2% |
| 2006-06-01 | 8.9% | 13.8% |
| 2006-07-01 | 8.9% | 14.8% |
| 2006-08-01 | 8.6% | 14.6% |
| 2006-09-01 | 8.5% | 14.3% |
| 2006-10-01 | 8.7% | 13.7% |
| 2006-11-01 | 8.5% | 13.3% |
| 2006-12-01 | 8.7% | 13.2% |
| 2007-01-01 | 8.7% | 13.4% |
| 2007-02-01 | 8.4% | 13.2% |
| 2007-03-01 | 8.2% | 13.4% |
| 2007-04-01 | 8.2% | 14.6% |
| 2007-05-01 | 8.3% | 15.3% |
| 2007-06-01 | 8.4% | 15.2% |
| 2007-07-01 | 8.5% | 14.6% |
| 2007-08-01 | 8.8% | 13.6% |
| 2007-09-01 | 9.1% | 14.5% |
| 2007-10-01 | 9.0% | 15.1% |
| 2007-11-01 | 9.2% | 15.4% |
| 2007-12-01 | 9.0% | 16.2% |
| 2008-01-01 | 8.9% | 16.6% |
| 2008-02-01 | 9.0% | 17.0% |
| 2008-03-01 | 9.1% | 16.1% |
| 2008-04-01 | 9.2% | 15.5% |
| 2008-05-01 | 9.4% | 15.6% |
| 2008-06-01 | 9.8% | 15.6% |
| 2008-07-01 | 9.9% | 15.4% |
| 2008-08-01 | 9.9% | 16.5% |
| 2008-09-01 | 10.0% | 15.8% |
| 2008-10-01 | 10.2% | 14.9% |
| 2008-11-01 | 10.3% | 14.8% |
| 2008-12-01 | 10.6% | 14.7% |
| 2009-01-01 | 11.1% | 14.9% |
| 2009-02-01 | 11.5% | 16.0% |
| 2009-03-01 | 12.2% | 18.0% |
| 2009-04-01 | 12.5% | 19.5% |
| 2009-05-01 | 12.8% | 20.4% |
| 2009-06-01 | 13.3% | 20.7% |
| 2009-07-01 | 13.6% | 22.3% |
| 2009-08-01 | 14.4% | 24.1% |
| 2009-09-01 | 14.8% | 25.9% |
| 2009-10-01 | 15.1% | 26.1% |
| 2009-11-01 | 15.5% | 25.1% |
| 2009-12-01 | 15.8% | 25.9% |
| 2010-01-01 | 16.0% | 26.3% |
| 2010-02-01 | 16.2% | 25.8% |
| 2010-03-01 | 16.1% | 24.6% |
| 2010-04-01 | 16.4% | 25.3% |
| 2010-05-01 | 16.6% | 24.9% |
| 2010-06-01 | 16.6% | 26.6% |
| 2010-07-01 | 16.7% | 28.5% |
| 2010-08-01 | 16.2% | 28.9% |
| 2010-09-01 | 16.5% | 28.7% |
| 2010-10-01 | 16.6% | 29.2% |
| 2010-11-01 | 16.7% | 29.3% |
| 2010-12-01 | 16.7% | 30.0% |
| 2011-01-01 | 17.0% | 30.8% |
| 2011-02-01 | 17.2% | 30.7% |
| 2011-03-01 | 17.5% | 31.0% |
| 2011-04-01 | 17.3% | 28.8% |
| 2011-05-01 | 17.1% | 28.2% |
| 2011-06-01 | 17.1% | 28.4% |
| 2011-07-01 | 17.6% | 26.0% |
| 2011-08-01 | 18.1% | 24.6% |
| 2011-09-01 | 18.0% | 23.7% |
| 2011-10-01 | 17.7% | 23.5% |
| 2011-11-01 | 17.6% | 22.5% |
| 2011-12-01 | 17.3% | 21.3% |
| 2012-01-01 | 17.2% | 20.9% |
| 2012-02-01 | 17.0% | 21.1% |
| 2012-03-01 | 16.7% | 21.4% |
| 2012-04-01 | 16.5% | 22.4% |
| 2012-05-01 | 16.5% | 22.2% |
| 2012-06-01 | 16.4% | 20.3% |
| 2012-07-01 | 16.3% | 19.8% |
| 2012-08-01 | 15.9% | 20.6% |
| 2012-09-01 | 15.8% | 21.2% |
| 2012-10-01 | 15.7% | 20.6% |
| 2012-11-01 | 15.3% | 20.8% |
| 2012-12-01 | 15.5% | 20.8% |
| 2013-01-01 | 15.6% | 21.2% |
| 2013-02-01 | 15.6% | 22.9% |
| 2013-03-01 | 15.6% | 23.5% |
| 2013-04-01 | 15.7% | 23.0% |
| 2013-05-01 | 15.8% | 24.0% |
| 2013-06-01 | 15.7% | 25.2% |
| 2013-07-01 | 15.5% | 25.0% |
| 2013-08-01 | 15.5% | 26.4% |
| 2013-09-01 | 15.7% | 27.5% |
| 2013-10-01 | 16.0% | 28.2% |
| 2013-11-01 | 16.2% | 28.4% |
| 2013-12-01 | 16.1% | 29.0% |
| 2014-01-01 | 16.1% | 29.5% |
| 2014-02-01 | 16.0% | 28.2% |
| 2014-03-01 | 15.8% | 28.1% |
| 2014-04-01 | 15.4% | 27.8% |
| 2014-05-01 | 15.0% | 26.8% |
| 2014-06-01 | 14.9% | 26.2% |
| 2014-07-01 | 14.6% | 27.0% |
| 2014-08-01 | 14.3% | 25.3% |
| 2014-09-01 | 13.9% | 24.0% |
| 2014-10-01 | 13.6% | 23.4% |
| 2014-11-01 | 13.4% | 22.7% |
| 2014-12-01 | 13.4% | 22.2% |
| 2015-01-01 | 13.1% | 21.7% |
| 2015-02-01 | 13.0% | 23.7% |
| 2015-03-01 | 12.9% | 23.0% |

* Data reflect 12-month moving averages; data for 2015 represent 12-month average from April 2014 to March 2015.
Note: Data are for college graduates age 21–24 who are not enrolled in further schooling. Shaded areas denote recessions. Race/ethnicity categories are mutually exclusive (i.e., white non-Hispanic and black non-Hispanic). The Hispanic category is not included due to insufficient sample sizes over part of the series.
Source: EPI analysis of basic monthly Current Population Survey microdata
On Substance, Martin O’Malley Was Right About American Wages: Don’t Let Nitpicks Convince You That There Is Not A Crisis in American Pay
Three separate sources have recently “fact-checked” claims that Martin O’Malley made about American wages in his recent speech announcing his candidacy for the Democratic nomination. The precise O’Malley quote was:
Today in America, 70 percent of us are earning the same or less than we were 12 years ago, and this is the first time that that has happened this side of World War II.
O’Malley has said that our research on wages provided a basis for his claim (examples can be found here and here).
First, let’s be clear on what our claim is and then I’ll talk about the fact checkers’ assessments of O’Malley’s use of the data.
We have data on hourly wages by decile since 1973. Between 2002 and 2014, inflation-adjusted hourly wages for the bottom 7 deciles (i.e., 70 percent of the American workforce) fell. This is a remarkable economic fact and one that O’Malley is clearly right to highlight.
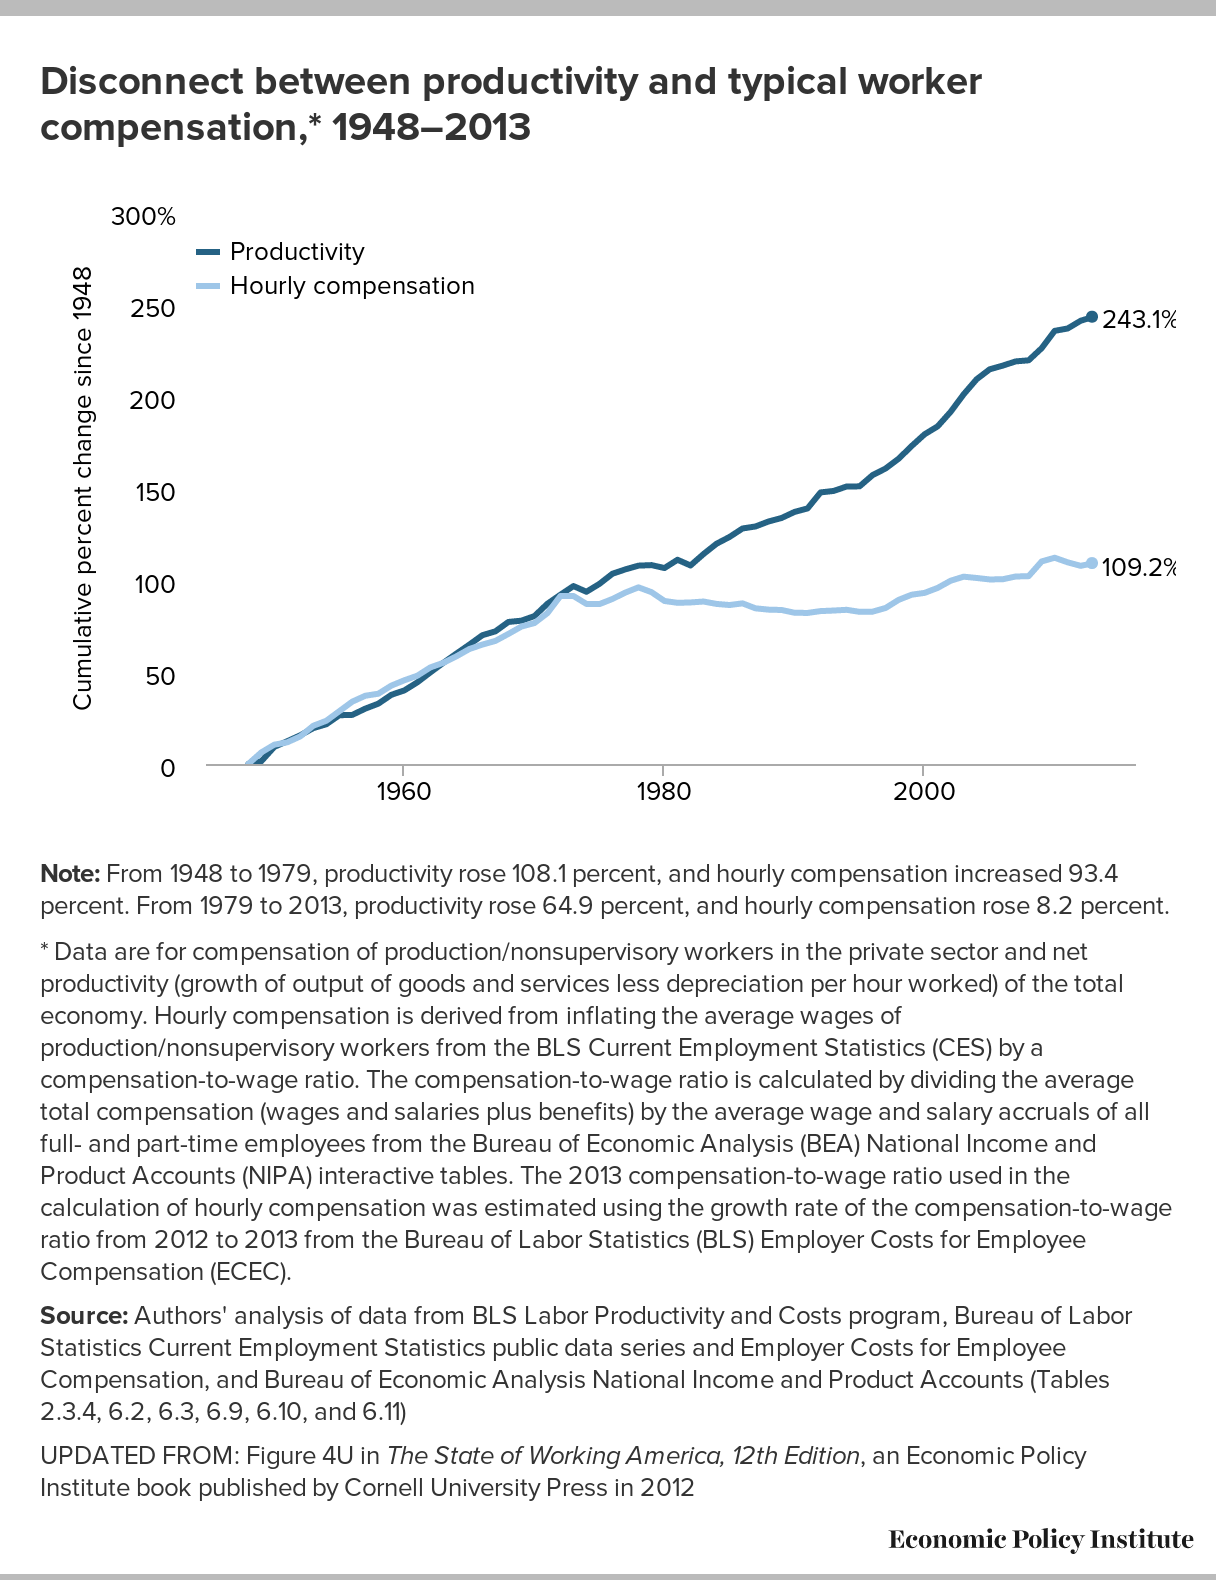
Further, between 1947 and 1973 there is almost certainly no 12-year period when the bottom 70 percent of wage earners saw hourly wage declines. Precise wage data by decile is sketchy over this period, but the circumstantial evidence on this is overwhelming. Just look at this graph, which shows hourly pay for a grouping reflecting the bottom 80 percent of the workforce rising sharply until the early 1970s.
What Can the TPP Offer Canada? Not Much.
When Canada joined the Trans-Pacific Partnership talks in 2012 it did so somewhat reluctantly and, like Mexico, with strings attached. One of them was that Canadian negotiators could not reopen any closed text. So, in this sense, it’s been a bit of a raw deal for the Obama administration’s NAFTA partners from the beginning. Canada’s bigger business lobbies called it a defensive move, to “secure” NAFTA supply chains rather than offering any meaningful market access elsewhere. The Canadian public have almost no idea what’s going on. But as TPP countries appear to be close to the end game, people here are starting to ask the obvious questions: what’s in it for us, and what will we have to give up to get it. The answers are equally obvious if you look past the hype: not much, and quite a lot.
To begin with, Canada already has free trade deals in place with four of the larger TPP countries (Peru, Chile, the United States, and Mexico), and tariffs on trade with the others—representing 3 percent of imports and 5 percent of exports—are very low. Canada has a trade deficit with these non-FTA countries of $5 to $8 billion annually, and 80 percent of Canada’s top exports to these countries are raw or semi-processed goods (e.g., beef, coal, lumber), while 85 percent of imports are of higher value-added goods (e.g., autos, machinery, computer and electrical components). This Canadian trade deficit will likely widen if the TPP is ratified, as the United States found two years into its FTA with South Korea.
Tariff removal through the TPP is therefore likely to worsen the erosion of the Canadian manufacturing sector and jobs that has been taking place since NAFTA—a result, in part, of the limits free trade deals place on performance requirements and production-sharing arrangements. NAFTA-driven restructuring did not even have the promised effect of raising Canadian productivity levels, which languish at 70 percent of U.S. levels twenty years into the agreement. Instead, Canada has experienced greater corporate concentration, a significant decline in investment in new production, and rising inequality.
In short, there is little trade expansion upside for Canada in this negotiation. And yet the Canadian public will eventually be asked to make considerable public policy concessions to see the TPP through. As many U.S. commentators have argued, the trade impacts of TPP are far less important than the serious concerns it raises about excessive intellectual property rights, regulatory harmonization, and the perpetuation of a controversial investor-state dispute settlement (ISDS) regime that has been extremely damaging to democratic governance globally, not to mention quite humiliating for Canada.
Et Tu, Mickey Mouse? Disney Pads Record Profits by Replacing U.S. Workers with Cheaper H-1B Guestworkers
There was a lot to celebrate in the Magic Kingdom this year. The Disney Corporation had its most profitable year ever, with profits of $7.5 billion—up 22 percent from the previous year. Disney’s stock price is up approximately 150 percent over the past three years. These kinds of results have paid off handsomely for its CEO Bob Iger, who took home $46 million in compensation last year.
Disney prides itself on its recipe for “delighting customers,” a recipe it says includes putting employees first. They tout this as a key to their success in creating “a culture where going the extra mile for customers comes naturally” for employees. One method of creating this culture is referring to its employees as “cast members.” In fact, Disney is so proud of its organizational culture that it’s even created an institute to share its magic with other businesses (for a consulting fee, of course).
So, you would expect a firm that puts its employees first to share the vast prosperity that’s been created with the very employees who went above and beyond to help generate those record profits.
Well, how did Mr. Iger repay his workers—sorry, I mean cast members—for creating all this profit? Not with bonuses and a big raises. Instead, as the New York Times just detailed in a major report, he forced hundreds of them to train their own replacements—temporary foreign workers here on H-1B guestworker visas—before he laid them off.