The Obama legacy: creating more, better jobs
This post originally appeared on TalkPoverty.org.
During his 2016 presidential campaign, president-elect Donald Trump promised that if he was elected, “the American worker will finally have a president who will protect them and fight for them.” Creating good-paying and high-quality jobs is definitely a worthwhile goal for the president to increase Americans’ living standards and decrease poverty.
Despite the president-elect’s claim that there are “no jobs,” the labor market has improved at a remarkably steady rate as the country worked its way out of the deep recession. During the past six years, there has been job growth each and every month, and a 5 percentage point drop in the unemployment rate. In part, that’s due to President Obama’s Recovery Act, which stimulated growth, provided aid to states, and invested in infrastructure. The rescue of the auto industry saved at least 1 million jobs, and kept an entire region out of a severe depression.
In 2015, most Americans finally started to feel the benefits of the recovery. Income rose for the typical American household, and the poverty rate saw one of the largest single-year declines in almost 50 years—primarily due to improvements in the labor market.
UN Special Rapporteur offers sharp criticism of American temporary foreign worker programs
On December 19, one day after International Migrants’ Day, Maria Grazia Giammarinaro, the United Nations Special Rapporteur on Trafficking in Persons, Especially Women and Children, issued a statement regarding her official visit to the United States to assess the country’s state of affairs on human trafficking. During her trip, Giammarinaro met with government officials, diplomats, trafficking survivors, and representatives from civil society. While she praised the United States for developing “an impressive number of laws and initiatives which focus on the protection of victims,” especially the Victims of Trafficking and Violence Protection Act and its subsequent reauthorizations, she offered up sharp and insightful criticisms of the nonimmigrant visa programs that temporarily authorize migrants to work in the United States:
The legal framework governing temporary visas for migrant workers, especially H-2A visa for temporary or seasonal agricultural work and H-2B visa for temporary or seasonal non-agricultural work visas, is of particular concern as it exposes applicants to the risk of exploitation, including human trafficking. Workers holding these temporary visas are tied to a specific employer who can exercise extensive control over them. Employers often confiscate passports, withhold wages, terminate contracts arbitrarily and threaten employees with job loss and deportation. Some live in deplorable housing conditions, commute long distance and enjoy low benefits. This is a serious problem in itself, but it is exacerbated by the fact that concerned workers may fear that if they report abuses, they will be deported or denied future visa applications. This situation creates vulnerabilities to labour exploitation, such as unsafe working conditions and isolation, especially in rural areas where there are fewer service providers. In order to prevent further harm, it will be essential to amend the regulation governing these temporary visas, as well as to those of Exchange visitor (J-1) and domestic workers (G-5) visas, and make visa “portable” to allow workers to change abusive employers.
In time for Christmas: a “progressive” Social Security plan Scrooge would love
Donald Trump ran a campaign that rejected Republican orthodoxy on a variety of issues. He consistently and emphatically rejected the party line on slashing social insurance programs like Medicare and Social Security. And yet, Congressional Republicans are ploughing ahead with plans to gut these benefits. The latest proposal, from House Social Security Subcommittee Chairman Sam Johnson (R-Texas), actually slashes benefits even more than would be sufficient to close Social Security’s projected shortfall. The extra savings generated by these cuts is used to reduce taxes on higher-income households.
Johnson attempts to camouflage the draconian nature of his plan with targeted benefit increases for low earners. Despite this window dressing, as many low earners will see cuts as will see increases, according to the Social Security Actuary’s analysis of the plan. This hasn’t stopped budget hawks from touting its supposed progressivity, pointing to a benefit formula more tilted in favor of low earners and an increase in the special minimum benefit going to those with steady work histories. However, for most workers, including many low earners, these provisions are more than offset by benefit cuts.
The first major plank of the Johnson plan revises the overall benefit formula for retirees. By itself, this provision would increase benefits for roughly half of workers (the 51 percent with earnings below 90 percent of the average wage index) while reducing them by a greater amount for the other half. Johnson also introduces a revised special minimum benefit that would increase benefits for around 37 percent of workers. However, other provisions increase the normal retirement age (equivalent to an across-the-board cut) and enact a range of other cuts. On net, only one in four workers (26 percent) would come out ahead from Johnson’s plan, while 70 percent would see benefit cuts, with some workers seeing cuts of up to 74 percent based on the examples modeled in the Chief Actuary’s analysis.
Criminal justice policy is education policy
In a new report, Mass Incarceration and Children’s Outcomes, we argue that criminal justice policy is education policy, and should be high on educators’ lists of concerns.
Several police killings of young men in African American neighborhoods, as well as the national racial polarization exposed in the recent presidential campaign, have called increased attention to our unresolved racial inequalities, including the disproportionate numbers of African American men who are in jail or prison. In the last months of his administration, President Obama responded to excessive federal prison sentences with a stepped up rate of commutations.
President-elect Trump, in contrast, has advocated a nationwide policy of “stop-and-frisk,” a police practice concentrated in low-income minority neighborhoods that invariably leads to the arrest and eventual imprisonment of men, African American men in particular, for non-violent victimless crimes.
“Stop and frisk,” as well as excessive sentencing for minor crimes, are not primarily federal policies, and once in office, Mr. Trump will have little influence over them. These are policies and practices of local and state governments, and reform is no less realistic or urgent now than it was before the presidential election.
SoftBank: Great press, bad for manufacturing, services, and the economy
Last week, President-elect Donald Trump took to Twitter to claim that Masayoshi Son, CEO of SoftBank of Japan, had agreed to invest $50 billion in the United States toward businesses and create 50,000 new jobs, and that “Masa said he would never do this had [Trump] not won the election!” As usual, the claim that Trump negotiated this deal is disputed, since SoftBank had announced plans to create a $100 billion technology investment fund, together with a public investment fund of Saudi Arabia, in October, before the election.
Worse yet, this deal is lose, lose, lose for the domestic economy. First, this inflow of foreign capital will bid up the U.S. dollar, which will reduce the competitiveness of U.S. manufacturing by making imports cheaper and exports more expensive. This will increase the U.S. trade deficit and reduce employment in U.S. manufacturing. The U.S. dollar has gained about 25 percent in the past two-and-a-half years, and one-fifth of that increase has occurred since the election. As a result, the trade deficit in manufactured goods increased sharply in 2015 and is poised for another increase after the recent run-up in the dollar. Meanwhile, the United States has lost 78,000 manufacturing jobs since the first of the year due, in part, to the rising trade deficit.
Second, foreign investment in the U.S. economy is dominated by foreign purchases of existing U.S. companies. Between 1990 and 2005, foreign multinational companies (MNCs) acquired or established domestic subsidiaries that employed 5.25 million U.S. employees. The vast majority (94 percent) of jobs associated with those investments were in existing firms acquired by foreign MNCs. However, 4 million of those jobs disappeared through layoffs or divestiture of part or all of those companies, as shown in my 2007 paper, The Hidden Costs of Insourcing. A classic example was the acquisition of IBM’s PC business by Chinese computer maker Lenovo in 2005. Lenovo shut down PC production in the United States and substituted PCs made in China and elsewhere in Asia. So PC production jobs in the United States disappeared.
We can’t meaningfully integrate schools without desegregating neighborhoods
This article first appeared on the NAACP Legal Defense Fund‘s website.
A bill introduced in the New York City Council proposes to establish “an office of school diversity within the human rights commission dedicated to studying the prevalence and causes of racial segregation in public schools and developing recommendations for remedying such segregation.”
But it is not reasonable, indeed it is misleading, to study school segregation in New York City without simultaneously studying residential segregation. The two cannot be separated.
School segregation is primarily a problem of neighborhoods, not schools. Schools are segregated because the neighborhoods in which they are located are segregated. Some school segregation can be ameliorated by adjusting school attendance boundaries or controlling school choice, but these devices are limited and mostly inapplicable to elementary school children, for whom long travel to school is neither feasible nor desirable. We have adopted a national myth that neighborhoods are segregated “de facto;” i.e., because of income differences, individual preferences, a history of private discrimination, etc. In fact, neighborhoods in NYC are segregated primarily because of a 20th century history of deliberate public policy to separate the races residentially, implemented by the city, state, and federal governments. Just a few examples:
How the Fed can fix one way the economy really is rigged: Restore the pursuit of full employment as their job number one
The election of Donald Trump alerted many to what should have been obvious long ago: the U.S. economy has failed to deliver the goods to vast swathes of American families for decades. In the context of Trump’s election, this economic failure was often characterized as being unique to white working-class voters in the upper Midwest. But this is wrong. Income growth has been sluggish, and hourly wage growth near-zero, for low and middle-income families across-the-board in recent decades. And many measures of racial income and wage gaps have actually worsened in recent years. In short, the income not going to white working-class residents of the upper Midwest has not been accruing to black and Latino workers; it’s instead just been funneled to the very top of the income distribution.
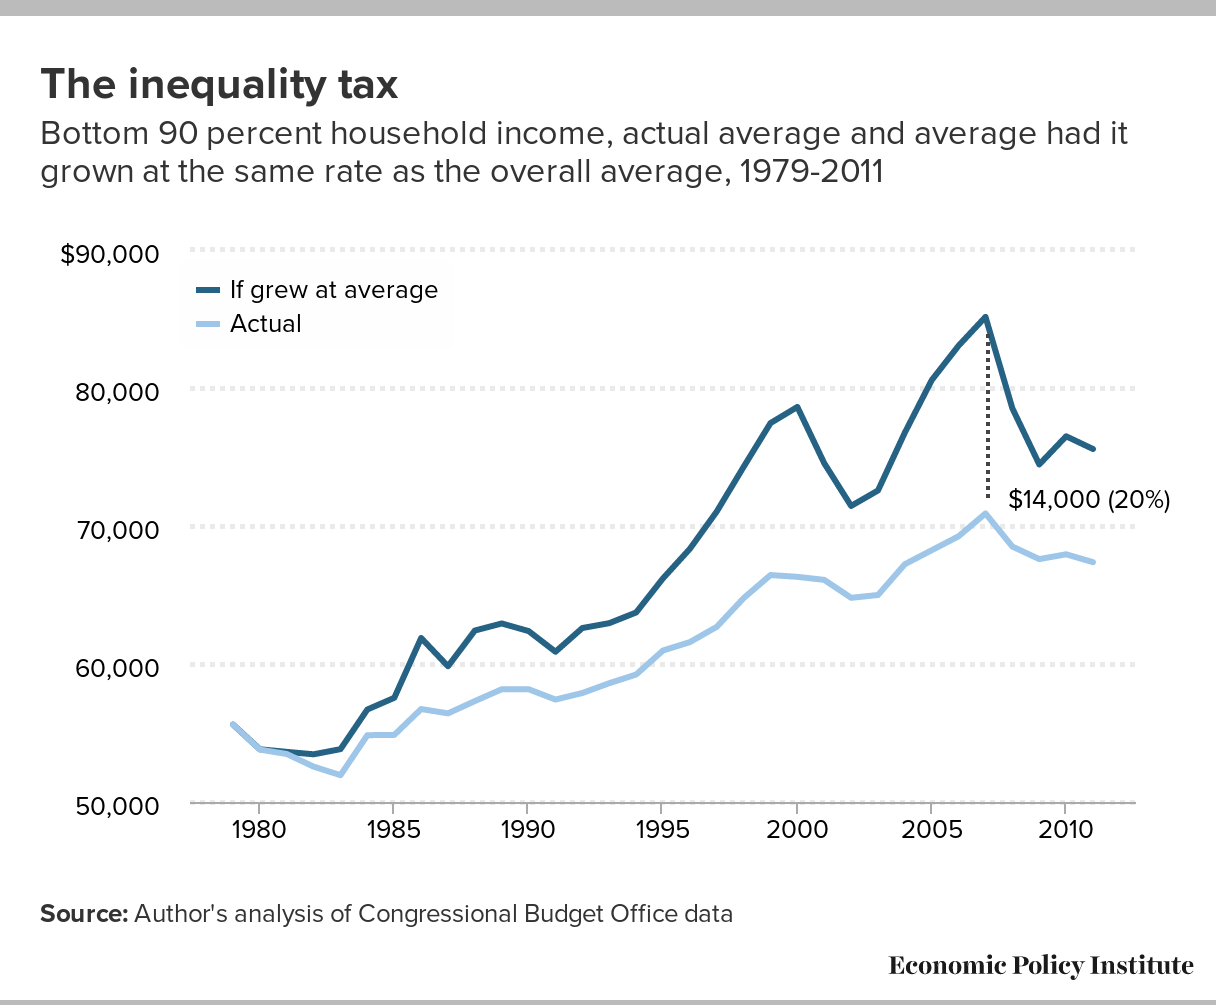
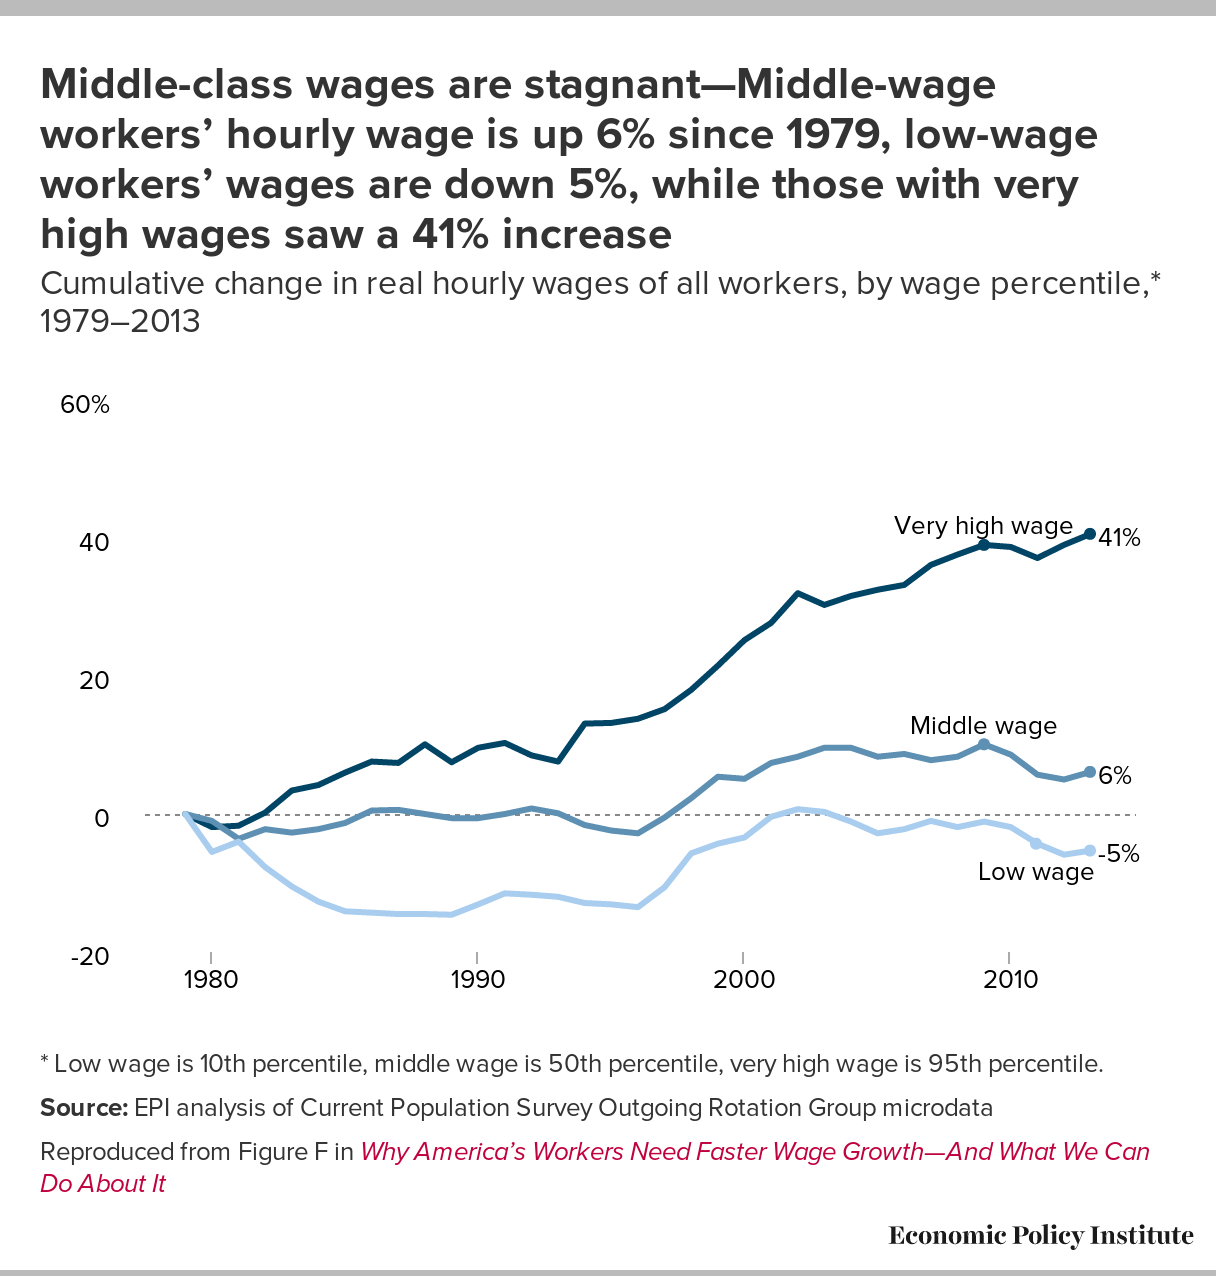
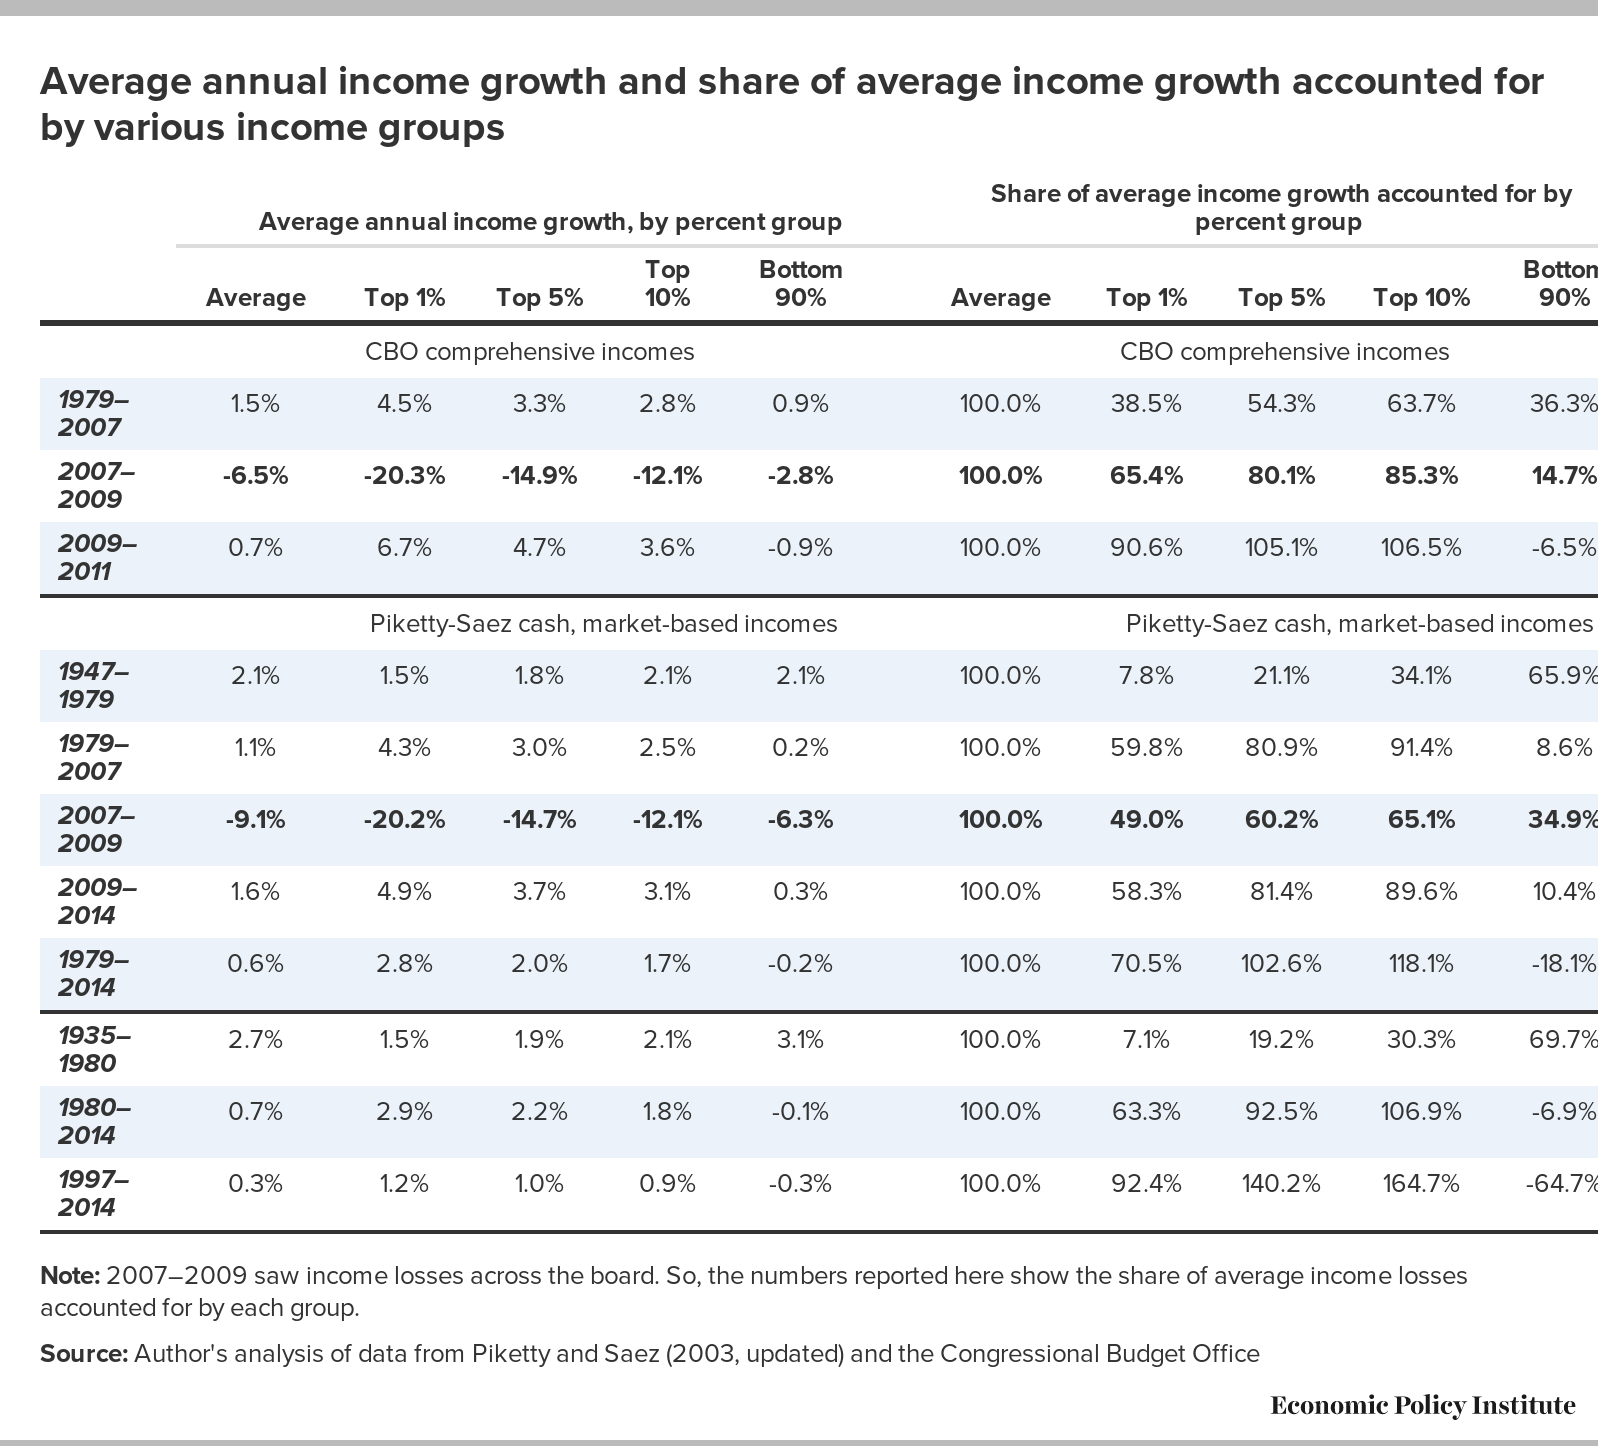
It’s not just politically important to realize that the economy’s failure to deliver income growth is not just a niche problem of white working-class voters in former manufacturing regions. This realization should also tell us something important about the economics of how to fix this. Too many have jumped to the conclusion that there’s just not much we can do for those workers that have been left behind in recent decades, because their troubles are mostly driven by huge, untamable forces like technological change and globalization. Here’s the astute economics writer Adam Davidson on Slate’s Political Gabfest podcast:
I know Hillary Clinton’s economic team fairly well, and I’m very impressed by them. They really are top-notch economists and economic policy thinkers. They don’t have anything for a 55-year-old laid-off factory worker in Michigan or northeastern Pennsylvania. Or whatever. They don’t have anything to offer them. And so I think it’s intuitively understandable that a screaming, loud, wrong answer is more compelling than a calm, reasonable, accurate, right answer: Your life is going to be worse for the rest of your life.
Andrew Puzder fails every test for a Labor Secretary
President-elect Donald Trump announced that he plans to nominate fast food CEO Andrew Puzder to head the Department of Labor (DOL). Puzder, who makes millions as a low-wage employer, fails every test for a Labor Secretary. DOL’s mission is to improve the wages and working conditions of working Americans, but Puzder wants to keep wages low and threatens to replace his fast food chain’s employees with robots if the minimum wage rises enough to crimp his profits.
He’s opposed to the new overtime rule that gave the right to time and a half pay to millions of salaried employees earning less than $47,476 a year. Walmart has already raised its managers’ pay, as did about half of all big retailers, even before the rule was supposed to take effect on December 1. But Puzder wants to kill it so he can keep working low-paid employees without paying them a dime extra for their overtime hours.
Heed union leader’s truth-telling on Trump/Carrier deal and judge on policy, not theatrics
Last week I argued that the Trump-brokered deal with Carrier industries to keep 700 jobs in Indiana shouldn’t be treated as a triumph, but instead as a sellout of those unlucky workers who hadn’t managed to make themselves useful as PR props for Trump. And yesterday somebody with actual credibility on this—Chuck Jones, a union leader who represents the Carrier employees—buttressed this argument.
One key point here is pretty simple: “doing deals” company-by-company, rather than instituting good policy rules across-the-board, will do nothing for American workers except pit them against each other. The Trump administration’s effectiveness in helping American workers should be judged on policy, not theatrics.
The biggest reason why this is true is that deals don’t scale-up against a recovering economy. A quick example: in the first quarter of 2009 (the first three months of President Obama’s presidency) 2.5 million workers were laid-off. In the most recent three months, 1.5 million workers were laid-off. What does this tell us?

First, that even in normal economic times, there is a ton of churn in the economy. Why do these 700 workers go to the front of the line in getting help from Trump while the other 1.4993 million are left on their own? An ironic note here is pointed out by Harold Meyerson: Trump never would have even heard of the planned Carrier move without the union (and Chuck Jones).
North Carolina voters’ anger about privatized infrastructure projects should serve as a warning to policymakers
Donald Trump’s preliminary plans for an infrastructure spending bill include a heavy role for private sector financing. We have argued elsewhere that this raises troubling questions. If our arguments have not yet persuaded policymakers on the dangers of wholly outsourcing infrastructure investment to private developers, perhaps they will be convinced by the result of a public-private partnership (P3) in North Carolina—an exercise in privatization that may have helped swing that state’s gubernatorial race.
Prior to the election, there was some speculation about whether or not an unpopular public-private partnership (P3) infrastructure deal in Charlotte would affect its outcome. The Charlotte Observer explains why initial indications suggest that this unpopular toll road did indeed likely sink the incumbent Governor McCrory’s bid for reelection. The issue is simple: North Carolina voters saw that the P3, which was sold on the basis of having a more innovative and competitive private sector direction, instead just became pure crony capitalism. The company got profits and excessive control in dictating what should be publicly-accountable decisions about public investments. North Carolina residents got tolls and are likely on the hook for taxpayer-funded bailouts. All in all, it is a clear cautionary tale about relinquishing control of infrastructure investments.
The Charlotte P3 financed the building, operating, and maintaining of new tolled express lanes on I-77. With mayors and governors usually hoping that ribbon-cutting on new infrastructure projects will be a boon to their campaigns, it may be surprising that additional lanes to alleviate congestion in a growing region would help sink a campaign. However, as is always the case with P3s, the devil is in the details.