Graham-Cassidy: Maybe the worst Republican health proposal yet
The first plan the House of Representatives put forward to repeal the Affordable Cart Act (ACA) was the American Health Care Act (AHCA). The Congressional Budget Office projected that the AHCA would cost 24 million Americans their health insurance coverage by 2026. An amended version, which passed the House, cut this number to 23 million. Besides inflicting these coverage losses, the AHCA would have cost jobs and increased out-of-pocket costs faced by Americans.
The second plan, the Better Care Reconciliation Act (BCRA) failed narrowly in the Senate. The CBO projected that the BCRA would have cost 22 million Americans their coverage by 2026. On one hand, it may have seemed like progress of some kind to reduce the number thrown off the insurance rolls relative to the AHCA, but the BCRA back-loaded severe cuts to Medicaid beyond the budget window that CBO traditionally examines. This means that in the longer run, the BCRA would have been even more destructive to health security than the House-passed plan. Additionally, unlike the AHCA, the BCRA cut not just the expansions to Medicaid passed under the ACA, but cut deeply into traditional, pre-ACA Medicaid, shifting the burden of paying for health care onto states and/or poor households.
Think of the latest Republican entry, known as Graham-Cassidy, as the BCRA on steroids. After the CBO budget window passes, Graham-Cassidy is not a “repeal-and-replace the ACA” plan. It’s not even a straight “ACA repeal” plan. Instead, it’s a plan that repeals the ACA and cuts Medicaid over and on top of that. It’s, in short, an attempt to rollback not just the ACA, but even the coverage provided by the pre-ACA American health care system.
Just to remind everybody, this pre-ACA coverage system was unraveling at a rapid rate, with roughly 15 million workers losing employer-based coverage between 2000 and 2010.
An evidence-based Fed would hold rates steady in September
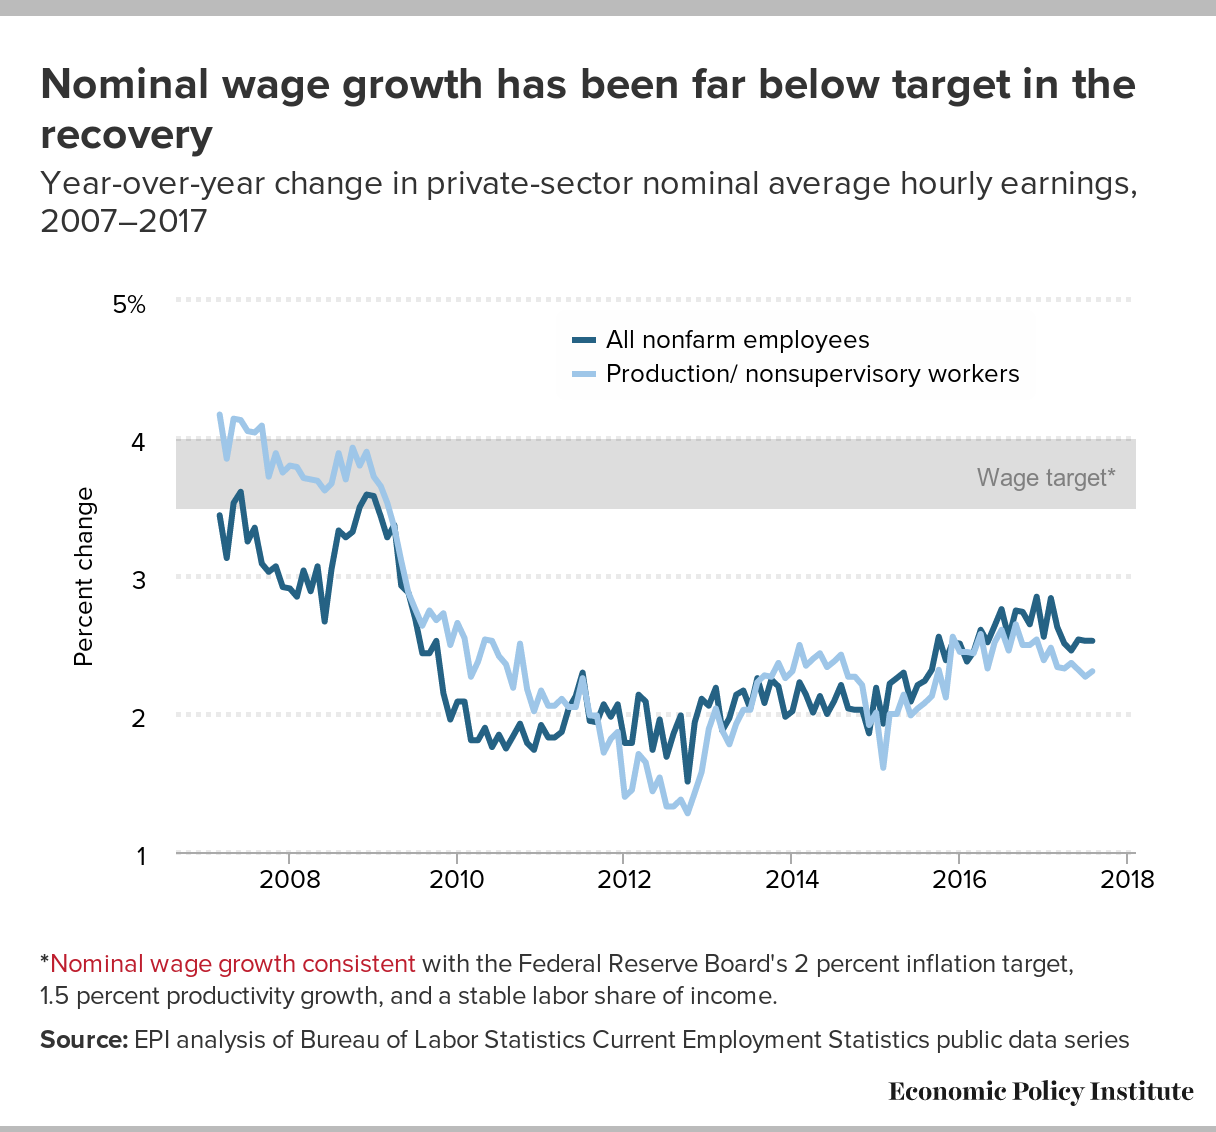
The Federal Open Market Committee (FOMC) meets today and tomorrow to determine whether or not to raise interest rates. The FOMC has raised rates three times since December 2016. The evidence arguing that these increases were wise or necessary was thin at best. That rationale for raising interest rates is to rein economic growth that threatens to drive down unemployment so low that workers will be empowered to achieve unsustainably large wage increases. The worry is that such wage increases could push price inflation over the Fed’s target rate.
But the real-world data that exists on every link of this causal chain shows that such worries are baseless. Economic growth in recent quarters is depressingly slow, not fast. Unemployment rates are in the low-end of historical experience, but have been lower (without wage or price inflation) several times in recent years. Other measures of labor market slack show the economy is far from recovered. Wage growth shows little sign of accelerating to levels that would spark wage-price spirals.
The rate increase that happened in June was particularly dispiriting for those hoping the Fed would continue to follow the evidence-based approach largely adhered to under the reign of Janet Yellen as Fed Chair. The economic data going into that meeting gave plenty of reasons why a data-dependent Fed might worry that it was riskier to raise rates too high too soon than to stand pat for a couple of months. Yet the Fed raised rates.
Data since June has been much softer. The Fed’s preferred inflation measure has decelerated significantly, and any upward creep of wage growth has stopped. There just is no case for continuing to raise rates in the face of this data.
While the outcome of any single FOMC meeting is not crucial for the American middle class, what this week’s meeting signals for the commitment of the Fed to genuine full employment is crucial. History has shown that low and middle-wage workers in the United States only get consistent annual wage increases when the economy is near genuine full employment. For example, for two solid years in 1999 and 2000 the unemployment rate averaged 4.1 percent and spent a number of months below 4 percent. And the late 1990s are the only time in recent economic history when wage growth was strong across the wage scale.
2016 ACS shows stubbornly high Native American poverty and different degrees of economic well-being for Asian ethnic groups
Thursday’s release of 2016 American Community Survey (ACS) data allows us to fill in the blanks for race and ethnic groups that were not covered in Tuesday’s Census Bureau report on income, poverty, and health insurance coverage in 2016. ACS is an annual nationwide survey that provides detailed demographic, social, and economic data for smaller populations like Native Americans and the thirteen distinct ethnic groups that make up the Asian American population. For the sake of comparability, in this blog post, the national estimates of median household income and poverty that I refer to are from the ACS.
Between 2015 and 2016, the real median household income for Native Americans increased 1.8 percent to $39,719. This was 69 percent of the national average in 2016 and $1,194 (-2.9 percent) lower than the group’s 2007 pre-recession level. While this data comes from a different source than Tuesday’s data on household income and covers a slightly different survey period, it suggests that Native American median household income is similar to that of black households, but Native American households experienced much slower income growth than blacks over the last year. Despite the income gains, poverty among all Native Americans was virtually unchanged between 2015 and 2016 (from 26.6 to 26.2 percent) and 33.8 percent of Native American children lived in poverty in 2016—the same as in 2015. Both rates are similar to those reported for blacks in the Current Population Survey, though slightly higher. The rate of poverty among Native Americans was nearly double the national average for all people and 1.7 times higher for children.
Median household income for Native Americans and total population (2016 dollars), 2005–2016
| Native Americans | Total population | |
|---|---|---|
| 2005 | $40,959 | $56,850 |
| 2006 | $40,198 | $57,675 |
| 2007 | $40,913 | $58,733 |
| 2008 | $42,157 | $57,879 |
| 2009 | $39,583 | $56,195 |
| 2010 | $38,595 | $55,090 |
| 2011 | $37,554 | $53,875 |
| 2012 | $36,914 | $53,697 |
| 2013 | $37,752 | $53,834 |
| 2014 | $37,745 | $54,404 |
| 2015 | $39,066 | $56,481 |
| 2016 | $39,719 | $57,617 |

Source: Author's analysis of American Community Survey data 2005-2016
Share of people in poverty, Native Americans and total population, 2015 and 2016
| Native Americans | Total population | |
|---|---|---|
| 2015 | 26.6% | 14.7% |
| 2016 | 26.2% | 14.0% |
Source: Author's analysis of American Community Survey data, 2015 and 2016
Share of children in poverty, Native Americans and total population, 2015 and 2016
| Native Americans | Total population | |
|---|---|---|
| 2015 | 33.8% | 20.7% |
| 2016 | 33.8% | 19.5% |
Source: Author's analysis of American Community Survey data, 2012 and 2013
According to my prior analysis of Tuesday’s Census report, Asian Americans were the only group for whom the increase in real median household income between 2015 and 2016 was statistically insignificant, but like non-Hispanic white and black households, still had not recovered their 2007 income level. The 2016 ACS data shows the variance in income across the different Asian ethnic populations, as well as their disparate rates of recovery. In 2016, median household income among Asian ethnic groups ranged from $110,026 for Indians to $38,971 for the Burmese. Indians also had the most income growth since 2007 (13.4 percent), although eight of the fourteen ethnic groups with reported income in 2007 had surpassed their 2007 income level. The wide range of incomes and income growth across Asian ethnic groups are also generally reflected in differences in poverty rates. Three groups—Indians (7.6 percent), Filipinos (6.6 percent) and Japanese (8.0 percent)— had poverty rates of 8 percent or lower, while over one-fourth of the Burmese (29.3 percent) and more than one-fifth of the Bangladeshi (22.6 percent) and Hmong (21.7 percent) populations lived in poverty.
Median household income and share of population in poverty, various Asian populations, 2016
| Share of U.S. Asian population | Poverty rate | Change in poverty | Median household income | Change in income | |||
|---|---|---|---|---|---|---|---|
| 2016 | 2016 | 2007-2016 | 2015-2016 | 2016 | 2007-2016 | 2015-2016 | |
| Bangladeshi | 1.0% | 22.6% | -2.3% | 1.5% | $46,806 | -3.2% | -6.7% |
| Burmese | 0.9% | 29.3% | N/A* | -5.6% | $38,971 | N/A* | -2.8% |
| Cambodian | 1.5% | 16.1% | -4.7% | -3.7% | $58,391 | 0.1% | 4.9% |
| Chinese (except Taiwanese) | 24.2% | 15.6% | 3.6% | 0.1% | $72,827 | -4.3% | 1.7% |
| Filipino | 16.1% | 6.6% | 1.1% | 0.1% | $88,745 | -0.3% | 3.7% |
| Hmong | 1.6% | 21.7% | -4.2% | -2.5% | $57,496 | 9.7% | 6.4% |
| Indian | 21.9% | 7.6% | -0.5% | 0.1% | $110,026 | 13.4% | 4.7% |
| Indonesian | 0.4% | 10.1% | N/A* | -4.7% | $70,539 | N/A* | 24.8% |
| Japanese | 4.5% | 8.0% | -0.5% | -0.3% | $76,175 | -0.3% | 0.9% |
| Korean | 8.2% | 13.1% | -0.5% | -0.3% | $63,677 | 4.3% | -0.2% |
| Laotian | 1.2% | 10.4% | -2.1% | -5.4% | $58,772 | -5.8% | 6.9% |
| Nepalese | 0.9% | 19.6% | N/A* | -1.5% | $50,497 | N/A* | 14.7% |
| Pakistani | 2.6% | 15.4% | 1.7% | 1.6% | $73,157 | 8.5% | -1.1% |
| Taiwanese | 1.0% | 11.9% | 0.3% | -0.8% | $90,221 | 2.9% | -2.0% |
| Thai | 1.2% | 14.7% | 2.2% | -1.3% | $66,976 | 7.6% | 12.1% |
| Vietnamese | 10.3% | 14.0% | 0.6% | -0.5% | $62,958 | 0.6% | 1.9% |
* ACS estimates for Indonesian, Nepalese, and Burmese populations started in 2011.
Note: The margin of error is greater in the ACS estimates for small sub-groups, which might account for the large percent changes in median household income and poverty rates for some Asian populations across years.
Source: Author's analysis of American Community Survey data 2007-2016
Little to no gain in median annual earnings in the 2000s, while significant wage gaps remain
This week, the Census Bureau released its report on incomes, earnings, and poverty rates for 2016. Most analysis paid particular attention to the changes between 2015 and 2016. We wanted to take a deeper look at earnings by race and gender over a longer period of time—since 2000—to paint a more complete picture of what has happened over the last full business cycle (2000-2007) plus the most recent recession and recovery (2007-2016). Since 2000, wages have been generally stagnant, and large gaps persist by race and gender. This longer-term trend might at least partially explain the less-than-rosy outlook many working people seem to have about the economy and their personal economic security—despite ongoing progress toward a full economic recovery.
To a great extent, trends in annual earnings since 2000 resemble the overall wage stagnation we’ve seen since the mid-1970s. (Here, we discuss annual full time earnings, but the long-run trends are consistent with the hourly wage data. For an extensive discussion of hourly wage trends, see The State of American Wages 2016.) Between 2015 and 2016, men’s earnings fell slightly, and are still 0.6 percent below their 2000 level. Meanwhile, women’s earnings increased slightly, and are now 8.5 percent higher than in 2000. Because of these divergent trends, the overall gender wage gap narrowed between 2000 and 2016, though at a slower rate than in the previous two decades.
These patterns in men’s and women’s full-time median annual earnings can be further broken down by race. As you can see in the figure below, real median earnings of full-time workers—male and female, black and white—have been relatively flat since 2000. While all four groups experienced an increase between 2014 and 2015, along with impressive gains across-the-board in 2015, only white women saw their median wages rise between 2015 and 2016. For the most part (except for white women), median wages were flat or falling in the full business cycle of 2000–2007, and have yet to significantly grow past their 2000 levels.
Most families are nearly back to 2007 income levels, but inequality continues to grow in 2016
In recent decades, the vast majority of Americans have experienced disappointing growth in their living standards—despite economic growth that could have easily generated faster gains in their living standards had it been broadly shared. Tuesday’s relatively good news on family income growth over the past year doesn’t make up for this long legacy of rising inequality. This year’s growth is encouraging though not as strong as the previous year in part due to near zero inflation between 2014 and 2015. Unfortunately, the growth in 2016 was also not as broadly shared as it was in 2015. Families in the top fifth of the income distribution grew faster than in 2015, while the bottom 80 percent of families saw slower growth. Another year of decent across-the-board growth should more than fully restore the income losses suffered during the Great Recession for most American families. But, it will barely put a dent in the generation of losses suffered as the incomes for the vast majority lagged far behind the economy’s potential.
As with most economic analysis, meaningful assessments of growth of living standards for the vast majority requires specifying benchmarks against which to measure actual performance. We offer up two reasonable benchmarks. The first is how income growth differs for families at different parts of the income distribution. What we have seen since the last business cycle peak in 2007, before the Great Recession hit, is growing income inequality. This week’s news that income growth in 2016 was positive across the board but does not overturn the general pattern of unequal growth that we have seen since 2007. The second benchmark we posit is income growth relative to that of earlier historical epochs. This benchmark shows that in the three decades following World War II, income growth was both much faster as well as more broadly shared than it has been since 1979.
Poverty declines in most states in 2016
The American Community Survey (ACS) data released today shows that the decline in the national poverty rate was felt in nearly every state. The poverty rate decreased in 43 states and remained unchanged in three states. While there were slight increases in the poverty rate in four states and the District of Columbia, the only statistically significant increase occurred in Vermont. In only two states, Louisiana and Mississippi, was the poverty rate above 20 percent.
Overall, the national poverty rate, as measured by the ACS, fell 0.7 percentage points, to 14.0 percent. Oregon saw the largest decline in its poverty rate (-2.1 percentage points), followed by Arkansas (-1.9 percentage points), Alabama (-1.4 percentage points), Hawaii (-1.3 percentage points), Montana (-1.3 percentage points), and South Carolina (-1.3 percentage points). There were increases in poverty in Vermont (1.7 percentage points), the District of Columbia (1.3 percentage points), Louisiana (0.6 percentage point), Oklahoma (0.2 percentage point), and Wyoming (0.2 percentage point). In Kentucky, Maryland, and West Virginia the rate remained essentially unchanged between 2015 and 2016.
Income growth at the national level and an increase in the number of jobs pulling workers off the sidelines accounted for a drop in the poverty rate in many states. While the federal minimum wage sits at $7.25, many states and localities have increased their minimum wages, which helps lift workers out of poverty. At the same time, government programs including Social Security, refundable tax credits, and Supplemental Nutrition Assistance Program (SNAP) are directly responsible for keeping tens of millions out of poverty across the country. A significant drop in the poverty rate for the second year in a row is a positive sign, but lawmakers should be careful to protect these recent gains with policies that raise wages for working families.
Incomes continued to rise in 2016 in four out of five states
State income data from the American Community Survey (ACS), released today by the Census Bureau, showed that from 2015 to 2016, median household income rose moderately across the country, with all but 7 states and the District of Columbia posting gains in inflation-adjusted household income. The ACS report showed a 2.1 percent increase in inflation-adjusted median household income for the country as a whole—an increase of $1,157 in the annual income of a typical U.S. household. This is similar to, albeit slightly lower than, the 3.2 percent increase in household income that the Census Bureau’s reported earlier this week using data from the Current Population Survey (CPS). The ACS and CPS have different samples and cover a somewhat different timeframe, which can lead to slightly different estimates.
In 2016, median household income ranged from $41,754 in Mississippi (17.5 percent below the median for the country) to $78,945 in Maryland (37.0 percent above the median for the country.)
From 2015 to 2016, the largest percentage gains in household income occurred in Idaho, where the typical household experienced an increase of $2,922 in their annual income—an increase of 6.0 percent. Massachusetts (5.3 percent), Oregon (4.9 percent), North Carolina (4.4 percent), Arkansas (4.3 percent), and New Jersey (4.1 percent) all had increases of 4 percent or more. Twelve other states (Nevada, California, Utah, South Carolina, Washington, Georgia, Rhode Island, Alaska, Maryland, Arizona, Indiana, and Nebraska) experienced income growth that exceeded the national average. Median household income was essentially unchanged over the year, after adjusting for inflation, in 4 states (Hawaii, Oklahoma, Vermont, and Montana), and it declined in 5 states (New Hampshire, Delaware, North Dakota, Wyoming, and Louisiana) and the District of Columbia. The states with the largest percentage declines—North Dakota at 1.1 percent, Wyoming at 1.8 percent, and Louisiana at 2.5 percent—are all states whose economies are heavily dependent upon energy production. Thus, it is likely that these declines are the result of falling energy prices, which slowed economic growth in these states.
Poverty declined modestly in 2016; government programs continued to keep tens of millions out of poverty
From 2015 to 2016, the official poverty rate fell by 0.8 percentage points, as household income rose modestly, albeit unevenly, throughout the income distribution. This was the second year in a row that poverty declined, and at 12.7 percent, the official poverty rate in 2016 was statistically the same as it was in 2007, just prior to the Great Recession. The poverty rate remains significantly higher than the low point of 11.3 percent it reached in 2000.
Since 2010, the U.S. Census Bureau has also released an alternative to the official poverty measure known as the Supplemental Poverty Measure (SPM).1
The SPM corrects many potential deficiencies in the official rate. For one, it constructs a more realistic threshold for incomes families need to live free of poverty, and adjusts that threshold for regional price differences. For another, it includes as income many resources available to poor families, such as Medicare, food stamps, and other in-kind government benefits.
As shown in Figure A, a larger proportion of Americans are in poverty as measured by the SPM than the official measure reports. (Importantly, however, researchers who constructed a longer historical version of the SPM found that it shows greater long-term progress in reducing poverty than the official measure.) In 2016, the SPM declined by 0.6 percentage points to 13.9 percent. Under the SPM, 44.6 million Americans were in poverty last year, compared with 40.7 million Americans under the “official” poverty measure.
New census data show strong 2016 earnings growth across-the-board, with black and Hispanic workers seeing the fastest growth for second consecutive year
Today’s Census Bureau report on income, poverty, and health insurance coverage in 2016 shows that median household incomes for all race and ethnic groups increased between 2015 and 2016. Encouragingly, groups that, by and large, had seen the worst losses in the years since the Great Recession saw the biggest earnings gains for the second consecutive year. Real incomes increased 5.7 percent (from $37,365 to $39,490) among African Americans, 4.3 percent (from $45,719 to $47,675) among Hispanics, 4.2 percent (from $78,143 to $81,431) among Asians, and 2.0 percent (from $63,747 to $65,041) among non-Hispanic whites. The increase in incomes was statistically significant for all groups except Asians, resulting in some improvement of racial and ethnic income gaps between 2015 and 2016. The median black household earned just 61 cents for every dollar of income the white median household earned (up from 59 cents), while the median Hispanic household earned just 73 cents (up from 71 cents). Meanwhile, households headed by persons who are foreign-born saw an increase in incomes of 4.9 percent between 2015 and 2016 (from $52,956 to $55,559), compared to an increase of 3.3 percent (from $57,896 to $59,781) among households with a native-born household head.
Real median household income, by race and ethnicity, 2000–2016
| Year | White | Black | Hispanic | Asian | White-imputed | Black-imputed | Hispanic-imputed | Asian-imputed | White | Black | Hispanic | Asian |
|---|---|---|---|---|---|---|---|---|---|---|---|---|
| 2000 | $63,589 | $41,349 | $46,229 | $65,836 | $42,217 | $44,789 | ||||||
| 2001 | $62,775 | $39,952 | $45,504 | $64,994 | $40,791 | $44,086 | ||||||
| 2002 | $62,583 | $38,732 | $44,173 | $70,224 | $64,795 | $39,545 | $42,797 | $75,793 | ||||
| 2003 | $62,340 | $38,681 | $43,055 | $72,677 | $64,543 | $39,493 | $41,714 | $78,440 | ||||
| 2004 | $62,147 | $38,240 | $43,546 | $73,067 | $64,344 | $39,043 | $42,190 | $78,861 | ||||
| 2005 | $62,427 | $37,933 | $44,213 | $75,101 | $64,633 | $38,729 | $42,836 | $81,056 | ||||
| 2006 | $62,417 | $38,063 | $44,983 | $76,484 | $64,622 | $38,862 | $43,582 | $82,549 | ||||
| 2007 | $63,576 | $39,261 | $44,775 | $76,521 | $65,822 | $40,085 | $43,380 | $82,589 | ||||
| 2008 | $61,906 | $38,147 | $42,266 | $73,173 | $64,093 | $38,947 | $40,949 | $78,975 | ||||
| 2009 | $60,929 | $36,454 | $42,557 | $73,244 | $63,082 | $37,219 | $41,231 | $79,052 | ||||
| 2010 | $59,948 | $35,361 | $41,423 | $70,735 | $62,067 | $36,103 | $40,133 | $76,344 | ||||
| 2011 | $59,130 | $34,392 | $41,216 | $69,499 | $61,220 | $35,113 | $39,932 | $75,011 | ||||
| 2012 | $59,599 | $34,835 | $40,777 | $71,754 | $61,705 | $35,566 | $39,507 | $77,444 | ||||
| 2013 | $60,036 | $35,647 | $42,205 | $69,098 | $62,158 | $36,395 | $40,890 | $74,577 | $62,158 | $36,395 | $40,890 | $74,577 |
| 2014 | $61,095 | $35,891 | $43,082 | $75,331 | ||||||||
| 2015 | $63,747 | $37,365 | $45,719 | $78,143 | ||||||||
| 2016 | 65041 | 39490 | 47675 | 81431 |
Note: CPS ASEC changed its methodology in 2013, hence the break in the series. Solid lines are actual CPS ASEC data; dashed lines denote historical values imputed by applying the new methodology to past income trends. White refers to non-Hispanic whites, black refers to blacks alone, Asian refers to Asians alone, and Hispanic refers to Hispanics of any race. Comparable data are not available prior to 2002 for Asians. Shaded areas denote recessions.
To account for the redesign of the CPS ASEC survey, when the difference between the original data for 2013 and the redesigned data for 2013 is small in magnitude (less than a 1 percent difference) and statistically insignificantly different, data for 2013 is an average of the original and redesigned data. When the difference between them is relatively large in magnitude (1 percent or greater) or statistically significantly different, we display a break in the series and impute the ratio between them to historical data.
Source: EPI analysis of Current Population Survey Annual Social and Economic Supplement Historical Poverty Tables (Table H-5 and H-9)
Based on EPI’s imputed historical income values (see the note under Figure A for an explanation), real median household incomes for all groups, except Hispanics, remain below their 2007 levels. Compared to 2007, 2016, median household incomes are down 1.5 percent (-$595) for African Americans, 1.2 percent (-$781) for non-Hispanic whites and 1.4 percent (-$1,158) for Asians, but increased 9.9 percent ($4,295) for Hispanics. Asian households continue to have the highest median income, despite large income losses in the wake of the recession.
Income growth in 2016 is strong, but not as strong as 2015 and more uneven
Today’s report from the Census Bureau shows strong across-the-board improvements to household incomes in 2016. Household incomes rose 3.2 percent, after an impressive 5.2 percent gain in 2015; non-elderly households saw a similar rise of 3.6 percent this year after gaining 4.6 percent the year before. However, inflation-adjusted full-time annual earnings for men fell slightly in 2016, 0.4 percent, while women working full time saw an earnings increase of 0.7 percent. Men’s earnings are still below their 2007 level (by 1.1 percent points), while women’s earnings are now 2.3 percent above. Better across-the-board earnings growth would have made this year’s income report unambiguously excellent news, much like the 2015 report. This year’s report is mostly encouraging, but wages need to make strong and sustained gains before we can rest easy about how the economy is working for typical American households.
While the gains in household income are not as impressive as the previous year, they nonetheless represent significant improvements. Part of this year’s slowdown in income growth relative to 2015 simply represents a small inflation bounce back. In 2015, plunging energy prices led to essentially zero inflation. In 2016, inflation rebounded to a still-low 1.3 percent. Besides representing a small slowdown in the pace of income growth, this year’s report reminds us that the vast majority of household incomes (when corrected for a break in the data series in 2013) have still not fully recovered from the deep losses suffered in the Great Recession—the bottom 80 percent of households had incomes in 2016 just at or below those of 2007 (while those in the top five percent are now 8.7 percent ahead). One more year of modest growth will likely bring the broad middle class back to pre-recession incomes.