Testimony of EPI Research and Policy Director Josh Bivens before the U.S. House Judiciary Subcommittee on Regulatory Reform, Commercial and Antitrust Law hearing on the impact of Federal rules on the economy. Rayburn House Office Building, February 24, 2016.
The premise of today’s hearing, that regulations are dragging down job creation and wage growth, is wrong. It is a distraction from the real causes of sluggish living standards growth for the vast majority of American households, which are Congress’s decision to embrace fiscal austerity rather than making job-creating investments in infrastructure and education to restore genuine full-employment, and the rise in inequality over the past generation of economic life. This rising inequality is driven by intentional policy decisions to shift economic leverage away from low- and middle-wage workers. A key part of this shift in leverage was the failure to update labor laws and labor standards to ensure that workers can bargain for a fair share of the growth they help create.
The business lobby’s argument surrounding regulation as the source of economic distress centers on claims that these regulations squeeze business profitability, and that this blunts incentives to hire and leaves no room to pay higher wages. But that argument fails some very basic empirical tests. Regardless of the pace of new regulations, profits since the current recovery began have been historically healthy. This should provide plenty of incentive to create jobs and leaves plenty of room for employers to give raises. Figure 1 below shows profit margins—unit profits divided by the price per unit of output – in the nonfinancial corporate sector. The latest data show pre-tax margins of 14.5 percent and post-tax margins of 10.6 percent. Between 1979 and 2007, these measures averaged 10.6 and 8.3 percent, respectively. In short, nothing in today’s economic data would indicate that regulations or anything else is squeezing business profits and hurting potential job or wage growth.
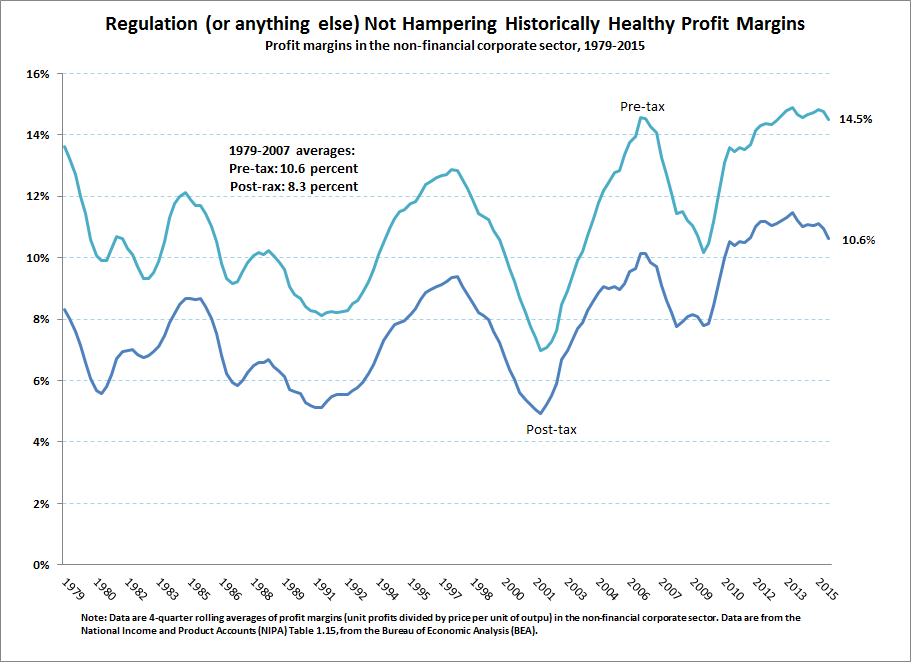
This piece of evidence really should end the argument. If regulatory changes aren’t squeezing profitability it’s really hard to see how they are hamstringing business. But we’ll say a bit more about jobs and wages below.
Nothing is killing private-sector jobs recently, not regulation or anything else
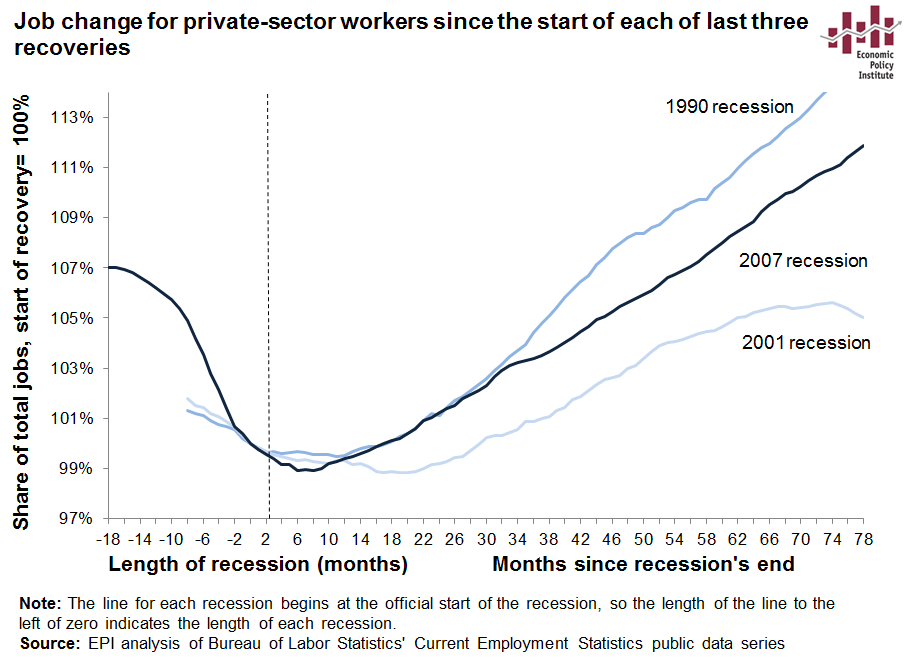
Both the number and accumulated gross cost of federal regulations (before accounting for the benefits of those regulations) are higher now after seven years of the Obama administration (as they are higher after every successive administration), yet private-sector employment has grown faster during the recovery from the 2008–2009 recession than it did during the recovery from the 2001recession (as shown in Figure 2 below).
Despite all of those years during which the Obama administration has supposedly overregulated, businesses have now added 14 million jobs over 71 straight months, extending the longest private-sector job creation streak on record (as shown in Figure 3 below). Private employment rose by 158,000 jobs in January, while the strong private employment growth in November and December was revised up by a combined 15,000 jobs. Over the past two years, businesses have added 5.5 million jobs—the most in any 24-month period since 1997–1999).
Monthly change in private sector payroll employment, 2008–2016
| Month | Moving | M-oM |
|---|---|---|
| Jan-2008 | 38 | 3 |
| Feb-2008 | 15.08333 | -116 |
| Mar-2008 | -7.58333 | -105 |
| Apr-2008 | -36.1667 | -220 |
| May-2008 | -58.0833 | -216 |
| Jun-2008 | -80 | -206 |
| Jul-2008 | -95.5 | -261 |
| Aug-2008 | -133.417 | -258 |
| Sep-2008 | -179.5 | -422 |
| Oct-2008 | -250.833 | -488 |
| Nov-2008 | -313.083 | -776 |
| Dec-2008 | -381.583 | -692 |
| Jan-2009 | -430.25 | -819 |
| Feb-2009 | -488.833 | -700 |
| Mar-2009 | -537.25 | -808 |
| Apr-2009 | -543.833 | -801 |
| May-2009 | -562.167 | -295 |
| Jun-2009 | -562.917 | -426 |
| Jul-2009 | -560.833 | -270 |
| Aug-2009 | -537.417 | -233 |
| Sep-2009 | -519.583 | -141 |
| Oct-2009 | -456.167 | -274 |
| Nov-2009 | -417.833 | -15 |
| Dec-2009 | -347.667 | -232 |
| Jan-2010 | -293.75 | 23 |
| Feb-2010 | -216.5 | -53 |
| Mar-2010 | -133.417 | 119 |
| Apr-2010 | -101.25 | 196 |
| May-2010 | -55.25 | 91 |
| Jun-2010 | -23.8333 | 126 |
| Jul-2010 | 4.75 | 107 |
| Aug-2010 | 26.83333 | 110 |
| Sep-2010 | 66.16667 | 124 |
| Oct-2010 | 78.33333 | 198 |
| Nov-2010 | 106.8333 | 131 |
| Dec-2010 | 111.3333 | 110 |
| Jan-2011 | 133.9167 | 77 |
| Feb-2011 | 142.75 | 218 |
| Mar-2011 | 153.9167 | 225 |
| Apr-2011 | 159.6667 | 330 |
| May-2011 | 164.6667 | 160 |
| Jun-2011 | 171.5833 | 186 |
| Jul-2011 | 173.8333 | 190 |
| Aug-2011 | 187.4167 | 137 |
| Sep-2011 | 184.75 | 287 |
| Oct-2011 | 188.3333 | 166 |
| Nov-2011 | 199.6667 | 174 |
| Dec-2011 | 225 | 246 |
| Jan-2012 | 227.5833 | 381 |
| Feb-2012 | 227 | 249 |
| Mar-2012 | 208.6667 | 218 |
| Apr-2012 | 205.5 | 110 |
| May-2012 | 194.6667 | 122 |
| Jun-2012 | 191.6667 | 56 |
| Jul-2012 | 193.5833 | 154 |
| Aug-2012 | 183.3333 | 160 |
| Sep-2012 | 189.5 | 164 |
| Oct-2012 | 190.5 | 240 |
| Nov-2012 | 192.9167 | 186 |
| Dec-2012 | 179.5 | 275 |
| Jan-2013 | 183.5 | 220 |
| Feb-2013 | 176.9167 | 297 |
| Mar-2013 | 183.9167 | 139 |
| Apr-2013 | 192.5 | 194 |
| May-2013 | 202.1667 | 225 |
| Jun-2013 | 202.8333 | 172 |
| Jul-2013 | 207.25 | 162 |
| Aug-2013 | 207.5833 | 213 |
| Sep-2013 | 207.1667 | 168 |
| Oct-2013 | 216.9167 | 235 |
| Nov-2013 | 204.3333 | 303 |
| Dec-2013 | 195.9167 | 124 |
| Jan-2014 | 184.3333 | 119 |
| Feb-2014 | 194.5 | 158 |
| Mar-2014 | 201.8333 | 261 |
| Apr-2014 | 201 | 282 |
| May-2014 | 208.9167 | 215 |
| Jun-2014 | 215.75 | 267 |
| Jul-2014 | 217.25 | 244 |
| Aug-2014 | 223 | 231 |
| Sep-2014 | 219.25 | 237 |
| Oct-2014 | 221 | 190 |
| Nov-2014 | 233.9167 | 324 |
| Dec-2014 | 241.8333 | 279 |
| Jan-2015 | 249.6667 | 214 |
| Feb-2015 | 235.4167 | 252 |
| Mar-2015 | 232 | 90 |
| Apr-2015 | 235.4167 | 241 |
| May-2015 | 232 | 256 |
| Jun-2015 | 232.0833 | 226 |
| Jul-2015 | 223.0833 | 245 |
| Aug-2015 | 216.8333 | 123 |
| Sep-2015 | 226.3333 | 162 |
| Oct-2015 | 222.5833 | 304 |
| Nov-2015 | 220.25 | 279 |
| Dec-2015 | 215.5833 | 251 |
| Jan-2016 | 215.8 | 158 |

Source: Bureau of Labor Statistics, Current Employment Statistics
This is strong evidence that the committee’s view of the relationship between rule-making and the performance of the economy is wrong. By the committee’s theory, as additional regulations are issued, job growth should shrink, yet private-sector jobs have lately been growing at the fastest pace in 20 years.
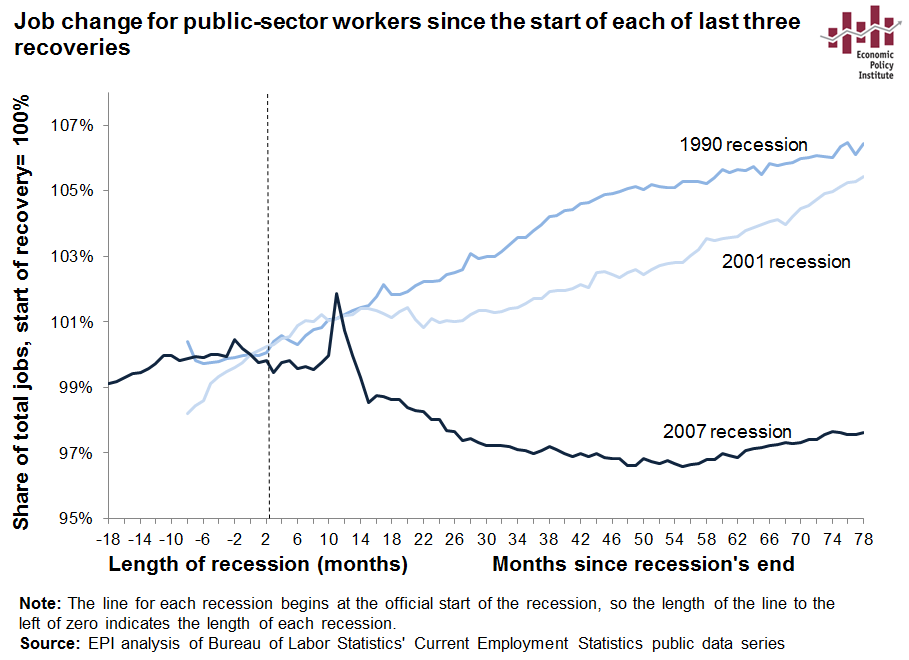
Of course, there is a sector of the economy that has been extraordinarily weak in the current recovery. The public sector in this recovery has badly lagged previous recoveries in the pace of job growth (as shown in Figure 4 below). In fact, public-sector austerity overall (both direct employment of workers and in transfer payments and investments) can probably explain the entirety of why we have gone so long following the Great Recession without a full economic recovery.
The business lobby’s argument that regulations are inherently job-killing typically relies on vague, incomplete, or plainly one-sided evidence. For example, recent American Action Forum (AFF) testimony attributes a loss of fossil-fuel plant jobs, which have declined by 28 percent since 2008, to some degree to Environmental Protection Agency (EPA) rules (though the report admits, “There are other factors at work, namely the rise in renewable energy and the Great Recession”).1 AAF fails to mention, however, that renewable energy jobs have increased faster than fossil-fuel plant jobs have been lost. As the Solar Foundation reports, the solar industry alone, just one component of renewables, “continues to exceed growth expectations, adding workers at a rate nearly 12 times faster than the overall economy and accounting for 1.2% of all jobs created in the U.S. over the past year. Our long-term research shows that solar industry employment has grown by 123% in the past six years, resulting in nearly 115,000 domestic living-wage jobs.”2
McClatchy reported in April of last year that other renewables are growing fast, too.3 Researchers at Duke University, using data from renewable-energy trade associations, estimate in a new study published in the journal Energy Policy that more than 79,000 direct and spinoff jobs were created from wind and solar electricity generation between 2008 and 2012.4 That compares with an estimate of about 49,530 coal industry job losses, according to the study. While natural gas was the biggest winner in creating jobs for electricity generation, with almost 95,000 jobs created in that time, it’s clear renewable energy has been on the rise in the United States.
This highlights that the same regulations that put downward pressure on (some) fossil-fuel generation employment also provide incentives to invest in renewables and energy efficiency. This means that the net employment impacts of many regulations will be small (because there are cross-cutting effects), and that the result is often net positive job creation.
My own research into a couple of EPA rules, including a study of EPA’s Clean Power Plan rule, indicates that by 2020 the rule will have helped create 360,000 net new jobs.5 The boost to job growth moderates over the longer term (as the rule will mostly “pull forward” investments in renewables and energy efficiency that likely would have been made anyhow, just a bit further in the future). But this boost remains positive even in 2030.
This is not to suggest that the rule won’t be disruptive to specific communities. Thousands of jobs in coal-fired utilities will be lost, as will coal mining jobs and jobs in some sectors (transportation of coal, for example) that supply inputs to these industries. If the argument is that some regulations with net benefits should be accompanied by measures (for example, direct fiscal relief to negatively affected communities) to ensure that that no specific set of workers or industries bear a disproportionate burden of the gross costs, then that’s a reasonable and necessary argument to make.
But, of course, the actual argument made by many opponents of regulation is instead a simple statement that regulations just “kill jobs.” On net, they generally don’t.
To its credit, even though it has been an unrelenting critic of the Obama administration, the AAF in its testimony admits that the evidence of regulatory job loss is not strong, indicating only small impacts at the industry level and no clear impacts at the national level: “The general consensus is regulation does have an effect on employment, at least at the industry level. Generally, statistically significant results show small impacts on employment, but these figures can hide a real human component behind the cost of losing one’s job. More research is needed in this field…”
Even researchers at the quite conservative Mercatus Center have thrown cold water on the notion that federal regulations are a drag on the economy. In a recent report, using a database that attempts to measure the extent to which regulations constrict the freedom of business to operate, Nathan Goldschlag and Alexander Tabarrok found no correlation between the increasing stringency of federal regulation and the economic dynamism of U.S. businesses.6
The three authors of an important collection of essays on the impact of regulations on wages and employment recently summed up their research and findings: “We agree that economic theory does not provide a clear prediction for whether any particular regulation will have positive or negative net impacts on employment.”7
Wage-growth is indeed very weak—but regulatory retreat is a contributor to this
While job growth over the current recovery has been consistent and positive, wage growth, on the other hand, has indeed been weak. But again, the hand of a historically recent regulatory onslaught as the culprit here is awfully hard to see in the data.
For one thing, the weak growth of wages is not a new trend. It is unfortunately a trend that began late in the Carter administration and accelerated in the Reagan-Bush years. In fact, since 1979, inflation-adjusted wages grew across the board only during a brief period late in the Clinton administration when the economy attained something close to full employment (4.1 percent unemployment on average for two full years in 1999 and 2000).8
And again, the hand of regulatory burdens in holding down wages is hard to see. Besides the healthy profitability documented before, the other avenue through which regulatory burdens could conceivably harm workers is by slowing the pace of economy-wide productivity growth. Productivity is the average amount of income and output generated in an hour of work in the economy. In the long run, it provides the ceiling on potential living standards growth. But this ceiling has been far out of reach for the vast majority of American workers in recent decades, as the wages of the bottom 80 percent of workers have not grown anywhere close to the pace of economy-wide productivity growth, as shown in Figure 5 below.
Workers' pay is no longer rising along with productivity: Growth in economy-wide productivity and a typical worker's hourly compensation, 1948–2014
| Year | Hourly compensation | Net productivity |
|---|---|---|
| 1948 | 0.0% | 0.0% |
| 1949 | 6.3% | 1.5% |
| 1950 | 10.5% | 9.3% |
| 1951 | 11.8% | 12.3% |
| 1952 | 15.0% | 15.6% |
| 1953 | 20.8% | 19.5% |
| 1954 | 23.5% | 21.6% |
| 1955 | 28.7% | 26.5% |
| 1956 | 33.9% | 26.7% |
| 1957 | 37.1% | 30.1% |
| 1958 | 38.2% | 32.8% |
| 1959 | 42.5% | 37.6% |
| 1960 | 45.5% | 40.0% |
| 1961 | 48.0% | 44.3% |
| 1962 | 52.5% | 49.8% |
| 1963 | 55.0% | 55.0% |
| 1964 | 58.5% | 60.0% |
| 1965 | 62.5% | 64.9% |
| 1966 | 64.9% | 70.0% |
| 1967 | 66.9% | 72.0% |
| 1968 | 70.7% | 77.2% |
| 1969 | 74.7% | 77.9% |
| 1970 | 76.6% | 80.4% |
| 1971 | 82.0% | 87.1% |
| 1972 | 91.2% | 92.0% |
| 1973 | 91.3% | 96.7% |
| 1974 | 87.0% | 93.7% |
| 1975 | 86.8% | 97.9% |
| 1976 | 89.7% | 103.4% |
| 1977 | 93.1% | 105.8% |
| 1978 | 96.0% | 107.8% |
| 1979 | 93.4% | 108.1% |
| 1980 | 88.6% | 106.6% |
| 1981 | 87.6% | 111.0% |
| 1982 | 87.8% | 107.9% |
| 1983 | 88.3% | 114.1% |
| 1984 | 86.9% | 119.7% |
| 1985 | 86.3% | 123.4% |
| 1986 | 87.3% | 128.0% |
| 1987 | 84.6% | 129.1% |
| 1988 | 83.9% | 131.8% |
| 1989 | 83.7% | 133.6% |
| 1990 | 82.2% | 137.0% |
| 1991 | 81.9% | 138.9% |
| 1992 | 83.0% | 147.5% |
| 1993 | 83.4% | 148.4% |
| 1994 | 83.8% | 150.7% |
| 1995 | 82.7% | 150.8% |
| 1996 | 82.8% | 156.9% |
| 1997 | 84.8% | 160.5% |
| 1998 | 89.2% | 165.7% |
| 1999 | 91.9% | 172.1% |
| 2000 | 92.9% | 178.5% |
| 2001 | 95.6% | 182.9% |
| 2002 | 99.5% | 190.7% |
| 2003 | 101.6% | 200.2% |
| 2004 | 101.0% | 208.3% |
| 2005 | 100.0% | 213.6% |
| 2006 | 100.2% | 215.6% |
| 2007 | 101.7% | 217.8% |
| 2008 | 101.8% | 218.3% |
| 2009 | 109.7% | 224.9% |
| 2010 | 111.5% | 234.4% |
| 2011 | 109.1% | 234.8% |
| 2012 | 107.3% | 236.6% |
| 2013 | 108.3% | 236.9% |
| 2014 | 109.0% | 238.7% |
Note: Data are for average hourly compensation of production/nonsupervisory workers in the private sector and net productivity of the total economy. "Net productivity" is the growth of output of goods and services minus depreciation per hour worked.
Source: Adapted from Figure A in Josh Bivens and Lawrence Mishel, Understanding the Historic Divergence Between Productivity and a Typical Worker’s Pay: Why It Matters and Why It’s Real, EPI Briefing Paper #406, September 2, 2015
It is this growing wedge between productivity growth and wages for the vast majority, rather than the deceleration of overall productivity growth, that has been the primary force throttling wage growth. And this wedge has been the result of policy efforts aimed at shifting economic leverage away from low- and middle-wage workers and towards capital-owners and corporate managers. Productivity improvements used to be shared with employees, but in recent decades, owners of firms and top managers have resisted broad-based pay increases, and the traditional leverage mechanisms used by low- and moderate-wage workers to compel these raises—collective bargaining and strikes, minimum wage increases, tight labor markets—have been weakened or eliminated by policy choices.
Most attempts to improve the compensation of workers are met with the same response from employers, that “higher costs will make businesses less competitive.” Under that thinking, wages would never go up, unless entire industries coordinated and firms all raised their wages together. In fact, that kind of coordination, where every business is affected equally, is exactly the phenomenon that occurs when government forces wage increases by raising the minimum wage.
The result of the policy onslaught to shift economic leverage away from low- and middle-wage workers—to allow businesses to indulge their perennial reluctance to raise wages—is the staggering rise in inequality we’ve seen. The specifics of this policy campaign to shift economic power away from low- and middle-wage workers are identified—and solutions to reverse this shift detailed—in the Economic Policy Institute’s Agenda to Raise America’s Pay. A summary of the agenda is provided below, but one thing to note here is that overregulation is not on this list. In fact, the retreat of regulations that kept the playing field level between rank-and-file workers on one hand and capital-owners and top managers on the other hand, is actually part of the story. The erosion of the purchasing power of the federal minimum wage is one such regulatory retreat. Another example is the failure to update for the impact of inflation the salary threshold that ensures protection under overtime regulations. Yes another is the failure to keep employers from adopting ever more aggressive (and often illegal) attempts to fight efforts by workers to form a union, or even to simply collect the wages they have already earned.
The proof of the effectiveness of this strategy to shift economic power from the bottom and middle to the top is in the wage-trends graph below, Figure 6. Annual earnings for the top 1 percent of wage-earners rose by about 150 percent between 1979 and 2014, nine times faster than annual earnings for the bottom 90 percent, which (buoyed a bit by longer hours worked by this group over time) rose by just 17 percent over this period.
Cumulative percent change in real annual wages, by wage group, 1979–2014
| Year | Bottom 90% | 90th–95th | 95th–99th | Top 1% |
|---|---|---|---|---|
| 1979 | 0.0% | 0.0% | 0.0% | 0.0% |
| 1980 | -2.2% | -1.3% | -0.2% | 3.4% |
| 1981 | -2.6% | -1.1% | -0.1% | 3.1% |
| 1982 | -3.9% | -0.9% | 2.2% | 9.5% |
| 1983 | -3.7% | 0.7% | 3.6% | 13.6% |
| 1984 | -1.8% | 2.5% | 6.0% | 20.7% |
| 1985 | -1.0% | 4.0% | 8.1% | 23.0% |
| 1986 | 1.1% | 6.4% | 12.5% | 32.6% |
| 1987 | 2.1% | 7.4% | 15.0% | 53.5% |
| 1988 | 2.2% | 8.2% | 18.4% | 68.7% |
| 1989 | 1.8% | 8.1% | 18.2% | 63.3% |
| 1990 | 1.1% | 7.1% | 16.5% | 64.8% |
| 1991 | 0.0% | 6.9% | 15.5% | 53.6% |
| 1992 | 1.5% | 9.0% | 19.2% | 74.3% |
| 1993 | 0.9% | 9.2% | 20.6% | 67.9% |
| 1994 | 2.0% | 11.2% | 21.0% | 63.4% |
| 1995 | 2.8% | 12.2% | 24.1% | 70.2% |
| 1996 | 4.1% | 13.6% | 27.0% | 79.0% |
| 1997 | 7.0% | 16.9% | 32.3% | 100.6% |
| 1998 | 11.0% | 21.3% | 38.2% | 113.1% |
| 1999 | 13.2% | 25.0% | 42.9% | 129.7% |
| 2000 | 15.3% | 26.8% | 48.0% | 144.8% |
| 2001 | 15.7% | 29.0% | 46.4% | 130.4% |
| 2002 | 15.6% | 29.0% | 43.2% | 109.3% |
| 2003 | 15.7% | 30.3% | 44.9% | 113.9% |
| 2004 | 15.6% | 30.8% | 47.1% | 127.2% |
| 2005 | 15.0% | 30.8% | 48.7% | 135.3% |
| 2006 | 15.7% | 32.5% | 52.1% | 143.4% |
| 2007 | 16.7% | 34.1% | 55.4% | 156.2% |
| 2008 | 16.0% | 34.2% | 53.8% | 137.5% |
| 2009 | 16.0% | 35.3% | 53.5% | 116.2% |
| 2010 | 15.2% | 35.7% | 55.7% | 130.9% |
| 2011 | 14.6% | 36.2% | 56.9% | 134.1% |
| 2012 | 14.7% | 36.4% | 58.4% | 148.5% |
| 2013 | 15.2% | 37.2% | 59.5% | 137.6% |
| 2014 | 16.7% | 38.9% | 62.6% | 149.4% |
This fracturing of economic outcomes has been particularly pronounced during the recent recovery, as workers’ bargaining power has shown no sign of recovering at all from the damage wrought by the Great Recession. The share of corporate-sector income going to labor compensation rather than corporate profits reached historic lows during the recovery and has recovered only slightly from those lows in recent quarters (as shown below in Figure 7).
The decline in labor’s share of corporate income since 2000 means $535 billion less for workers: Share of corporate-sector income received by workers over recent business cycles, 1979–2015
| Labor share | |
|---|---|
| Jan-1979 | 79.0% |
| Apr-1979 | 79.5% |
| Jul-1979 | 80.2% |
| Oct-1979 | 80.8% |
| Jan-1980 | 81.2% |
| Apr-1980 | 82.7% |
| Jul-1980 | 81.9% |
| Oct-1980 | 80.6% |
| Jan-1981 | 80.3% |
| Apr-1981 | 80.4% |
| Jul-1981 | 79.6% |
| Oct-1981 | 80.5% |
| Jan-1982 | 81.6% |
| Apr-1982 | 81.0% |
| Jul-1982 | 81.0% |
| Oct-1982 | 81.4% |
| Jan-1983 | 81.0% |
| Apr-1983 | 79.9% |
| Jul-1983 | 79.4% |
| Oct-1983 | 79.1% |
| Jan-1984 | 77.8% |
| Apr-1984 | 78.0% |
| Jul-1984 | 78.5% |
| Oct-1984 | 78.3% |
| Jan-1985 | 78.4% |
| Apr-1985 | 78.6% |
| Jul-1985 | 78.2% |
| Oct-1985 | 79.6% |
| Jan-1986 | 79.9% |
| Apr-1986 | 80.8% |
| Jul-1986 | 81.5% |
| Oct-1986 | 81.8% |
| Jan-1987 | 81.7% |
| Apr-1987 | 80.9% |
| Jul-1987 | 80.4% |
| Oct-1987 | 80.9% |
| Jan-1988 | 80.9% |
| Apr-1988 | 80.9% |
| Jul-1988 | 80.8% |
| Oct-1988 | 80.2% |
| Jan-1989 | 80.6% |
| Apr-1989 | 80.9% |
| Jul-1989 | 80.9% |
| Oct-1989 | 81.9% |
| Jan-1990 | 81.8% |
| Apr-1990 | 81.6% |
| Jul-1990 | 82.7% |
| Oct-1990 | 83.1% |
| Jan-1991 | 82.2% |
| Apr-1991 | 82.5% |
| Jul-1991 | 82.8% |
| Oct-1991 | 83.3% |
| Jan-1992 | 83.0% |
| Apr-1992 | 83.1% |
| Jul-1992 | 83.6% |
| Oct-1992 | 83.0% |
| Jan-1993 | 83.5% |
| Apr-1993 | 82.7% |
| Jul-1993 | 82.7% |
| Oct-1993 | 81.4% |
| Jan-1994 | 81.4% |
| Apr-1994 | 81.3% |
| Jul-1994 | 80.6% |
| Oct-1994 | 80.3% |
| Jan-1995 | 80.6% |
| Apr-1995 | 80.4% |
| Jul-1995 | 79.5% |
| Oct-1995 | 79.7% |
| Jan-1996 | 79.1% |
| Apr-1996 | 79.1% |
| Jul-1996 | 79.2% |
| Oct-1996 | 79.3% |
| Jan-1997 | 79.0% |
| Apr-1997 | 78.9% |
| Jul-1997 | 78.3% |
| Oct-1997 | 78.5% |
| Jan-1998 | 79.9% |
| Apr-1998 | 79.9% |
| Jul-1998 | 79.8% |
| Oct-1998 | 80.4% |
| Jan-1999 | 80.3% |
| Apr-1999 | 80.6% |
| Jul-1999 | 81.0% |
| Oct-1999 | 81.4% |
| Jan-2000 | 81.8% |
| Apr-2000 | 81.9% |
| Jul-2000 | 82.4% |
| Oct-2000 | 83.1% |
| Jan-2001 | 83.1% |
| Apr-2001 | 82.8% |
| Jul-2001 | 83.0% |
| Oct-2001 | 84.0% |
| Jan-2002 | 82.0% |
| Apr-2002 | 81.8% |
| Jul-2002 | 81.8% |
| Oct-2002 | 80.9% |
| Jan-2003 | 80.3% |
| Apr-2003 | 80.1% |
| Jul-2003 | 79.8% |
| Oct-2003 | 79.9% |
| Jan-2004 | 78.8% |
| Apr-2004 | 78.7% |
| Jul-2004 | 78.6% |
| Oct-2004 | 78.5% |
| Jan-2005 | 77.0% |
| Apr-2005 | 76.9% |
| Jul-2005 | 77.2% |
| Oct-2005 | 76.0% |
| Jan-2006 | 75.5% |
| Apr-2006 | 75.4% |
| Jul-2006 | 74.7% |
| Oct-2006 | 76.1% |
| Jan-2007 | 77.3% |
| Apr-2007 | 76.9% |
| Jul-2007 | 78.3% |
| Oct-2007 | 79.4% |
| Jan-2008 | 79.8% |
| Apr-2008 | 79.7% |
| Jul-2008 | 80.1% |
| Oct-2008 | 83.7% |
| Jan-2009 | 79.8% |
| Apr-2009 | 79.4% |
| Jul-2009 | 78.4% |
| Oct-2009 | 77.4% |
| Jan-2010 | 76.4% |
| Apr-2010 | 76.7% |
| Jul-2010 | 74.9% |
| Oct-2010 | 74.9% |
| Jan-2011 | 77.1% |
| Apr-2011 | 76.0% |
| Jul-2011 | 76.0% |
| Oct-2011 | 74.2% |
| Jan-2012 | 74.6% |
| Apr-2012 | 74.2% |
| Jul-2012 | 73.9% |
| Oct-2012 | 74.6% |
| Jan-2013 | 74.3% |
| Apr-2013 | 74.3% |
| Jul-2013 | 74.7% |
| Oct-2013 | 74.6% |
| Jan-2014 | 76.4% |
| Apr-2014 | 75.0% |
| Jul-2014 | 74.1% |
| Oct-2014 | 75.0% |
| Jan-2015 | 75.7% |
| Apr-2015 | 75.5% |
Note: Shaded areas denote recessions. Federal Reserve banks' corporate profits were netted out in the calculation of labor share.
Source: EPI analysis of Bureau of Economic Analysis National Income and Product Accounts (Tables 1.14 and 6.16D)
The wage problems of the vast majority of American workers are real—and they deserve a real response that is backed by evidence. Blaming these wage problems on a relatively recent alleged regulatory onslaught is not a serious or real response, instead it seems like a calculated distraction. Separating real from fake responses to the problem of anemic hourly pay increases is precisely why the Economic Policy Institute launched its Raising America’s Pay project.
Policies that will actually work to boost American wages
As EPI’s Agenda to Raise America’s Pay explains, policies that will actually work to boost the hourly pay of the vast majority of American workers fall into three areas.9
Section 1: Labor market institutions, labor standards, and business practices
Raise the minimum wage.
In 2015, the inflation-adjusted minimum wage is about 25 percent below what it was in 1968—even though productivity has doubled and the education and skills of those in the bottom fifth have greatly improved. Moving the minimum wage to $12 by 2020 would benefit about a third of the workforce directly or indirectly.
Update overtime rules.
The share of salaried workers eligible for overtime has fallen from about 60 percent in 1979 to just 11 percent today. This is largely because only those earning less than $23,660 (a poverty-level wage) are covered by the Fair Labor Standards Act regardless of their workplace duties.
Fortunately, President Obama has instructed the Department of Labor to revise this salary threshold. If we move the threshold to the value it held in 1975—roughly $51,000 today—we would strengthen overtime protections for 13.5 million workers. This would provide them with higher pay and/or more leisure time, while providing incentives for companies to hire more workers.
Strengthen collective bargaining rights.
The single largest factor suppressing wage growth for middle-wage workers over the last few decades has been the erosion of collective bargaining, which has affected both union and nonunion workers alike. Making it easier for willing workers to form unions, increasing penalties for corporate violations of labor laws, and halting and reversing the spread of so-called right-to-work laws will help give workers the leverage they need to bargain for better wages and benefits and set high labor standards for all workers.
Regularize and extend labor protections to undocumented workers.
Undocumented workers are vulnerable to exploitation by unscrupulous employers. Consequently, they earn lower wages than workers who have greater access to legal protections and are able to switch jobs more readily. President Obama’s executive actions to provide work authorization to undocumented workers, and comprehensive immigration reform that in addition provides them a path to citizenship, are polices that will provide these workers with basic workplace protections and enable them to earn higher wages. Regularizing undocumented workers will not only lift their wages, but will also lift wages of U.S. workers in the same fields of work.
Provide earned sick leave and paid family leave.
The United States has failed to adopt new labor standards that respond to emerging needs. In particular, we need updated standards to assist workers and their families in achieving a better balance between work and family. Providing earned sick leave and paid family leave would help to raise workers’ pay—and would give them more economic security.
End discriminatory practices that contribute to race and gender inequalities.
Generating broader-based wage growth must also include efforts to close race and gender inequities that have been ever-present in our labor market. We need consistently strong enforcement of antidiscrimination laws in the hiring, promotion, and pay of women and minority workers. This includes greater transparency in the ways these decisions are made and ensuring that the processes available for workers to pursue any violation of their rights are effective.
Support strong enforcement of labor standards.
The enforcement of labor standards in the United States is so weak that hundreds of thousands of employers routinely fail to pay minimum wage or overtime, fail to protect employees from workplace hazards, fail to pay payroll taxes or worker’s compensation premiums, or fail to provide family and medical leave. Wage theft alone costs employees tens of billions of dollars a year, and lack of worker’s compensation coverage, unemployment insurance coverage, or Social Security coverage can cost them billions more. More enforcement and tougher penalties are needed to deter these violations, and access to the courts must be available to injured workers. Employers’ growing use of forced arbitration—where employees, as a condition of employment, give up their right to sue in the public courts and are shunted into secret, private proceedings that can both be more costly and provide poorer remedies—must be stopped and reversed. As government enforcement resources decline, it is vital that workers have effective remedies in state and federal courts for labor standards violations.
Section 2: Restore full employment as primary policy target
A necessary condition for ending wage suppression is economic policy that ensures every worker who wants a job can find one. The reason for this is simple. In the absence of full employment, employers do not need to offer significant wage increases to attract and retain employees, as the number of willing workers is far greater than the number of available jobs. To restore full employment and raise America’s pay, policymakers should:
Prioritize very low rates of unemployment when making monetary policy.
Federal Reserve Board policymakers are now considering whether and how fast to continue raising interest rates throughout 2016. In essence, a decision to raise interest rates is a decision to slow the economy and weaken job and wage growth. Given that wages have stagnated and that many communities have yet to adequately benefit from the recovery, it is imperative that monetary policymakers keep their foot off the brakes and allow the recovery to proceed as quickly as possible. Policymakers should not seek to slow the economy until growth of nominal wages (wages unadjusted for inflation) is running comfortably above 3.5 percent (which is consistent with ongoing productivity growth of 1.5 percent and a target inflation rate of 2 percent).
Enact targeted employment programs and undertake public investments in infrastructure to create jobs.
To obtain full employment for all, we need policies that can direct jobs to particular areas that suffer from high unemployment even when the national labor market is largely healthy. These policies can include public and nonprofit employment programs that create jobs by meeting unmet needs. Additionally, undertaking a sustained (for at least a decade) program of public investment can create jobs, raise our productivity, and spur economic growth.
Reduce our trade deficit by stopping destructive currency management by trading partners.
Many of our major trading partners engage in intentional currency management —buying up dollar-denominated assets on global financial markets simply to depress the value of their own currency. This depressed currency value makes imports cheaper in the U.S. market and U.S. exports more expensive. This results in a larger trade deficit and slower job growth. Eliminating currency management could reduce the U.S. global trade deficit by between $200 billion and $500 billion each year, which could increase overall U.S. GDP by between $288 billion and $720 billion and create between 2.3 million and 5.8 million U.S. jobs. Congress and the president should reject any trade treaties that do not have enforceable provisions to combat currency management.
Section 3: Reining in the economic leverage of the top 1 percent
A final piece of the puzzle for raising wages for the vast majority is to restrain the growth of top 1 percent incomes. The major forces behind the doubling of the top 1 percent’s income share since 1979 have been the expansion of the finance sector (and escalating pay in that sector) and the remarkable growth of executive pay. Economic research indicates that the increased incomes in finance and for executives do not reflect a corresponding increase in their efficiency. Rather, they are simply a zero-sum redistribution away from the rest of the economy and toward finance and corporate managers. Restraining the growth of such income will not adversely affect the size of our economy. It will instead allow the vast majority to claim a larger share of economic growth. To raise wages for the vast majority, policymakers should:
Use the tax code to restrain top 1 percent incomes.
Tax preferences for executive pay can be eliminated or their use tied to the executive’s firm giving wage increases equal to productivity growth. Others have recommended tying corporate tax rates to the ratio of executive pay to median worker pay, as well as changes to corporate governance procedures. Additionally, imposing a financial transactions tax can steer investments toward productive uses and away from speculation, and restrain unproductive financial activity and pay. Finally, higher top marginal tax rates can reduce the incentive for financial-sector professionals and corporate managers to rig markets or suppress wage growth to make more income flow their way.
Endnotes
1. American Action Forum, “How the Administration’s Regulatory Onslaught is Affecting Workers and Job Creators,” Testimony, December 9, 2015.
2. The Solar Foundation, National Solar Jobs Census 2015.
3. Sean Cockerham, “Green Energy Job Growth Outpaces Losses in Coal Industry,” McClatchy Washington Bureau, April 21, 2015.
4. Drew Haerer and Lincoln Pratson, “Employment Trends in the U.S. Electricity Sector, 2008–2012,” Energy Policy, vol. 82, July 2015.
5. Josh Bivens, A Comprehensive Analysis of the Employment Impacts of the EPA’s Proposed Clean Power Plan, Economic Policy Institute, 2015.
6. Nathan Goldschlag and Alexander T. Tabarrok, Is Regulation to Blame for the Decline in American Entrepreneurship? George Mason University Working Paper in Economics No. 15-11, December 2014.
7. Christopher Carrigan, Cary Coglianese, and Adam M. Finkel, “Public Interest Comment on the Office of Management and Budget’s 2014 Draft Report to Congress on the Benefits and Costs of Federal Regulations and Unfunded Mandates on State, Local and Tribal Entities, September, 2014.
8. Lawrence Mishel, Josh Bivens, Elise Gould, and Heidi Shierholz, The State of Working America, 12th Edition, Economic Policy Institute and Cornell University Press, 2012.
9. Economic Policy Institute, “The Agenda to Raise America’s Pay,” 2015.