Increasing Labor Force Participation Leads to Fewer Missing Workers
The official unemployment rate ticked up slightly last month as more potential workers entered the labor force. While is it a positive sign that more people are actively looking for work, the unemployment rate still understates the weakness of job opportunities. This is due to the existence of a large pool of “missing workers”—potential workers who, because of weak job opportunities, are neither employed nor actively seeking a job. In other words, these are people who would be either working or looking for work if job opportunities were significantly stronger.
The number of missing workers has been hovering around 6 million for over a year. They fell slightly in January, which could be the start of a positive trend. As the economy gets stronger, I would expect more people to start looking for work. At this point, the fact remains that there are still 5.8 million missing workers. And, if the missing workers were actively looking for work, the unemployment rate would be 9.0 percent.
Millions of potential workers sidelined: Missing workers,* January 2006–January 2015
| Date | Missing workers |
|---|---|
| 2006-01-01 | 530,000 |
| 2006-02-01 | 110,000 |
| 2006-03-01 | 110,000 |
| 2006-04-01 | 250,000 |
| 2006-05-01 | 210,000 |
| 2006-06-01 | 110,000 |
| 2006-07-01 | 60,000 |
| 2006-08-01 | -120,000 |
| 2006-09-01 | 120,000 |
| 2006-10-01 | -50,000 |
| 2006-11-01 | -220,000 |
| 2006-12-01 | -500,000 |
| 2007-01-01 | -460,000 |
| 2007-02-01 | -210,000 |
| 2007-03-01 | -150,000 |
| 2007-04-01 | 650,000 |
| 2007-05-01 | 560,000 |
| 2007-06-01 | 360,000 |
| 2007-07-01 | 370,000 |
| 2007-08-01 | 840,000 |
| 2007-09-01 | 410,000 |
| 2007-10-01 | 800,000 |
| 2007-11-01 | 280,000 |
| 2007-12-01 | 250,000 |
| 2008-01-01 | -320,000 |
| 2008-02-01 | 220,000 |
| 2008-03-01 | 50,000 |
| 2008-04-01 | 340,000 |
| 2008-05-01 | -60,000 |
| 2008-06-01 | 20,000 |
| 2008-07-01 | -70,000 |
| 2008-08-01 | -90,000 |
| 2008-09-01 | 180,000 |
| 2008-10-01 | 60,000 |
| 2008-11-01 | 420,000 |
| 2008-12-01 | 420,000 |
| 2009-01-01 | 710,000 |
| 2009-02-01 | 620,000 |
| 2009-03-01 | 1,050,000 |
| 2009-04-01 | 750,000 |
| 2009-05-01 | 650,000 |
| 2009-06-01 | 650,000 |
| 2009-07-01 | 1,040,000 |
| 2009-08-01 | 1,320,000 |
| 2009-09-01 | 2,050,000 |
| 2009-10-01 | 2,270,000 |
| 2009-11-01 | 2,300,000 |
| 2009-12-01 | 3,120,000 |
| 2010-01-01 | 2,770,000 |
| 2010-02-01 | 2,690,000 |
| 2010-03-01 | 2,440,000 |
| 2010-04-01 | 1,940,000 |
| 2010-05-01 | 2,530,000 |
| 2010-06-01 | 2,950,000 |
| 2010-07-01 | 3,220,000 |
| 2010-08-01 | 2,830,000 |
| 2010-09-01 | 3,200,000 |
| 2010-10-01 | 3,640,000 |
| 2010-11-01 | 3,310,000 |
| 2010-12-01 | 3,800,000 |
| 2011-01-01 | 3,910,000 |
| 2011-02-01 | 4,110,000 |
| 2011-03-01 | 3,960,000 |
| 2011-04-01 | 4,000,000 |
| 2011-05-01 | 4,110,000 |
| 2011-06-01 | 4,220,000 |
| 2011-07-01 | 4,640,000 |
| 2011-08-01 | 4,100,000 |
| 2011-09-01 | 3,990,000 |
| 2011-10-01 | 4,090,000 |
| 2011-11-01 | 4,090,000 |
| 2011-12-01 | 4,150,000 |
| 2012-01-01 | 4,450,000 |
| 2012-02-01 | 4,180,000 |
| 2012-03-01 | 4,240,000 |
| 2012-04-01 | 4,630,000 |
| 2012-05-01 | 4,240,000 |
| 2012-06-01 | 4,060,000 |
| 2012-07-01 | 4,520,000 |
| 2012-08-01 | 4,630,000 |
| 2012-09-01 | 4,500,000 |
| 2012-10-01 | 3,930,000 |
| 2012-11-01 | 4,370,000 |
| 2012-12-01 | 4,070,000 |
| 2013-01-01 | 4,350,000 |
| 2013-02-01 | 4,790,000 |
| 2013-03-01 | 5,310,000 |
| 2013-04-01 | 5,060,000 |
| 2013-05-01 | 4,840,000 |
| 2013-06-01 | 4,700,000 |
| 2013-07-01 | 5,030,000 |
| 2013-08-01 | 5,150,000 |
| 2013-09-01 | 5,370,000 |
| 2013-10-01 | 6,120,000 |
| 2013-11-01 | 5,700,000 |
| 2013-12-01 | 5,950,000 |
| 2014-01-01 | 5,850,000 |
| 2014-02-01 | 5,650,000 |
| 2014-03-01 | 5,330,000 |
| 2014-04-01 | 6,210,000 |
| 2014-05-01 | 5,940,000 |
| 2014-06-01 | 5,950,000 |
| 2014-07-01 | 5,810,000 |
| 2014-08-01 | 5,890,000 |
| 2014-09-01 | 6,250,000 |
| 2014-10-01 | 5,720,000 |
| 2014-11-01 | 5,760,000 |
| 2014-12-01 | 6,100,000 |
| 2015-01-01 | 5,760,000 |

* Potential workers who, due to weak job opportunities, are neither employed nor actively seeking work
Note: Volatility in the number of missing workers in 2006–2008, including cases of negative numbers of missing workers, is simply the result of month-to-month variability in the sample. The Great Recession–induced pool of missing workers began to form and grow starting in late 2008.
Source: EPI analysis of Mitra Toossi, “Labor Force Projections to 2016: More Workers in Their Golden Years,” Bureau of Labor Statistics Monthly Labor Review, November 2007; and Current Population Survey public data series
Similarly, we saw a tick up in the employment-to-population ratio for prime-working-age population in January, following a trend that has been slowly moving in the right direction for years. That said, it’s clear that there is a long way to go before we return to pre-recession labor market health.
Employment-to-population ratio of workers ages 25–54, 2006–2015
| Month | Employment to population ratio |
|---|---|
| 2006-01-01 | 79.6% |
| 2006-02-01 | 79.7% |
| 2006-03-01 | 79.8% |
| 2006-04-01 | 79.6% |
| 2006-05-01 | 79.7% |
| 2006-06-01 | 79.8% |
| 2006-07-01 | 79.8% |
| 2006-08-01 | 79.8% |
| 2006-09-01 | 79.9% |
| 2006-10-01 | 80.1% |
| 2006-11-01 | 80.0% |
| 2006-12-01 | 80.1% |
| 2007-01-01 | 80.3% |
| 2007-02-01 | 80.1% |
| 2007-03-01 | 80.2% |
| 2007-04-01 | 80.0% |
| 2007-05-01 | 80.0% |
| 2007-06-01 | 79.9% |
| 2007-07-01 | 79.8% |
| 2007-08-01 | 79.8% |
| 2007-09-01 | 79.7% |
| 2007-10-01 | 79.6% |
| 2007-11-01 | 79.7% |
| 2007-12-01 | 79.7% |
| 2008-01-01 | 80.0% |
| 2008-02-01 | 79.9% |
| 2008-03-01 | 79.8% |
| 2008-04-01 | 79.6% |
| 2008-05-01 | 79.5% |
| 2008-06-01 | 79.4% |
| 2008-07-01 | 79.2% |
| 2008-08-01 | 78.8% |
| 2008-09-01 | 78.8% |
| 2008-10-01 | 78.4% |
| 2008-11-01 | 78.1% |
| 2008-12-01 | 77.6% |
| 2009-01-01 | 77.0% |
| 2009-02-01 | 76.7% |
| 2009-03-01 | 76.2% |
| 2009-04-01 | 76.2% |
| 2009-05-01 | 75.9% |
| 2009-06-01 | 75.9% |
| 2009-07-01 | 75.8% |
| 2009-08-01 | 75.6% |
| 2009-09-01 | 75.1% |
| 2009-10-01 | 75.0% |
| 2009-11-01 | 75.2% |
| 2009-12-01 | 74.8% |
| 2010-01-01 | 75.1% |
| 2010-02-01 | 75.1% |
| 2010-03-01 | 75.1% |
| 2010-04-01 | 75.4% |
| 2010-05-01 | 75.1% |
| 2010-06-01 | 75.2% |
| 2010-07-01 | 75.1% |
| 2010-08-01 | 75.0% |
| 2010-09-01 | 75.1% |
| 2010-10-01 | 75.0% |
| 2010-11-01 | 74.8% |
| 2010-12-01 | 75.0% |
| 2011-01-01 | 75.2% |
| 2011-02-01 | 75.1% |
| 2011-03-01 | 75.3% |
| 2011-04-01 | 75.1% |
| 2011-05-01 | 75.2% |
| 2011-06-01 | 75.0% |
| 2011-07-01 | 75.0% |
| 2011-08-01 | 75.1% |
| 2011-09-01 | 74.9% |
| 2011-10-01 | 74.9% |
| 2011-11-01 | 75.3% |
| 2011-12-01 | 75.4% |
| 2012-01-01 | 75.6% |
| 2012-02-01 | 75.6% |
| 2012-03-01 | 75.7% |
| 2012-04-01 | 75.7% |
| 2012-05-01 | 75.7% |
| 2012-06-01 | 75.7% |
| 2012-07-01 | 75.6% |
| 2012-08-01 | 75.7% |
| 2012-09-01 | 75.9% |
| 2012-10-01 | 76.0% |
| 2012-11-01 | 75.8% |
| 2012-12-01 | 75.9% |
| 2013-01-01 | 75.7% |
| 2013-02-01 | 75.9% |
| 2013-03-01 | 75.9% |
| 2013-04-01 | 75.9% |
| 2013-05-01 | 76.0% |
| 2013-06-01 | 75.9% |
| 2013-07-01 | 76.0% |
| 2013-08-01 | 75.9% |
| 2013-09-01 | 75.9% |
| 2013-10-01 | 75.5% |
| 2013-11-01 | 76.0% |
| 2013-12-01 | 76.1% |
| 2014-01-01 | 76.5% |
| 2014-02-01 | 76.5% |
| 2014-03-01 | 76.6% |
| 2014-04-01 | 76.5% |
| 2014-05-01 | 76.4% |
| 2014-06-01 | 76.8% |
| 2014-07-01 | 76.6% |
| 2014-08-01 | 76.8% |
| 2014-09-01 | 76.8% |
| 2014-10-01 | 76.9% |
| 2014-11-01 | 76.9% |
| 2014-12-01 | 77.0% |
| 2015-01-01 | 77.2% |
Source: EPI analysis of Bureau of Labor Statistics' Current Population Survey public data series.
Much Stronger Job Growth is Needed If We’re Going to See a Healthy Economy Any Time Soon
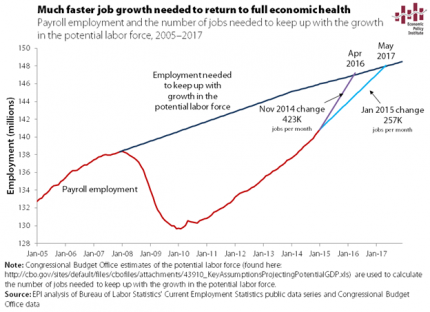
Today’s job report is a solid start to the new year, and could be a sign that the economy has shifted into a slightly higher gear. At 257,000 jobs a month, we would get to pre-recession labor market health by May 2017 (as shown in the figure below).
The BLS revisions to 2014 payroll employment suggest moderately faster growth than initially reported last year, particularly in the last quarter of 2014. If we were to use the highest rate of growth last year—November’s 423,000 jobs added—in each ensuing month, we would return to 2007 labor market health by April 2016, over a year sooner.
There is no reason to expect a much faster growth rate of jobs, but stronger numbers on jobs will hopefully translate into decent wage growth sometime in the foreseeable future. It’s not there yet, but we can only hope.
Nominal Wage Growth Still Far Below Target
This morning’s jobs report showed the economy added 257,000 jobs in January, and the numbers for December and November were revised upward. But even with the positive revisions to 2014 and the solid jobs growth last month, there’s clearly still tremendous slack in the labor market, as evidenced by lagging nominal wage growth. While January’s 0.5 percent jump in wages is a good sign, it’s important not to read too much into any one month, as there’s considerable volatility in the series. Over the year, nominal average hourly earnings have only grown 2.2 percent. From the figure below, it is clear the nominal wage growth has been hovering around 2 percent for the last five years.
It is also apparent from the figure that nominal wages have grown far slower than any reasonable wage target. The fact is that the economy is not growing enough for workers to feel the effects in their paychecks and not enough for the Federal Reserve to slow the economy down out of fear of upcoming inflationary pressure. If the Fed acts too soon, it will slow labor share’s recovery and come at a cost to Americans’ living standards. It is imperative that the Fed keep their foot off the brake for as long as it takes to see modest (if not strong) wage growth for America’s workers.
Nominal wage growth has been far below target in the recovery: Year-over-year change in private-sector nominal average hourly earnings, 2007–2015
| All nonfarm employees | Production/nonsupervisory workers | |
|---|---|---|
| Mar-2007 | 3.6427146% | 4.1112455% |
| Apr-2007 | 3.3234127% | 3.8461538% |
| May-2007 | 3.7257824% | 4.1441441% |
| Jun-2007 | 3.8575668% | 4.1267943% |
| Jul-2007 | 3.4482759% | 4.0524434% |
| Aug-2007 | 3.5433071% | 4.0404040% |
| Sep-2007 | 3.2337090% | 4.1493776% |
| Oct-2007 | 3.2778865% | 3.7780401% |
| Nov-2007 | 3.3203125% | 3.8869258% |
| Dec-2007 | 3.1113272% | 3.8123167% |
| Jan-2008 | 3.1067961% | 3.8619075% |
| Feb-2008 | 3.0464217% | 3.7296037% |
| Mar-2008 | 3.0332210% | 3.7746806% |
| Apr-2008 | 2.8324532% | 3.7037037% |
| May-2008 | 3.0172414% | 3.6908881% |
| Jun-2008 | 2.6666667% | 3.6186100% |
| Jul-2008 | 3.0000000% | 3.7227950% |
| Aug-2008 | 3.2794677% | 3.8263849% |
| Sep-2008 | 3.2747983% | 3.6425726% |
| Oct-2008 | 3.3159640% | 3.9249147% |
| Nov-2008 | 3.5916824% | 3.8548753% |
| Dec-2008 | 3.6303630% | 3.8418079% |
| Jan-2009 | 3.5310734% | 3.7183099% |
| Feb-2009 | 3.4725481% | 3.6516854% |
| Mar-2009 | 3.1775701% | 3.5254617% |
| Apr-2009 | 3.2212885% | 3.2924107% |
| May-2009 | 2.8358903% | 3.0589544% |
| Jun-2009 | 2.7365492% | 2.9379157% |
| Jul-2009 | 2.5889968% | 2.7056875% |
| Aug-2009 | 2.4390244% | 2.6402640% |
| Sep-2009 | 2.2977941% | 2.7457441% |
| Oct-2009 | 2.3383769% | 2.6272578% |
| Nov-2009 | 2.0529197% | 2.6746725% |
| Dec-2009 | 1.8198362% | 2.5027203% |
| Jan-2010 | 1.9554343% | 2.6072787% |
| Feb-2010 | 1.8140590% | 2.4932249% |
| Mar-2010 | 1.7663043% | 2.2702703% |
| Apr-2010 | 1.7639077% | 2.4311183% |
| May-2010 | 1.8987342% | 2.5903940% |
| Jun-2010 | 1.7607223% | 2.4771136% |
| Jul-2010 | 1.8476791% | 2.4731183% |
| Aug-2010 | 1.7070979% | 2.4115756% |
| Sep-2010 | 1.8867925% | 2.2447889% |
| Oct-2010 | 1.8817204% | 2.5066667% |
| Nov-2010 | 1.6540009% | 2.1796917% |
| Dec-2010 | 1.7426273% | 2.0169851% |
| Jan-2011 | 1.9625335% | 2.2233986% |
| Feb-2011 | 1.8262806% | 2.1152829% |
| Mar-2011 | 1.8246551% | 2.1141649% |
| Apr-2011 | 1.9111111% | 2.1097046% |
| May-2011 | 2.0408163% | 2.1041557% |
| Jun-2011 | 2.1295475% | 2.0493957% |
| Jul-2011 | 2.2566372% | 2.2560336% |
| Aug-2011 | 1.9434629% | 1.9884877% |
| Sep-2011 | 1.9400353% | 1.9864088% |
| Oct-2011 | 2.1108179% | 1.7169615% |
| Nov-2011 | 2.0228672% | 1.8210198% |
| Dec-2011 | 1.9762846% | 1.8210198% |
| Jan-2012 | 1.7060367% | 1.3982393% |
| Feb-2012 | 1.9247594% | 1.5018125% |
| Mar-2012 | 2.1416084% | 1.7080745% |
| Apr-2012 | 2.0497165% | 1.7561983% |
| May-2012 | 1.7826087% | 1.4425554% |
| Jun-2012 | 1.9548219% | 1.5447992% |
| Jul-2012 | 1.7741238% | 1.3853258% |
| Aug-2012 | 1.8630849% | 1.3340174% |
| Sep-2012 | 1.9896194% | 1.3839057% |
| Oct-2012 | 1.4642550% | 1.2787724% |
| Nov-2012 | 1.8965517% | 1.4307614% |
| Dec-2012 | 2.1102498% | 1.6351559% |
| Jan-2013 | 2.1505376% | 1.8896834% |
| Feb-2013 | 2.1030043% | 2.0408163% |
| Mar-2013 | 1.8827557% | 1.8829517% |
| Apr-2013 | 1.9658120% | 1.7258883% |
| May-2013 | 2.0504058% | 1.8791265% |
| Jun-2013 | 2.1729868% | 2.0283976% |
| Jul-2013 | 1.9132653% | 1.9736842% |
| Aug-2013 | 2.2118248% | 2.1265823% |
| Sep-2013 | 2.0356234% | 2.1739130% |
| Oct-2013 | 2.2495756% | 2.2727273% |
| Nov-2013 | 2.1573604% | 2.2670025% |
| Dec-2013 | 1.9401097% | 2.3127200% |
| Jan-2014 | 1.9789474% | 2.2055138% |
| Feb-2014 | 2.1017234% | 2.4500000% |
| Mar-2014 | 2.1419572% | 2.2977023% |
| Apr-2014 | 1.9698240% | 2.2954092% |
| May-2014 | 2.0510674% | 2.3928215% |
| Jun-2014 | 1.9599666% | 2.2862823% |
| Jul-2014 | 2.0442219% | 2.2828784% |
| Aug-2014 | 2.1223471% | 2.4789291% |
| Sep-2014 | 1.9950125% | 2.2761009% |
| Oct-2014 | 1.9510170% | 2.2222222% |
| Nov-2014 | 1.9461698% | 2.1674877% |
| Dec-2014 | 1.6549441% | 1.6216216% |
| Jan-2015 | 2.1982742% | 1.9607843% |
* Nominal wage growth consistent with the Federal Reserve Board's 2 percent inflation target, 1.5 percent productivity growth, and a stable labor share of income.
Source: EPI analysis of Bureau of Labor Statistics Current Employment Statistics public data series
What to Watch on Jobs Day: Signs of a Tightening Labor Market?
The economy is slowly recovering from the Great Recession. We saw stronger job growth in 2014 than in 2013 or 2012. In 2015, I hope to see signs of even stronger job growth, pulling the missing workers back into the labor force, and achieving decent, if not strong, wage growth for most. I’ll be looking at these factors when the jobs report comes out tomorrow and throughout the year.
First, jobs growth. If we continue to see the average rate of job growth experienced in 2014, it will be the summer of 2017 when we return to pre-recession labor market health. 2014’s rate of job growth was a positive step, but I’m hoping for even more.
Second, labor force participation. While the unemployment rate continued to fall through 2014, it remains elevated across the population (by age, race, gender, education, sector, occupation)—and even so, it does not reflect the full picture of the labor market. Some of the decline is due to an increase in employment, but some of it is due to a drop in labor force participation. Between November and December 2014, 70 percent of the decline in the number of unemployed people was caused not by workers finding jobs but by people leaving the labor force, or not entering it in the first place.
To better explain this trend, we’ve been tracking what we call the “missing workers.” These are people who have left (or never entered) the labor force, but who would be working or looking for work if job opportunities were significantly more robust. Because jobless workers are only counted as unemployed if they are actively seeking work, these missing workers are not reflected in the official (U3) unemployment rate. We compare today’s labor force participation rate with projections based solely on structural changes in the workforce—like the retiring baby boomers—and find that there are currently 6.1 million missing workers. If these missing workers were actively looking for work, the unemployment rate would be 9.1 percent.
Obama’s Budget: Mostly a Political Document, and That’s Just Fine
This post originally ran on the Wall Street Journal‘s Think Tank blog.
The White House released its annual budget on Monday for fiscal year 2016. On the one hand, this may seem like a low-value exercise, given the dim prospects for its major initiatives passing a Republican-controlled Congress. But on the other hand, the raft of stories written about it prove the president continues to have unrivaled power in setting the terms of policy debate.
And the terms set by the 2016 budget are really useful.
Most of the big-ticket items were previewed: significant increases on tax rates for the highest-income households on income they receive simply from wealth-holdings, higher taxes on large transfers of wealth, tax cuts for low- and middle-income taxpayers, and substantial spending increases on community colleges, early childhood care, and infrastructure.
One item that wasn’t telegraphed by the White House included corporate tax reforms that would impose a minimum 19% tax on foreign earnings of U.S. firms with no opportunity for deferral. This is a very big step in the right direction, if still a little shy of perfect since deferral should be ended and U.S. firms should be taxed at the going corporate income tax rate regardless of where income is earned. But 19% is a lot better than today’s implicit 0% on income held abroad. Further, a large chunk of the budget’s infrastructure proposals is financed by a one-time tax of 14% on accumulated earnings of U.S. corporations held abroad. Again, this is much better than the frequently floated alternative of allowing U.S. firms to repatriate their foreign-held earnings at a preferential rate.
Ideas Good and Not so Good: Infrastructure Investment and Corporate Taxes
President Obama released his fiscal year 2016 budget proposal earlier this week. The proposal is full of good ideas, so-so ideas, and some not so good ideas. One great idea is to devote more money to the Highway Trust Fund for infrastructure investments, which improves job growth now and in the future. At the moment, however, it’s paired with the not-so good idea to pay for it with a mandatory one-time 14 percent tax on the $2 trillion of tax-deferred foreign earnings of U.S. corporations, which would bring in $268 billion over the six years. To be clear, this is an improvement over the other “one-time” corporate tax change often floated to realize a temporary revenue windfall—a full repatriation tax “holiday” for earnings accumulated overseas. So if the Obama proposal is a lot better than a full holiday, what’s the problem? The proposed one-time tax rate is still too low.
The 14 percent one-time tax is a transition tax to the president’s proposal to institute a 19 percent tax on corporate foreign-sourced earnings. Currently, corporate foreign-sourced earnings are subject to the U.S. corporate income tax, but payment of the tax is deferred (i.e., no U.S. taxes are paid at all) until the corporation brings to earnings to the United States (or in the jargon: repatriates the earnings). The earnings are then theoretically taxed at the statutory corporate tax rate of 35 percent, but due to various deductions and tax credits most corporations pay substantially less than the 35 percent rate. It is estimated that firms have stashed away $2 trillion in untaxed earnings overseas. One reason it makes sense for them to stash money overseas is that Congress has in the past offered a repatriation tax “holiday,” which allowed them to repatriate it at hugely preferential rates. And proposals to do this again have been percolating for years, so it makes a lot of sense for multinationals to wait and see if they get another windfall.
This largely explains why the business community, rather than jumping at the chance to face a 14 percent tax rate instead of the 35 percent rate, wants the transition tax rate to be no higher than 5 percent or even lower. Of course they can’t flat-out argue that they’re actually waiting for another pure windfall, so instead they argue the 14 percent rate somehow harms competitiveness, though they don’t explain how. Let’s examine this specious argument.
Firms compete over customers for their products and competitiveness, by its very nature, is forward looking since the past can’t be changed. The tax on income that has already been earned will not affect a firm’s behavior; the accumulated $2 trillion of untaxed income is based on past decisions, which cannot be changed. Consequently, there is no reason to tax this income at a rate less than the statutory corporate tax rate since there is no competitiveness issue. A lower tax rate just rewards firms for the aggressive tax planning that allowed them to accumulate $2 trillion in untaxed earnings.
TPP and Provisions to Stop Currency Management: Not That Hard
As discussions surrounding the proposed Trans-Pacific Partnership (TPP) heat up, there has been a new push to include provisions within the agreement to keep countries from managing the value of their currency for competitive gain vis-à-vis their trading partners. This push got an unexpected (by me, anyhow) boost recently when former U.S. Treasury Secretary and former Obama administration National Economic Council Director Larry Summers called for it (see page 22 in the link).
This currency management is a key cause of persistent U.S. trade deficits, and it is widespread. Given that our trade deficit drags on demand growth, and given that generating sufficient demand to reach full employment is likely to be a key economic problem in coming years, this is an important issue to address. Further, given that U.S. tariffs are extremely low, it’s hard to think of any other issue besides currency management that could possibly matter more for trade flows, so excluding it from the TPP seems odd. And yet many TPP proponents are extremely reluctant to include binding tools to stop currency management in the treaty. There have been many arguments for why the United States can’t or shouldn’t stop currency management, but the latest rationale is pretty novel: the claim is that including a currency chapter in the TPP would let other countries use the provisions of the treaty to stop the Federal Reserve from engaging in expansionary monetary policy. If such a provision had been in effect during the Great Recession, this argument continues, it would have kept the Fed from engaging in the quantitative easing (QE) that it undertook to blunt the recession and spur recovery.
Tying the Fed’s hands like this would indeed be a bad thing, but there’s no reason at all to think one couldn’t define currency management in way that did not constrain the Fed or any other central bank wanting to undertake similar maneuvers.
A Great Idea: End the Sequester
President Obama released his 2016 budget proposal this morning. While president’s budgets are rarely implemented, especially if Congress is controlled by the opposite party, they help to set the agenda for the upcoming legislative year. And this year the president has a great idea that should not be disregarded: ending the sequester.
The president has proposed increasing discretionary spending by over $70 billion, which would effectively put an end to the sequester-induced straight jacket on the budget. Half of the increase would be directed for defense discretionary spending and the other half for nondefense discretionary programs—i.e., the programs that fund public investments. While the proposed spending increase is not enough to meet our actual needs, it is a start.
As a reminder, the sequester is the result of legislation Congress passed and President Obama signed in 2011. At the time, the discretionary caps and sequester were a bad idea; today they are a bad and dangerous idea. This self-imposed austerity was the major factor in the slow recovery from the Great Recession. Recently, Erskine Bowles, a deficit hawk and co-chair of the 2010 National Commission on Fiscal Responsibility and Reform (often called Simpson-Bowles) said “I don’t think it gets any stupider than the sequester.” I agree. Let’s hope the president forcefully pushes Congress to end the stupid sequester.
Sluggish Wage Growth Continues Throughout 2014
Today, the Bureau of Labor Statistics (BLS) released the Employment Cost Index (ECI), a closely watched measure of labor costs, for the last quarter of 2014. Nominal year-over-year compensation for private industry workers rose 2.3 percent, while private sector wages and salaries rose 2.2 percent.
To put these numbers in perspective, below is a chart of the year-over-year changes in both the ECI compensation and wage series along with the monthly BLS Current Employment Statistics (CES) nominal wage series for all nonfarm employees. It’s clear that nominal wage growth (using any of these measures) has been flat for a long time—and there’s little evidence this trend has changed in recent months.
The horizontal shaded area represents growth of 3.5 to 4 percent—nominal wage growth consistent with the Fed’s 2 percent inflation target and a stable labor share of income (given a range of 1.5 to 2 percent trend productivity growth).
We need to see consistent wage growth above this range before there is a hint of upward pressure on prices stemming from too-tight labor markets. Thus, the Fed should not even consider raising interest rates to forestall inflation until wage growth is consistently above this target.
Year-over-year change in private-sector nominal average hourly earnings, 2007–2014
| CES, all private | ECI, wages and salaries | ECI, total compensation | |
|---|---|---|---|
| 2007-03-01 | 3.6427146% | 3.5749752% | 3.1746032% |
| 2007-04-01 | 3.3234127% | ||
| 2007-05-01 | 3.7257824% | ||
| 2007-06-01 | 3.8575668% | 3.3431662% | 3.1465093% |
| 2007-07-01 | 3.4482759% | ||
| 2007-08-01 | 3.5433071% | ||
| 2007-09-01 | 3.2337090% | 3.4146341% | 3.1219512% |
| 2007-10-01 | 3.2778865% | ||
| 2007-11-01 | 3.3203125% | ||
| 2007-12-01 | 3.1113272% | 3.2945736% | 3.0038760% |
| 2008-01-01 | 3.1067961% | ||
| 2008-02-01 | 3.0464217% | ||
| 2008-03-01 | 3.0332210% | 3.1639501% | 3.1730769% |
| 2008-04-01 | 2.8324532% | ||
| 2008-05-01 | 3.0172414% | ||
| 2008-06-01 | 2.6666667% | 3.1398668% | 2.9551954% |
| 2008-07-01 | 3.0000000% | ||
| 2008-08-01 | 3.2794677% | ||
| 2008-09-01 | 3.2747983% | 2.9245283% | 2.8382214% |
| 2008-10-01 | 3.3159640% | ||
| 2008-11-01 | 3.5916824% | ||
| 2008-12-01 | 3.6303630% | 2.6266417% | 2.4459078% |
| 2009-01-01 | 3.5310734% | ||
| 2009-02-01 | 3.4725481% | ||
| 2009-03-01 | 3.1775701% | 2.0446097% | 1.8639329% |
| 2009-04-01 | 3.2212885% | ||
| 2009-05-01 | 2.8358903% | ||
| 2009-06-01 | 2.7365492% | 1.5682657% | 1.4814815% |
| 2009-07-01 | 2.5889968% | ||
| 2009-08-01 | 2.4390244% | ||
| 2009-09-01 | 2.2977941% | 1.3748854% | 1.1959522% |
| 2009-10-01 | 2.3383769% | ||
| 2009-11-01 | 2.0529197% | ||
| 2009-12-01 | 1.8198362% | 1.2797075% | 1.1937557% |
| 2010-01-01 | 1.9554343% | ||
| 2010-02-01 | 1.8140590% | ||
| 2010-03-01 | 1.7663043% | 1.4571949% | 1.6468435% |
| 2010-04-01 | 1.7639077% | ||
| 2010-05-01 | 1.8987342% | ||
| 2010-06-01 | 1.7607223% | 1.6348774% | 1.9160584% |
| 2010-07-01 | 1.8476791% | ||
| 2010-08-01 | 1.7070979% | ||
| 2010-09-01 | 1.8867925% | 1.6274864% | 2.0000000% |
| 2010-10-01 | 1.8817204% | ||
| 2010-11-01 | 1.6540009% | ||
| 2010-12-01 | 1.7426273% | 1.8050542% | 2.0871143% |
| 2011-01-01 | 1.9625335% | ||
| 2011-02-01 | 1.8262806% | ||
| 2011-03-01 | 1.8246551% | 1.6157989% | 1.9801980% |
| 2011-04-01 | 1.9111111% | ||
| 2011-05-01 | 2.0408163% | ||
| 2011-06-01 | 2.1295475% | 1.6979446% | 2.3276634% |
| 2011-07-01 | 2.2566372% | ||
| 2011-08-01 | 1.9434629% | ||
| 2011-09-01 | 1.9400353% | 1.6903915% | 2.1390374% |
| 2011-10-01 | 2.1108179% | ||
| 2011-11-01 | 2.0228672% | ||
| 2011-12-01 | 1.9762846% | 1.5957447% | 2.2222222% |
| 2012-01-01 | 1.7060367% | ||
| 2012-02-01 | 1.9247594% | ||
| 2012-03-01 | 2.1416084% | 1.8551237% | 2.1182701% |
| 2012-04-01 | 2.0497165% | ||
| 2012-05-01 | 1.7826087% | ||
| 2012-06-01 | 1.9548219% | 1.8453427% | 1.8372703% |
| 2012-07-01 | 1.7741238% | ||
| 2012-08-01 | 1.8630849% | ||
| 2012-09-01 | 1.9896194% | 1.8372703% | 1.9197208% |
| 2012-10-01 | 1.4642550% | ||
| 2012-11-01 | 1.8965517% | ||
| 2012-12-01 | 2.1102498% | 1.7452007% | 1.8260870% |
| 2013-01-01 | 2.1505376% | ||
| 2013-02-01 | 2.1030043% | ||
| 2013-03-01 | 1.8827557% | 1.7346054% | 1.9014693% |
| 2013-04-01 | 1.9658120% | ||
| 2013-05-01 | 2.0504058% | ||
| 2013-06-01 | 2.1729868% | 1.8981881% | 1.8900344% |
| 2013-07-01 | 1.9132653% | ||
| 2013-08-01 | 2.2118248% | ||
| 2013-09-01 | 2.0356234% | 1.8041237% | 1.8835616% |
| 2013-10-01 | 2.2495756% | ||
| 2013-11-01 | 2.1573604% | ||
| 2013-12-01 | 1.9401097% | 2.0583190% | 1.9641332% |
| 2014-01-01 | 1.9789474% | ||
| 2014-02-01 | 2.1017234% | ||
| 2014-03-01 | 2.1419572% | 1.7050298% | 1.6963528% |
| 2014-04-01 | 1.9698240% | ||
| 2014-05-01 | 2.0510674% | ||
| 2014-06-01 | 1.9599666% | 1.8628281% | 2.0236088% |
| 2014-07-01 | 2.0442219% | ||
| 2014-08-01 | 2.1223471% | ||
| 2014-09-01 | 1.9950125% | 2.2784810% | 2.2689076% |
| 2014-10-01 | 1.9510170% | ||
| 2014-11-01 | 1.9461698% | ||
| 2014-12-01 | 1.6549441% | 2.1848739% | 2.3450586% |
* Nominal wage growth consistent with the Federal Reserve Board's 2 percent inflation target, 1.5 percent productivity growth, and a stable labor share of income.
Source: EPI analysis of Bureau of Labor Statistics Current Employment Statistics (CES) public data series and Bureau of Labor Statistics Employment Cost Index (ECI)
Congress, Consider the Facts not Fiction before Voting to Repeal the Medical Device Tax
A priority of the new GOP-dominated Congress is to dismantle the Affordable Care Act (ACA), otherwise known as Obamacare. Having failed to repeal the ACA in the past, the GOP is now starting to nibble at the edges of the ACA, hoping to weaken it. One nibble that is likely to see congressional action soon, and which may even pass in both houses, is the repeal of the medical device tax.
The medical device tax is a small 2.3 percent excise tax on the manufacturer’s price of medical devices. It applies to manufacturers and importers of medical devices. The purpose of the tax is to raise revenue to help offset the costs of the ACA by taxing industries that benefit from health care reform: as reform leads to more people with health insurance coverage, the demand for health care—including medical devices—is likely to rise. The medical device tax became effective on January 1, 2013 and is projected to raise about $3 billion per year, or almost $30 billion over 10 years.
The medical device industry, which apparently is represented by Advanced Medical Technology Association (AdvaMed), argues this small tax is a job killer. According to a recent “study” by AdvaMed, the tax reduced industry employment by 14,000 jobs in 2013, or 3.2 percent of the employees in the industry. Furthermore, the “study” argues that R&D has been reduced in the industry, although no numbers are reported. AdvaMed says they estimated this number from a survey of 55 companies in the industry—less than a quarter of the firms in the industry.
This appears to be pretty damning evidence against the medical device tax, but how does it square with what really happened? Every year, Ernst & Young (E&Y) issues a report on the financial condition of the industry; the E&Y data come from a variety of sources including company financial reports. E&Y shows that industry revenues increased by 4 percent between 2012 and 2013, R&D spending increased by 6 percent, and employment increased by 5 percent. In the first year of the medical device tax, the industry created over 20,000 jobs! Oh, and profits were up by 32 percent.
Of course, it is impossible to say what would have happened in the absence of the medical device tax; perhaps more jobs would have been created. But, contrary to AdvaMed’s fictions, it is clear that the number of jobs in the industry has not fallen.
At about the same time the AdvaMed “study” was released, the Congressional Research Service issued an updated report on this tax. The report concludes: “The analysis suggests that most of the tax will fall on consumer prices, and not on profits of medical device companies. The effect on the price of health care, however, will most likely be negligible because of the small size of the tax and small share of health care spending attributable to medical devices.”
Unless Congress is willing to replace lost revenue from the repeal of the medical device tax, they should keep this small tax on one group that benefits from the ACA.