Key takeaways
- In a one-year span between the end of 2024 and 2025, federal employment in the DMV region (Washington, D.C., and parts of Maryland and Virginia) fell by more than 53,800 jobs (-14.2%). These job losses are only the tip of the iceberg, as scores of area employers whose revenues are connected, directly or indirectly, to the federal government also shed jobs.
- The DMV’s employment rate fell by at least 2 percentage points for every demographic category of workers, while national numbers saw much smaller changes.
- Black workers in the DMV region suffered the largest employment declines in 2025, with the share employed falling by 5.9 percentage points over the year— erasing recent progress in shrinking the regional Black-white employment gap.
- Other localities, including many in Southern, Western, and Midwestern states, are at risk of similar economic harms, especially those with the following characteristics:
-
- having large shares of government workers
-
- receiving significant amounts of federal funding and money from social safety net programs like SNAP and Medicaid
- having sizeable immigrant populations
- The social safety net, which Trump has gutted to pay for tax cuts for the rich, is the dominant driver of economic activity for many communities across the country. For example, in some counties, the income made up of federal transfers to programs like SNAP and Medicaid comprises a larger share of total county income than that from private industries.
Since the second Trump administration swept into office in January 2025, it has undertaken a range of damaging and destabilizing actions that have weakened the economy, undermined workers, hurt businesses and consumers, and threatened core elements of our democracy. While Trump has targeted numerous Democratic-led states and cities, the Washington, D.C., region has faced acute and prolonged harms since day one. From the first set of executive actions signed on Inauguration Day, the Trump administration has attacked people and businesses in the capital region repeatedly and intensely. These initial actions announced the president’s dubious claims of authority to fire large segments of the federal workforce, eliminate long-standing federal agencies and programs, and begin a campaign of illegal and inhumane mass deportations.
The Trump administration’s damaging actions have been enabled and abetted by Republican members of Congress. Their passage of H.R. 1, the bill that the White House has referred to as the “One Big Beautiful Bill Act” (OBBBA), amplifies the administration’s mass deportation agenda and shreds critical health care and food supports for lower-income families to finance tax cuts for the wealthy. This funding bill will only cause more pain in the years ahead for Washington, D.C.-area households and throughout the country.
Congress also passed a federal spending bill that constrained the District of Columbia’s ability to spend its own tax revenue (Koma 2025) and a resolution that may force the district to adopt local tax code changes that match the OBBBA, whether the city wants to or not—changes that will jeopardize hundreds of millions of dollars for city programs (D.C. Fiscal Policy Institute 2026).
In this report, we assess the early indicators of the damage of Trump’s actions and their effects on the Washington, D.C., regional economy, with particular attention to effects on workers and the labor market. We focus on this region due to its prominence as an early target of the Trump administration, in part due to its large federal workforce. Additionally, the district’s unique status as a non-state means that its leaders have far less legal authority to resist Trump’s interference than other target areas do.
Throughout this report, unless otherwise indicated, the data describe economic conditions for the Washington, D.C., metropolitan statistical area (MSA), which includes the District of Columbia, four nearby counties in Maryland, six cities and 11 counties in northern Virginia, and one county in West Virginia. We also refer to this region as the DMV (Washington, D.C.; Maryland; and Virginia). While we do not yet have the requisite data to fully and precisely document all the effects of the administration’s actions, we can see clear signals that the regional economy is already struggling, with more severe impacts likely to register in the data soon.
We then explore some of the factors that make other regions particularly vulnerable to significant economic harm from the Trump administration’s agenda. These include counties with large concentrations of federal workers, areas where federal transfer income (such as Medicaid and Social Security) makes up a significant portion of the region’s economic base, and places with significant immigrant populations. Though Trump has largely targeted prominent, Democratic-led areas, many of the regions most susceptible to the harmful economic consequences of the administration’s actions are rural counties, frequently represented in Congress by Republicans.
Trump’s actions in Washington, D.C., have led to reduced employment and rising unemployment
The clearest sign of the harm that the Trump administration’s actions have done to the Washington, D.C., regional economy is the substantial drop in the region’s employment rate. Based on EPI analysis of Current Population Survey data from the Bureau of Labor Statistics, from December 2024 to December 2025, the share of the regional working-age population with a job fell by 3.2 percentage points.1 As shown in Table 1, this compares with a decline of just 0.4 percentage points for the country over the same period. Among prime-age workers (those ages 25–54), the share employed in the DMV fell by 2.7 percentage points, compared with a decline of just 0.1 percentage points for the country overall.
This dramatic drop in regional employment is a direct result of the Trump administration’s relentless attacks on federal government workers, cuts to federal programs and agencies, and their cascading effects on connected regional industries. Prior to Trump’s taking office, federal employees made up 11.2% of the metro area’s total workforce (BLS-CES-SAE 2025).2 Between the end of 2024 and 2025, federal employment in the DMV region fell by more than 53,800 jobs (-14.2%) (BLS-CES-SAE 2026).3 These losses reverberated through the regional economy as affected households pulled back on spending, and many may have even opted to move, as data show the DMV region had the largest increase in home sale listings of any major metro last year (Brookings Institution 2026).
These significant cuts to federal employment, though highly damaging on their own, are only the first layer of the administration’s harm on the regional labor market. The DMV has a non-federal workforce of over three million people (BLS-CES-SAE 2026), many of whom work at firms that consult with, contract with, are funded by, or are otherwise connected to the government.4 The Trump administration has terminated thousands of grants to scientific research institutions (Kozlov, Tollefson, and Garisto 2026) and frozen or delayed funding for tens of thousands of nonprofit organizations, causing those targeted to limit operations or lay off staff (Tomasko et al. 2025). These cuts have also shrunk the funding pool for nonprofit groups, causing budget challenges even for those not previously receiving federal funding, as they must compete with groups previously funded through federal programs that are now scrambling to fill gaps with private support (Barrett 2025). The administration has also moved to cancel contracts with any company that maintains a commitment to DEI standards (Singh 2026). Although these cuts affect organizations everywhere, the DMV is disproportionately vulnerable to the economic harms of attacks on this sector as it has one of the highest concentrations of nonprofits in the country (Friesenhahn 2025). This is evident in the region’s slight dip (-0.3%) in private-sector employment from December 2024 to December 2025, a change from the consistent, albeit slowing, growth that had marked the years following the COVID-19 pandemic. At the national level, private-sector employment experienced slow but still positive change (0.5%) over the same period (BLS-CES-SAE 2026).5
The widespread impact of the administration’s actions can be seen in the breadth of employment declines across racial, ethnic, gender, and age groups in the region. As shown in Table 1, the employment rate fell by at least 2 percentage points for every demographic category of workers in the DMV. Notably, young workers under age 25 (-4.3 percentage points), workers age 55 and older (-3.3 percentage points), men (-3.5 percentage points), and Black workers (-5.9 percentage points) all experienced drops in their employment rates larger than the regional average. For older workers, the above-average decline likely reflects, at least in part, the firings and retirements of many federal employees, including many who had been near retirement age and opted into the so-called “Fork in the Road” deferred resignation program. For young workers, the administration’s funding and programmatic cuts directly reduced many traditional Beltway early-career opportunities (internships, fellowships), while weakness in the broader regional economy simultaneously forced area employers to pull back on entry-level positions.
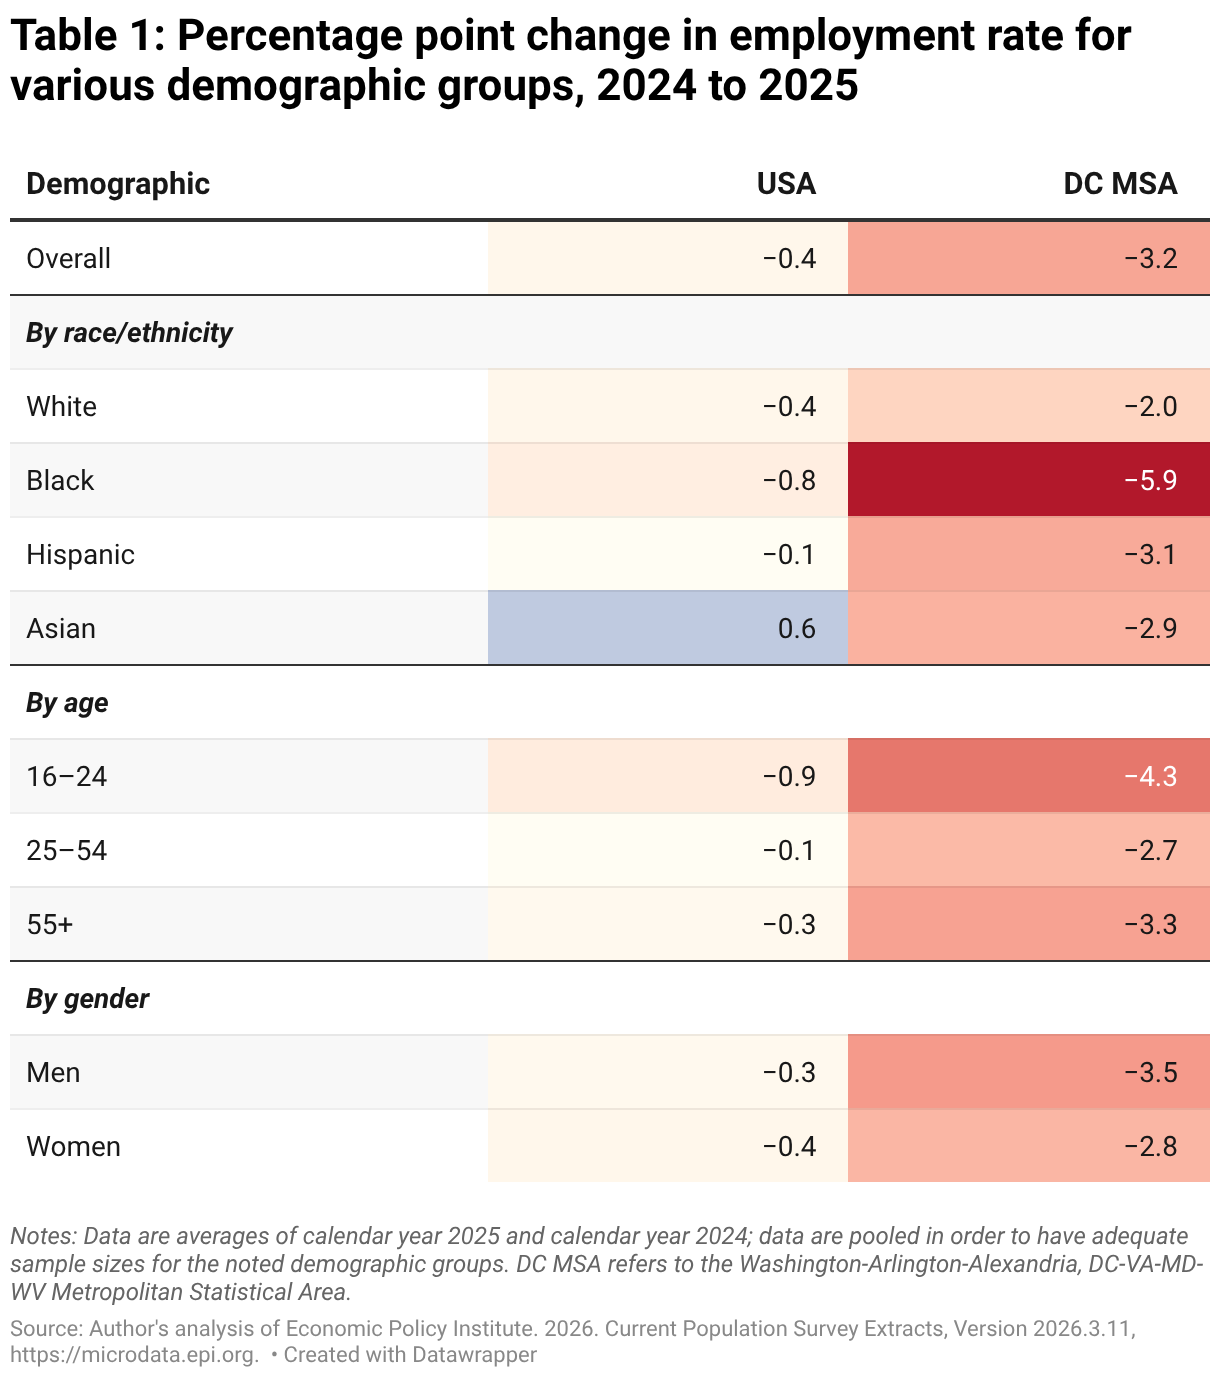
Still, not all groups have been equally affected by Trump’s actions. As Table 1 shows, Black workers in the DMV region have suffered the largest employment declines, with the share employed falling by 5.9 percentage points in 2025. This is nearly triple the employment drop experienced by white workers (2.0 percentage points) in the region and, notably, more than seven times the employment drop of Black workers throughout the country overall (0.8 percentage points). Again, this is a direct consequence of the administration’s attacks on the federal workforce. Black workers have long tended to make up a larger share of the public sector than they do in the private sector—both in the DMV and across the country. This is because the public sector has historically been a pathway to the middle class for workers of color who face labor market discrimination in the private sector (Maye and Marvin 2025).
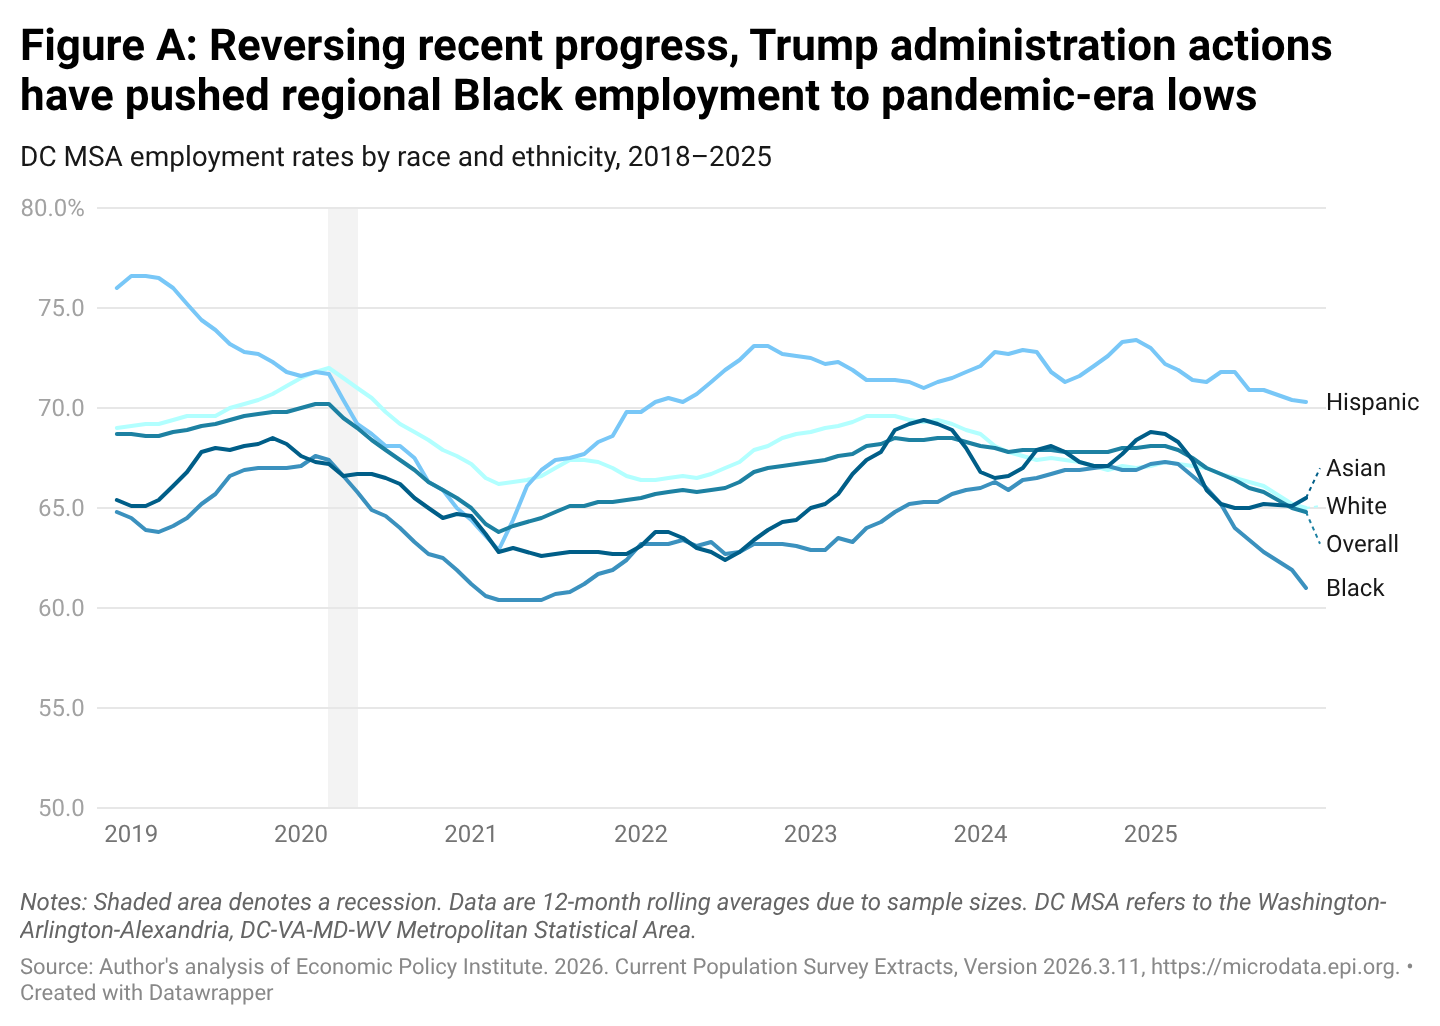
Trump’s massive cuts to federal employment have also rapidly undone what had been considerable progress in shrinking the regional Black-white employment gap. Figure A shows the employment rate of DMV workers, overall and by race/ethnicity, since the end of 2018. The rapid drop in the Black employment rate since the start of President Trump’s second term is striking, bringing the regional Black employment rate back down to its pandemic-era low. It is also notable that before that drop began, Black workers in the region were employed at essentially the same rate as their white counterparts—the only time in the last two decades when that occurred. These losses in employment will exacerbate existing racial and gender inequity across wages, poverty, and unemployment (Markoff and Zielinski 2026; Zielinski 2025; Busette and Elizondo 2022).
Recent increases in the DMV’s overall unemployment rate underscore the damage Trump is doing to the region. The non-seasonally adjusted unemployment rate jumped more than a full percentage point, from 3.1% in January 2025 to 4.4% in January 2026—more than four times the increase in the national figure. (Importantly, this increase understates the weakening of the area labor market, as the BLS estimates the DMV labor force shrank by 3% over the same period—meaning that many workers who would have been counted as unemployed simply left the area labor force.) For comparison, the national non-seasonally adjusted unemployment rate increased by less than half a percentage point, moving from 4.4% in January 2025 to 4.7% in January 2026 (BLS-LAUS 2026).
These numbers do not capture the full extent of the economic downturn in the DMV area, nor can they give us precise insight into where the pain has been most acutely felt. The administration’s violent deportation agenda, for example, will lead to a drop in immigrant and U.S.-born Hispanic workers’ employment, but resulting changes in Hispanic employment rates may be muted by the corresponding shrinking of the overall Hispanic population (Zipperer 2025). In other words, while the overall Hispanic population in the U.S. may fall dramatically in coming years, the ratio of remaining employed workers to remaining total population may stay somewhat consistent. This will mask the true scale of the economic and social harm being done to immigrant communities in the DMV and across the country.
It is also difficult to fully quantify how the deployment and continued presence of National Guard troops, violent immigration actions, and other authoritarian, fear-inducing tactics have impacted D.C.-area businesses, workers, and families, particularly in neighborhoods with predominately Black and Latino populations. Early data show regional declines in tourism, consumer spending, and foot traffic; harder to capture are the emotional and long-term economic consequences (Montgomery 2025; Hadden Loh and Haskins 2025; Sachs and Cocco 2025). Other recent analyses estimate similar economic harms in cities where targeted federal immigration enforcement actions have been aggressively deployed (Rosenthal and Sojourner 2026). A full accounting of the Trump administration’s harms on the Washington, D.C., region will take years to document.
Other localities should brace for similar consequences
Some of the Trump administration’s actions and their acute consequences are unique to the DMV, a function of the region’s high concentration of federal employees and government contractors, as well as the District of Columbia’s lack of statehood and full constitutional rights. However, the anti-government attacks the administration has unleashed on DMV-area households, workers, and businesses will have cascading consequences for communities throughout the country. The effects of the administration’s authoritarian attacks on the civil service, democratic institutions, and immigrants (Human Rights Watch 2026) that first registered across the DMV should be viewed as a preview of the consequences that will be felt in other regions. While no locality will be spared, regions particularly at risk include those with large shares of government workers (especially federal workers, but state and local government workers too), localities in which federal funding and social safety net programs make up a large portion of total area income, and those with large immigrant populations.
Trump’s attacks on the federal workforce will harm communities that rely on their employment
The day Trump returned to power in January 2025, he began attacking the federal workforce, first by moving to reclassify tens of thousands of federal employees to make it easier to fire and replace them with political loyalists (EPI 2026c), and then by stripping more than one million federal workers of their collective bargaining rights (EPI 2025a). The Trump White House subsequently worked feverishly to slash federal employment, attempting large and chaotic reductions in force, shuttering entire agencies, and coercing tens of thousands of staff to resign, among many other attacks (Poydock 2025). As of March 2026, the administration’s actions have reduced nationwide federal government employment by over 350,000 (11.7%) since January 2025 (Gould 2026).
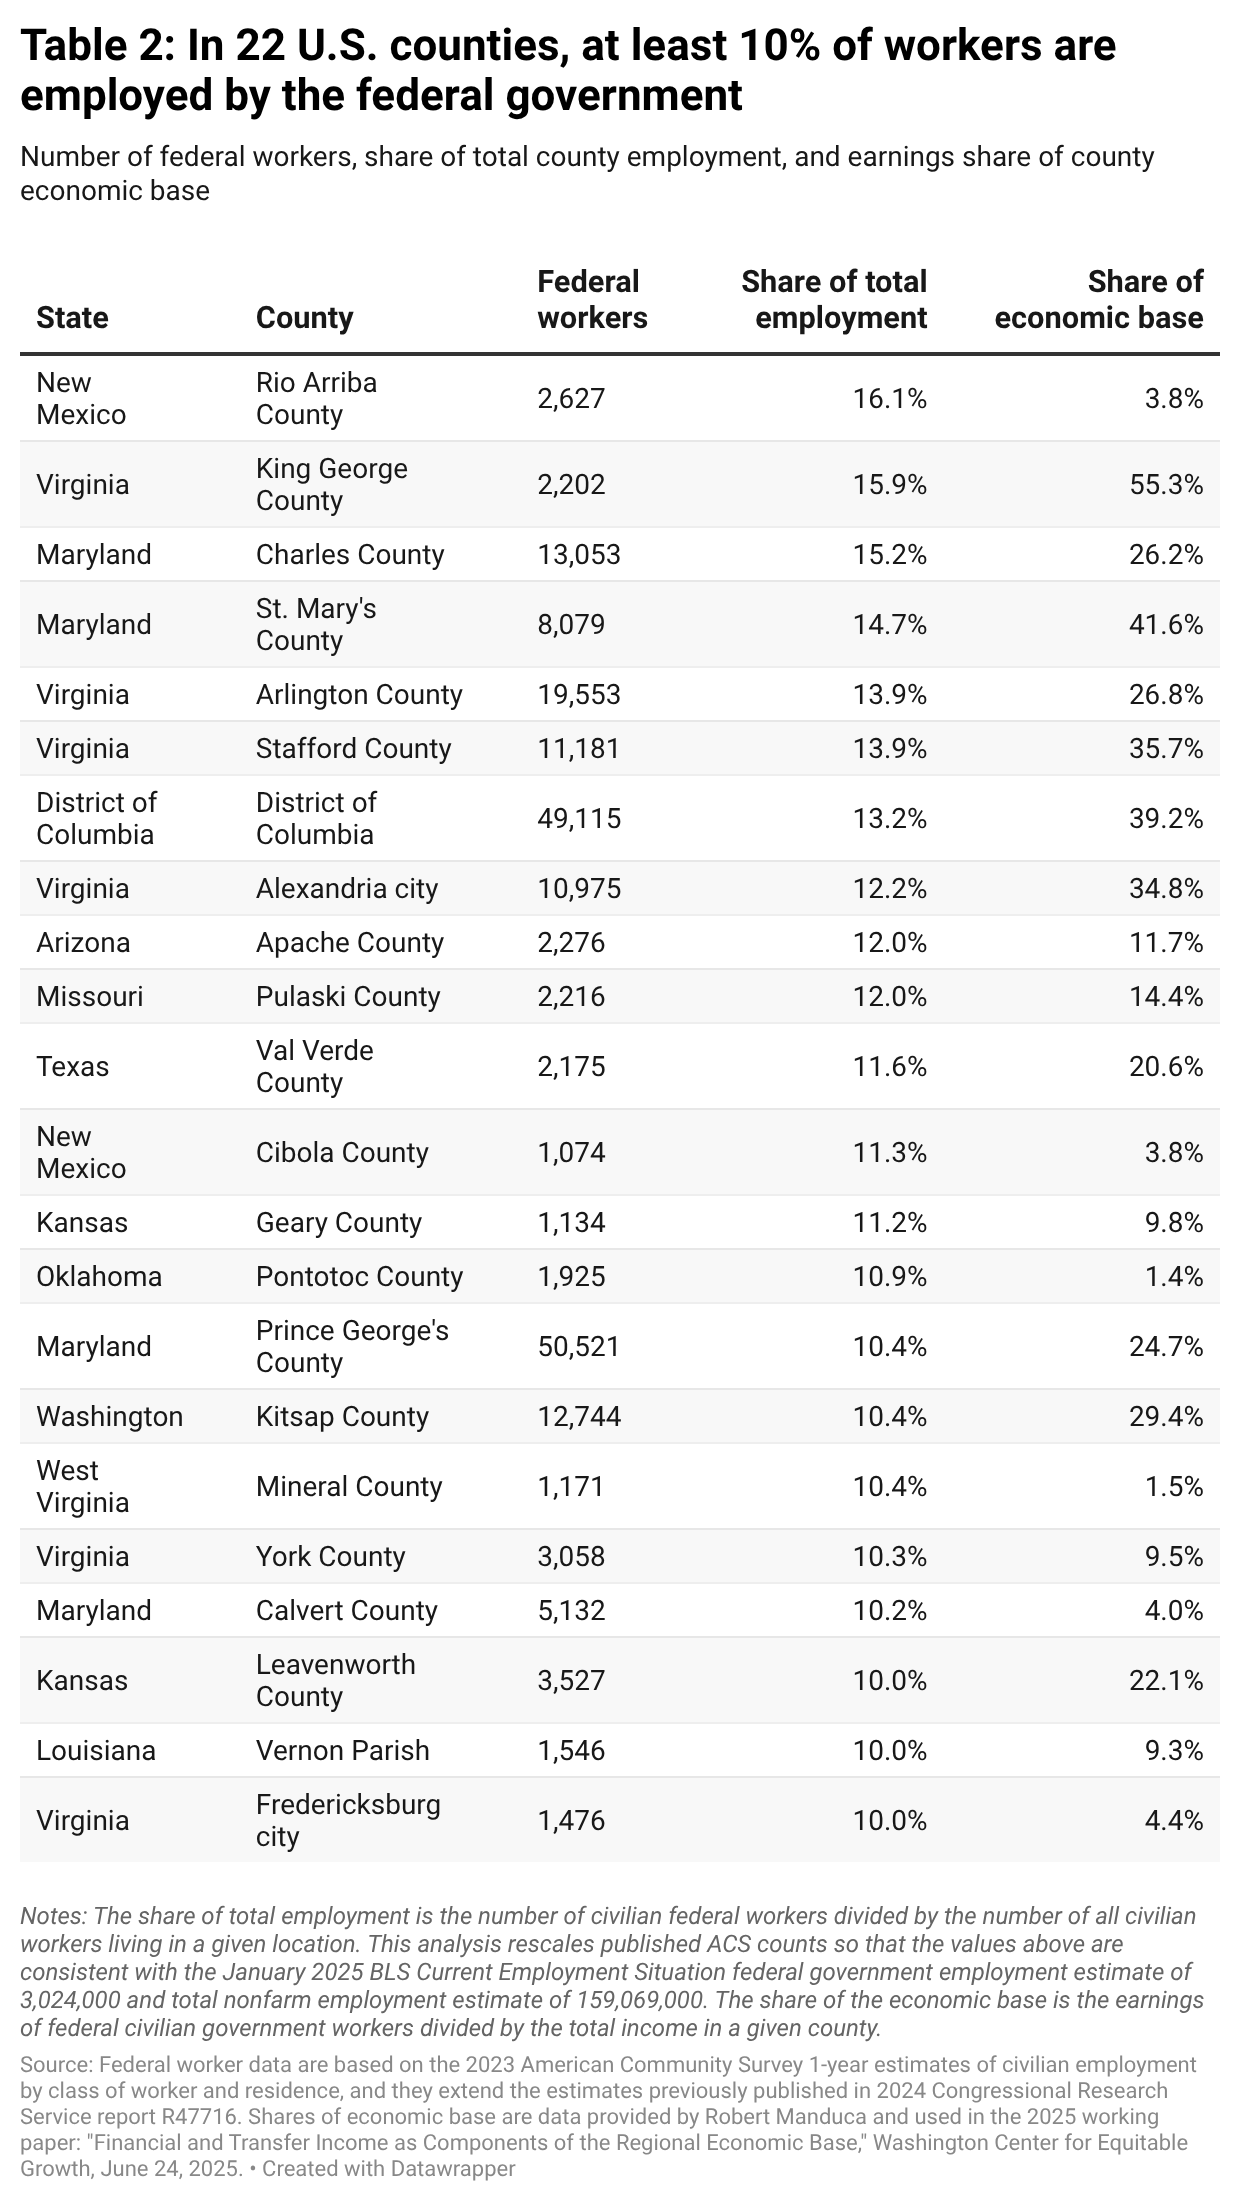
Though federal workers make up a sizeable share of the DMV’s workforce, over 80% of federal workers live outside the region (Partnership for Public Service 2024). For instance, in Alaska, Hawaii, and New Mexico—states that are home to large swaths of federal and Native land, military bases, and federal research institutions—federal workers make up at least 4.5% of total employment (EPI 2025c). Within states, federal workers tend to be concentrated in specific localities. For instance, in Apache County, Arizona, which is largely made up of the Navajo Nation and the White Mountain Apache Reservations, lands that extend beyond county lines, the federal government employs 12% of the county’s workers, more than double the next most significant county for federal worker employment in the state (EPI 2025c). There are 22 U.S. counties, spread across the South, Midwest, and West Census regions, where federal workers comprise at least 10% of the county’s workforce (see Table 2).
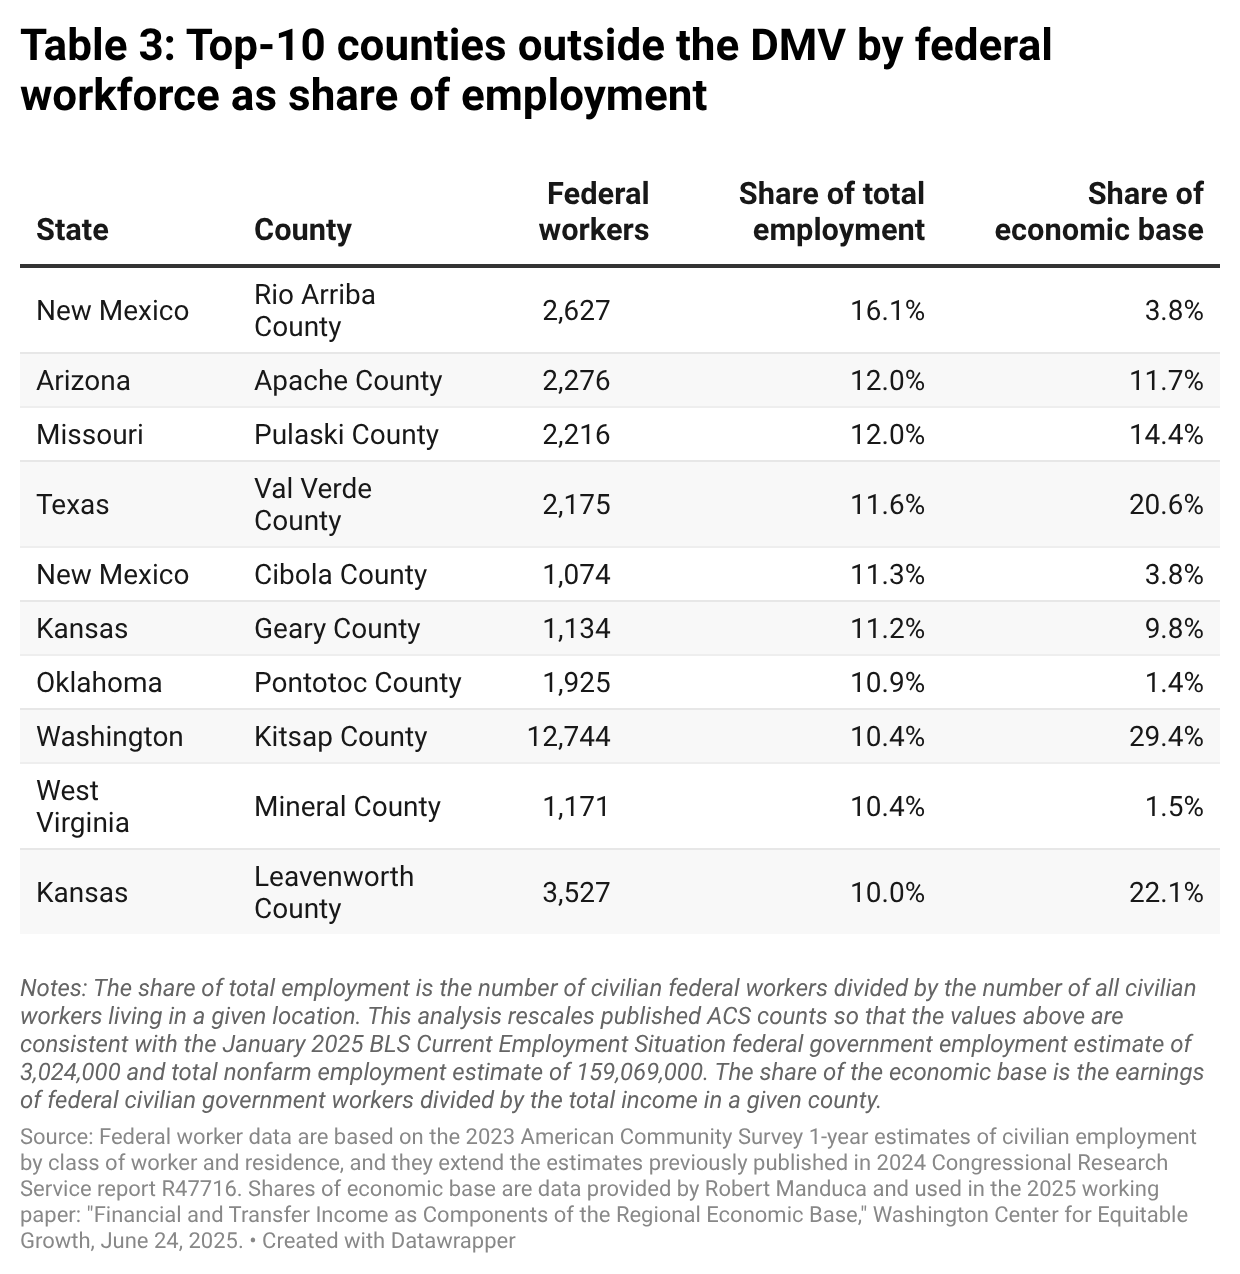
In these counties and elsewhere, federal workers are the backbone of the regional economy, both through the essential services they provide and through their contributions to the local economy. Trump’s attacks simultaneously threaten federal workers’ livelihoods and the economic health of communities in which these workers’ spending on goods and services makes up a large share of economic activity in the region. In Apache County, Arizona, civilian government workers’ earnings comprise 11.7% of total economic activity in the county (see Table 3)—roughly the same as their share of overall county employment. However, in some counties, federal employees’ earnings are a disproportionate share of the regional economic base. For instance, in Leavenworth County, Kansas, where federal employees make up 10.0% of employment (Leavenworth has a large federal prison), federal civilian earnings comprise 22.1% of total income in the county.
The effects from lost federal jobs and income in these regions could be devastating. Some of these communities are places that have already faced historic disinvestment and in which there are few local employment opportunities that can match the quality of federal government jobs. These jobs are historically stable, good quality, union jobs that offer a pathway to the middle class, particularly for workers without a college education.6
Regions highly dependent on federal revenue will also suffer from a reduction in services and a loss of income
Beyond the harm to localities from reductions in the federal workforce, localities that are particularly reliant on federal government revenue and services will bear the consequences of Trump’s actions most acutely, though no locality will be spared from harm. For example, the Trump administration has announced or considered $23 billion in cuts to federal clean energy projects in nearly every state (CATF 2025) and $8 billion in cuts to colleges and universities that will impact every state’s economy (Bedekovics and Ragland 2025). Trump’s 2025 budget bill also made massive cuts to federal safety net programs that millions of low-income households rely on in order to finance tax cuts for the wealthiest households and corporations.
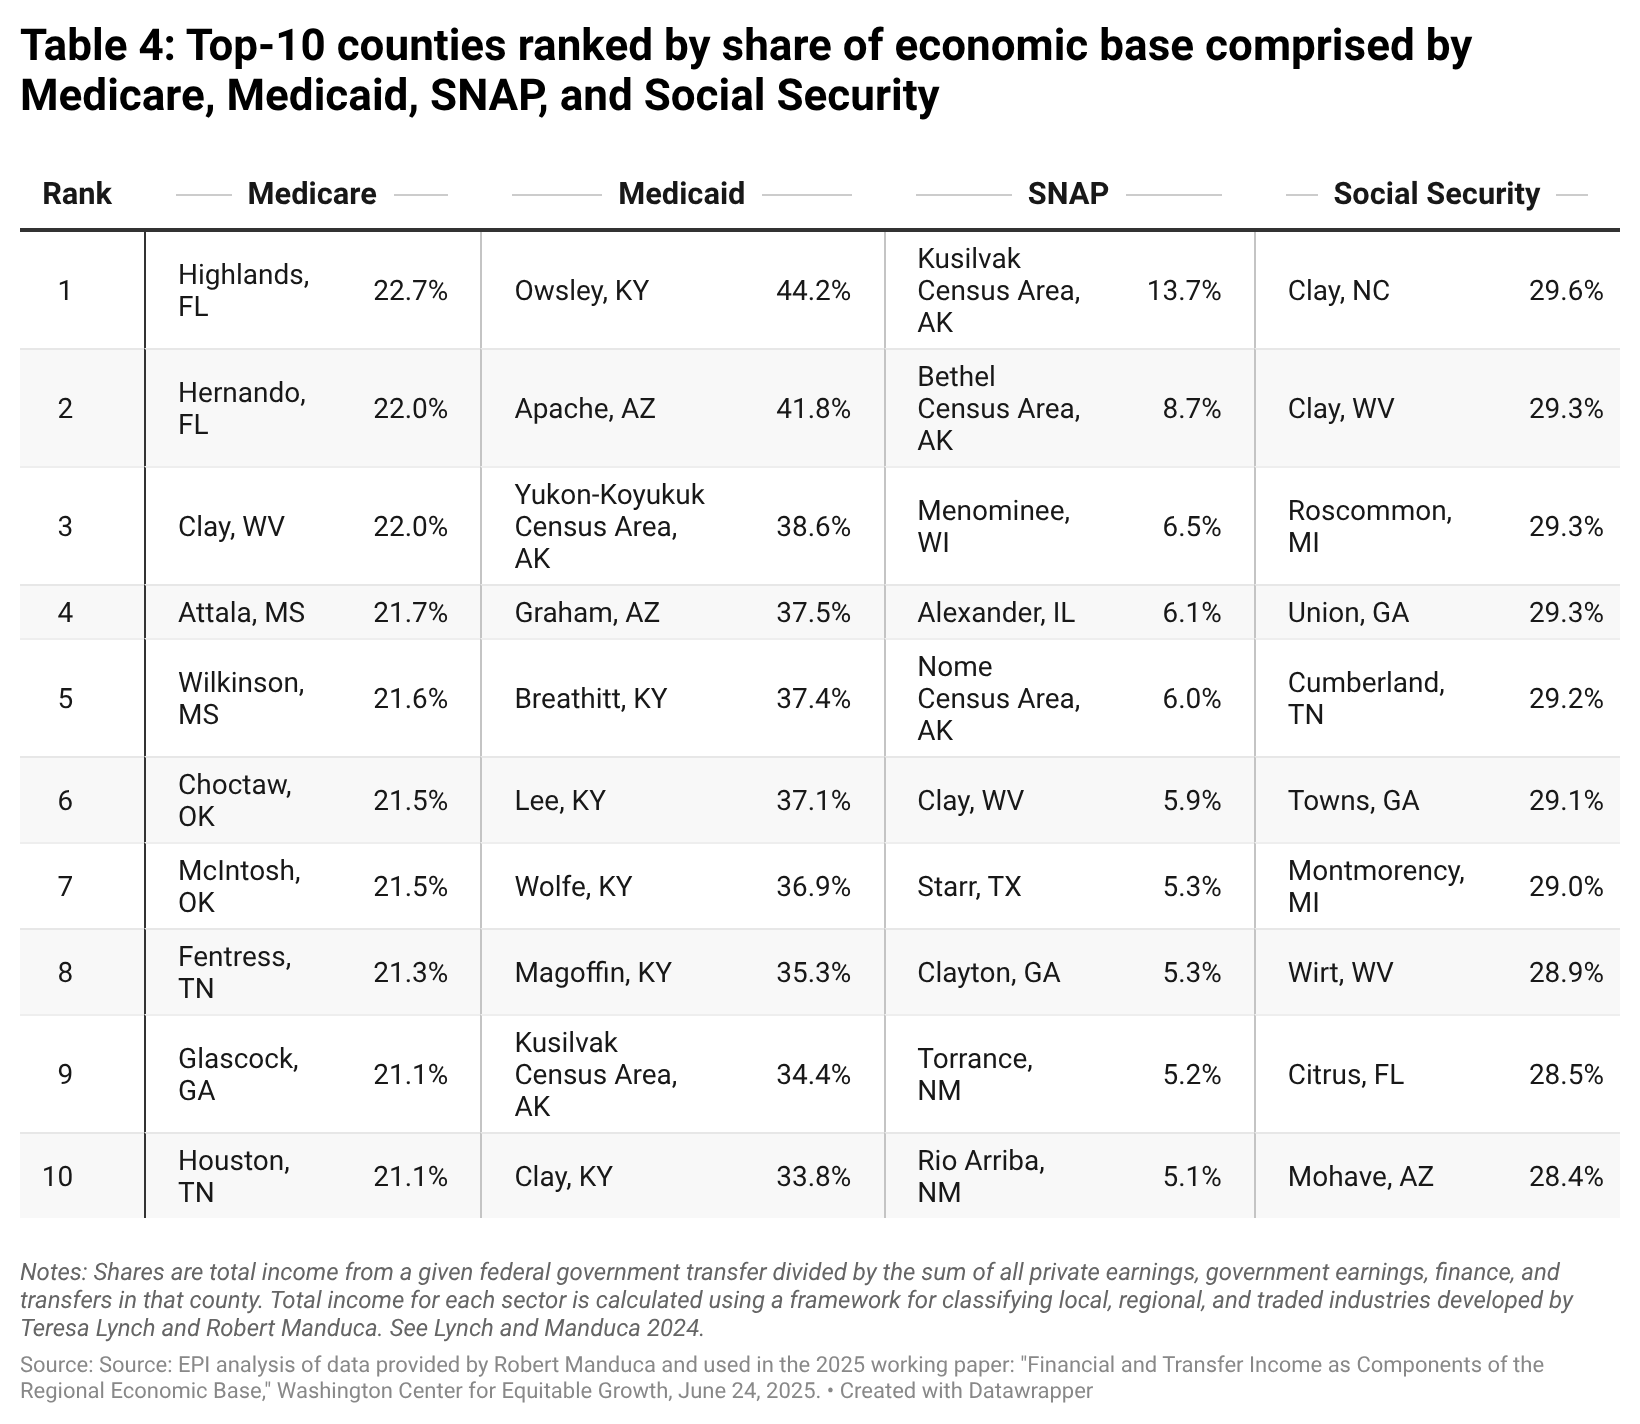
Funds from federal programs such as SNAP, Medicaid, and other social programs not only help struggling families make ends meet, they also comprise a significant share of a locality’s “economic base,” the amount of money circulating in that region, as shown by sociologist Robert Manduca in a recent working paper (2025). Indeed, an often-overlooked benefit of Medicaid coverage is its role as a source of income for low-income households (money they would have had to spend on medical care in the absence of Medicaid). For the bottom 20% of households in the U.S., Medicaid comprised 70% of their total money income, based on recent data from the Congressional Budget Office (Bivens, Wething, and Morrissey 2025). In fact, government transfers such as Social Security, Medicare, and Medicaid collectively made up 40% of the economic base of U.S. regions in 2022 (Manduca 2025). Substantial cuts to government social programs that support low-income households could reduce the economic base of these localities, at a scale equivalent, in many cases, to the loss of entire private industries in those areas.
Without deliberate intervention by state lawmakers to offset lost federal revenues, localities in every state face dire economic losses, but states particularly reliant on government transfers will suffer most. For instance, take Clay County, West Virginia, which is represented in Congress by Rep. Carol Miller (R-WV01), who voted in support of Trump’s budget bill (Miller 2025). Clay County’s poverty rate is more than double the national rate, and its per capita income is half the national amount (U.S. Census 2024a). Of the 10 U.S. counties that rely most on each of the largest federal social insurance programs (Medicare, Medicaid, SNAP, and Social Security) as a share of their economic base, Clay is the only county in the country to show up three times (see Table 4). Federal government transfers in the form of Medicare, SNAP, and Social Security payments comprise 57% of Clay County’s economic base, 20 times the share comprised by the earnings of every private industry in the county combined. Alaska, Arizona, Florida, Georgia, Kentucky, Tennessee, and West Virginia all have at least three counties that are ranked in the top 10 in the country for their reliance on a given social safety net program as a share of the county’s economic base (see Table 4).
Localities that have significant shares of federal workers and rely heavily on federal government transfers may face particularly significant consequences as a result of Trump’s attacks on the federal workforce and the Republican budget bill’s cuts to essential social safety net programs. For example, in Rio Arriba County, New Mexico, and Apache County, Arizona, federal government workers make up 16.1% and 12.0% of all workers in the county, respectively (EPI 2025b). At the same time, both counties are ranked in the top-10 counties most reliant on federal government transfers—Apache is #2 for Medicaid, and Rio Arriba is #10 for SNAP. In Apache County, federal government transfers account for three-quarters (76.9%) of the county’s economic base, and the earnings of federal government civilian workers account for 11.7%—the Navajo Nation Tribal Government is the county’s largest employer (NACOG 2023). Meanwhile, private earnings account for a mere 2.8% of the county’s economy. In Apache, Trump’s cuts to both the federal workforce and federal government programs mean that the federal government may be unable to fulfill its legal obligations to tribal communities (Brown 2025) that have faced decades of disinvestment and depressed economic outcomes resulting from historic land theft and forced assimilation. Apache County’s poverty rate of 31.2% (AZ Economics 2026) is nearly triple the national rate of 11.1% in 2023 (Shrider 2024).
Trump’s anti-immigrant crackdown and deportation agenda hurt localities with large immigrant populations
Trump has launched a campaign of terror against immigrant communities, communities of color, and those who stand with them. Last summer, Trump federalized local police and deployed thousands of federal troops to diverse cities with large immigrant populations (Kim 2025). Though Washington, D.C., may have experienced the most visible federal troop presence, a function of the district’s lack of statehood and the president’s unchecked authority to mobilize the National Guard there (Dallas 2025), Los Angeles was the first city Trump targeted after public opposition to aggressive immigration raids (Kim 2025). It was soon followed by Washington, D.C.; Memphis, Tennessee; Portland, Oregon; New Orleans, Louisiana; Minneapolis, Minnesota; and Portland, Maine.
These attacks are characteristic of an authoritarian playbook that includes forcing the leaders of diverse, opposition-led communities to bend to the strongman government’s will (McManus, Benson, and Herman 2024). Minneapolis, home to a large immigrant population, was subjected to an unprecedented immigration crackdown that drew widespread protests (Boone 2026). During “Operation Metro Surge,” as it was called, federal immigration enforcement officials made 4,000 arrests and killed two U.S. citizens. Though the true toll of this violent operation may never be fully quantified, initial economic data show clear cause for concern. A recent analysis estimated that Trump’s immigration crackdown has led to a 2.9% decline in consumer spending in Minnesota over a single month—the equivalent of the state’s economy losing $626 million (Rosenthal and Sojourner 2026). Relative to overall consumer spending, the food and accommodation sector (which employs a large share of immigrant workers) saw the most significant decline in January 2026—3.8% or a $46 million reduction in economic activity. Researchers also estimated that nearly 3% of workers in the Minneapolis-Saint Paul region were unable to work during the occupation, resulting in a loss of over $100 million in wages (Sojourner and Rosenthal 2026).
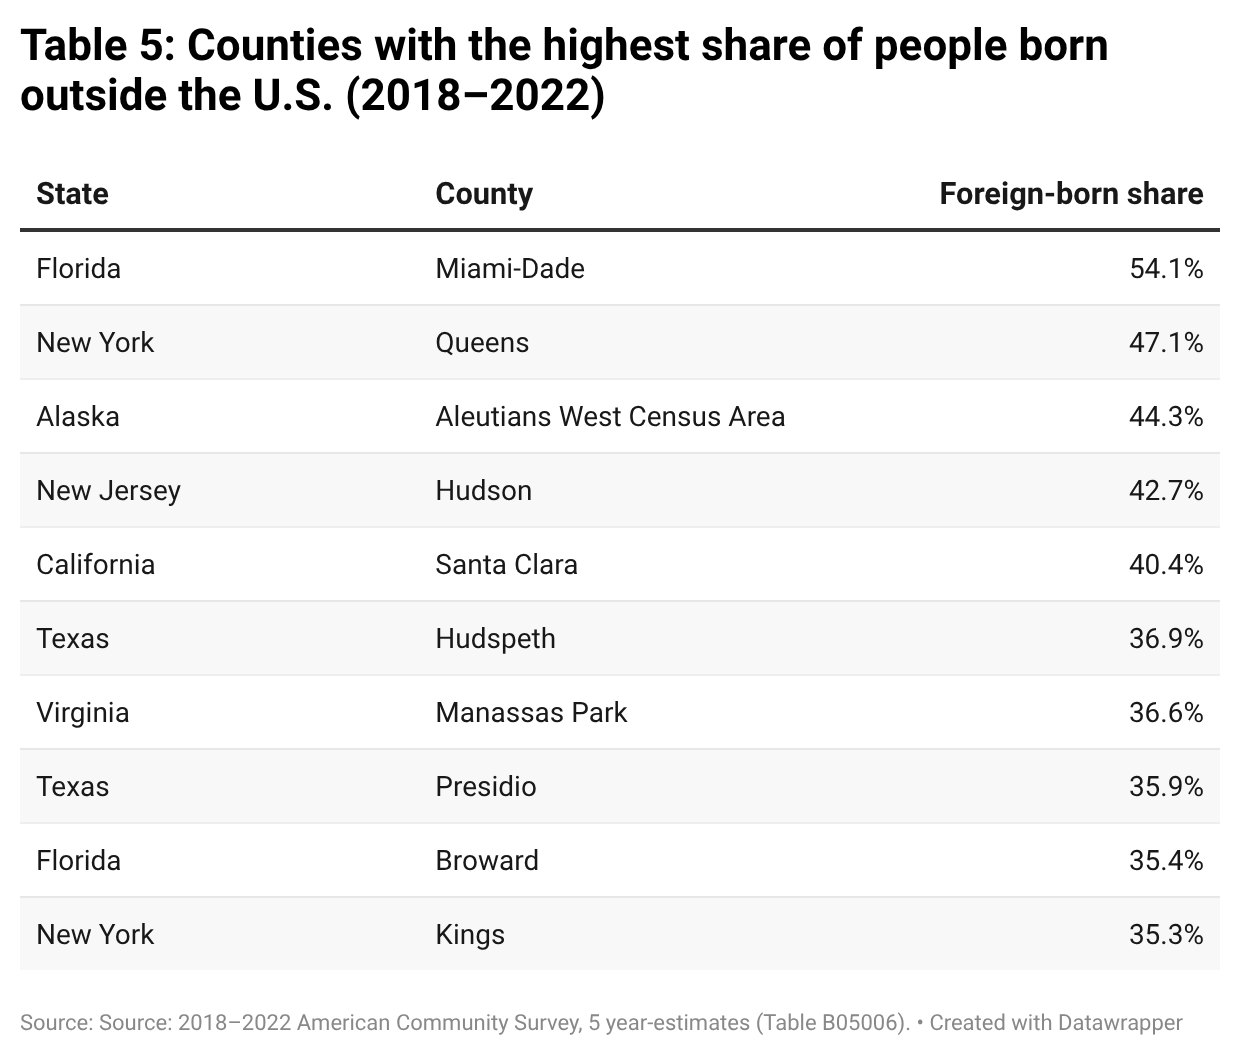
Trump’s deportation agenda will continue to destabilize local communities and result in job losses for immigrant and U.S.-born residents alike (Zipperer 2025). Though immigrants live in counties across the U.S., coastal urban areas tend to have the largest shares of foreign-born residents. Counties with the largest foreign-born populations include Miami-Dade, Florida; Queens, New York; Aleutians, Alaska; and Hudson, New Jersey (see Table 5). Counties with relatively large shares of immigrants may see particularly acute harms from aggressive immigration enforcement.
Communities face overlapping economic threats from attacks on federal workers, the social safety net, and immigrants, but state and local lawmakers can resist them.
The Trump administration’s attacks on the federal workforce, the social safety net, and immigrant communities are designed to exacerbate economic precarity in many communities that are already struggling (Bivens 2026). The implementation of Trump’s authoritarian agenda in the DMV region may be the first, clearest, and in some cases most direct manifestation of its harms, but other localities across the country—particularly those with large federal workforces, those that are heavily dependent on federal revenue and those with sizeable immigrant populations—are far from immune, and many will suffer as much, if not more, from this agenda.
While state and local leaders cannot stop federal attacks, they do have the power to resist Trump’s agenda by improving state labor standards (EPI 2026b), advancing protections for immigrant workers (Díaz and Whitaker 2026), investing in the public-sector workforce (Bivens and Shierholz 2026), and using progressive tax policies (Austin and Davis 2025) to stabilize funding for critical social programs and other investments that workers, families, and communities need.
Notes
1. Throughout this report, unless explicitly noted, the source for all employment rate data is the authors’ analysis of Current Population Survey data (EPI 2026a). We compare an average of calendar year 2025 with calendar year 2024 in order to have adequate sample sizes for the noted demographic groups.
2. Employment level by industry and sector data come from the authors’ analysis of the Bureau of Labor Statistics’ Current Employment Statistics (CES) State and Metro Area (SAE) data.
3. These numbers are calculated using monthly totals rather than annual averages. A quarterly comparison of 2025Q4 to 2024Q4 finds roughly the same results—employment fell by 52,600 jobs (13.9%). The quarterly analysis omits October in both years to maintain an apples-to-apples comparison, accounting for missing data due to the government shutdown that began in October 2025 and the subsequent lapse in Bureau of Labor Statistics funding.
4. The non-federal workforce includes private sector workers as well as state and local government employees.
5. These numbers are calculated using monthly totals rather than annual averages. Quarterly comparisons of 2025 Q4 to 2024 Q4 produce similar results—private sector employment fell by 0.1% in the DMV and grew by 0.7% nationally. The quarterly analysis follows the methodology outlined in note 2.
6. On average, federal workers with advanced degrees typically earn less in wages and total compensation than their private-sector counterparts. Federal workers without an advanced degree typically earn more than their private-sector counterparts and have access to retirement benefits that have become less common in the private sector (CBO 2024).
References
Austin, Sarah, and Carl Davis. 2025. The Wealth Proceeds Tax: A Simple Way for States to Tax the Wealthy. Institute on Taxation and Economic Policy, October 2025.
AZ Economics. 2026 “Apache County, Arizona.” U.S. Economic Research. Accessed April 2026.
Barrett, William P. 2025. “America’s Top 100 Charities: A Year of Pain After Trump Cuts.” Forbes, December 12, 2025.
Bedekovics, Gréta, and Will Ragland. 2025. Mapping Federal Funding Cuts to U.S. Colleges and Universities. Center for American Progress, July 2025.
Bivens, Josh. 2026. The Trump Administration’s Macroeconomic Agenda Harms Affordability and Raises Inequality. Economic Policy Institute, February 2026.
Bivens, Josh, and Heidi Shierholz. 2026. “You Can’t Starve the Public Sector to Excellence.” Working Economics Blog (Economic Policy Institute), February 27, 2026.
Bivens, Josh, Hilary Wething, and Monique Morrissey. 2025. Cutting Medicaid to Pay for Low Taxes on the Rich Is a Terrible Trade for American Families. Economic Policy Institute, February 2025.
Boone, Rebecca. 2026. “A Timeline of Trump’s Immigration Crackdown in Minnesota.” PBS Newshour, February 13, 2026.
Brookings Institution. 2026. “Active Residential For-Sale Listings,” DMV Monitor. Last updated February 18, 2026.
Brown, Alex. 2025. “For Indian Country, Federal Cuts Decimate Core Tribal Programs.” Stateline, March 4, 2025.
Bureau of Labor Statistics, Current Employment Statistics State and Metro Area (BLS-CES-SAE). Various years. Public data series accessed through the CES State and Metro Area Databases and through series reports. Accessed April 2026.
Bureau of Labor Statistics, Local Area Unemployment Statistics (BLS-LAUS). Various years. Data from the LAUS are available through the LAUS database and through series reports. Accessed April 2026.
Busette, Camille, and Samantha Elizondo. 2022. “Economic Disparities in the Washington, D.C. Metro Region Provide Opportunities for Policy Action.” Commentary, Brookings Institution, April 27, 2022.
Clean Air Task Force (CATF). 2025. “The High Cost of Retreat: Impacts of Department of Energy Project Cuts.” Clean Air Task Force, November 21, 2025.
Congressional Budget Office (CBO). 2024. Comparing the Compensation of Federal and Private-Sector Employees in 2022. Congressional Budget Office, April 2024.
Dallas, Kelsey. 2025. “The President’s Power to Deploy Troops Domestically: An Explainer.” SCOTUSblog, October 28, 2025.
D.C. Fiscal Policy Institute. 2026. “Congressional Interference Will Cost D.C. Nearly $700 Million in Local Revenue and Jeopardize Efforts to Reduce Child Poverty.” D.C. Fiscal Policy Institute, February 4, 2026.
Díaz, Marisa, and Mimi Whitaker. 2026. How States and Localities Can Strengthen Workplace Protections for Immigrant Workers. National Employment Law Project, January 2026.
Economic Policy Institute (EPI). 2025a. “Executive Order on ‘Exclusions from Federal Labor-Management Relations Programs.’” Federal Policy Watch (Economic Policy Institute), December 17, 2025.
Economic Policy Institute (EPI). 2025b. How Many Federal Employees Live in Your State? Economic Policy Institute.
Economic Policy Institute (EPI). 2025c. “New Resource Calculates How Many Federal Workers Live in Every State, County, and Congressional District” Economic Policy Institute (press release). March 3, 2025.
Economic Policy Institute (EPI). 2026a. Current Population Survey Extracts, Version 2026.3.11, https://microdata.epi.org.
Economic Policy Institute (EPI). 2026b. Holding the Line: State Solutions to the U.S. Worker Rights Crisis. Economic Policy Institute.
Economic Policy Institute (EPI). 2026c. “OPM Finalizes Regulation Enabling Firing Federal Employees for Political Reasons.” Federal Policy Watch (Economic Policy Institute), March 4, 2026.
Friesenhahn, Erik. 2025. “Nonprofit Organizations: State and Regional Employment Trends.” Monthly Labor Review (U.S. Bureau of Labor Statistics), March 2025. https://doi.org/10.21916/mlr.2025.6.
Gould, Elise. 2026. “Attacks on the federal workforce continue (down 18k jobs in March).” Bluesky, @elisegould.bluesky.social, April 3, 2026, 9:01 a.m.
Hadden Loh, Tracy, and Glencora Haskins. 2025. Consumer Spending and Visitor Demand in the Washington, D.C. Region Are Dropping. Brookings Institution, December 2025.
Human Rights Watch. 2026. “Sliding Towards Authoritarianism?” January 2026.
Kim, Juliana. 2025. “Trump Says National Guard Will Soon Go to New Orleans. Here’s the Latest.” NPR, December 3, 2025.
Koma, Alex. 2025. “Here’s How D.C. Solved the Billion-Dollar Budget Problem Congress Created.” WAMU, October 22, 2025.
Kozlov, Max, Jeff Tollefson, and Dan Garisto. 2026. “U.S. Science After a Year of Trump.” Nature 649 (January): 812–815.
Lynch, Teresa M., and Robert Manduca. 2024. “Beyond Local and Traded: Evidence for a Third Industry Market Area Type and Implications for Regional Economic Development.” Economic Development Quarterly 38, no. 3: 183–194, July 2024. 
Manduca, Robert. 2025. Financial and Transfer Income as Components of the Regional Economic Base. Washington Center for Equitable Growth, June 2025.
Markoff, Shira, and Connor Zielinski. 2026. Chronic Racial Inequality Holds Back Workers and Equitable Economic Growth. D.C. Fiscal Policy Institute, March 2026.
Maye, Adewale A., and Stevie Marvin. 2025. “Trump Attacks on Federal Agencies Have Steep Implications for Black Workers.” Working Economics Blog (Economic Policy Institute), April 10, 2025.
McManus, Allison, Robert Benson, and Dan Herman. 2024 “The Dangers of Project 2025: Global Lessons in Authoritarianism.” Center for American Progress, October 2024.
Miller, Carol. 2025. “Miller Votes to Send the One, Big, Beautiful Bill to President Trump’s Desk” (press release). Office of Congresswoman Carol Miller, West Virginia’s First District, July 3, 2025.
Montgomery, Mimi. 2025. “Trump Crackdown Is Affecting D.C.’s Image and Tourism Numbers.” Axios, August 29, 2025.
Northern Arizona Council of Governments (NACOG). 2023. “Business, Jobs, and Industry Highlights for Apache County.” Northern Arizona Council of Governments, November 20, 2023.
Partnership for Public Service. 2024. Beyond the Capital: The Federal Workforce Outside the D.C. Area. March 2024.
Poydock, Margaret. 2025. “How Trump Has Dismantled the Federal Workforce in His First 100 Days.” Working Economics Blog (Economic Policy Institute), May 23, 2025.
Rosenthal, Aaron, and Aaron Sojourner. 2026. The Economic Impact of Operation Metro Surge in January 2026: A Synthetic Difference-in-Differences Analysis. North Star Policy Action, February 2026.
Sachs, Andrea, and Federica Cocco. 2025. “D.C. Tourism Was Already Struggling. Then the National Guard Arrived.” Washington Post, August 29, 2025.
Shrider, Emily A. 2024. Poverty in the United States: 2023. United States Census Bureau, Report Number P60-283, September 2024.
Singh, Kanishka. 2026. “Trump Signs Executive Order Asking Federal Contractors to Eliminate DEI.” Reuters, March 26, 2026.
Sojourner, Aaron, and Aaron Rosenthal. 2026. Impact of DHS Agent Surge on Minneapolis-Saint Paul Metro Area Labor Outcomes. North Star Policy Action, February 2026.
Tomasko, Laura, Hannah Martin, Katie Fallon, Mirae Kim, Lewis Faulk, and Elizabeth T. Boris. 2025. How Government Funding Disruptions Affected Nonprofits in Early 2025: Nationally Representative Findings from the Nonprofit Trends and Impacts Study. Urban Institute, October 2025.
U.S. Census Bureau. 2024a. “American Community Survey 5-Year Estimates: Retrieved from Census Reporter Profile Page for Clay County, WV.” Accessed April 14, 2026.
U.S. Census Bureau. 2024b. “U.S. Foreign-Born Population: 2018–2022 American Community Survey, 5 Year-Estimates (Table B05006).” Accessed April 14, 2026.
Zielinski, Connor. 2025. “Inequality Remained Extreme in 2024 as D.C. Backslid on Poverty.” DCFPI Blog (D.C. Fiscal Policy Institute), September 15, 2025.
Zipperer, Ben. 2025. Trump’s Deportation Agenda Will Destroy Millions of Jobs: Both Immigrants and U.S.-Born Workers Would Suffer Lob losses, Particularly in Construction and Child Care. Economic Policy Institute, July 2025.