Keeping taxes low for the richest households and corporations is the clearest legislative priority of the Trump administration and the Republican congressional majority. Many provisions of the 2017 tax law (often called the Tax Cuts and Jobs Act or the TCJA) are expiring this year. Extending these provisions would provide hugely disproportionate benefits to the richest households.
To illustrate the difference in benefits depending on household income, the range would extend between less than $0.35 per day for the poorest households to $860 per day for the top 0.1%. For the bottom 20% of U.S. households, extending these provisions would give them an average of less than $0.35 per day. For households in the second income fifth, the benefits would be $1.20 per day, and for the middle 20% of the income distribution, the benefits would be $1.80 per day. Yet for the richest 1% of households, the benefits would jump to $165 per day, while the top 0.1% would see benefits of $860 per day.
Besides being unfairly distributed, the cost of the overall tax cut is large enough to put huge stress on other parts of the economy, no matter how it’s paid for.1 The most damaging way to pay for this would be to enact large cuts in spending programs that provide benefits to economically vulnerable families. Last week, House Republicans approved a budget resolution calling exactly for these types of cuts, including $880 billion in cuts that will inevitably fall on Medicaid, the program that provides health insurance for low-income Americans who cannot otherwise afford it.2
Medicaid is, by far, the largest program in the federal government aimed predominantly at alleviating poverty.3 In 2024 it provided health insurance coverage for over 80 million people each month. The juxtaposition of prioritizing lower taxes for the richest families while proposing steep cuts to the nation’s largest program aimed at alleviating poverty could not be more clarifying for the economic debate in front of us.
The benefits of extending expiring provisions to the TCJA are easy to summarize. They will boost incomes trivially for the large majority of families but significantly for the richest households, leading to greater income inequality. The costs of Medicaid cuts are a bit harder to summarize because they are so broad and will cascade far into the future. The summary of what these cuts will do is clear. They will greatly increase hardship and misery for already struggling families, they will reduce opportunities in the future for kids who will grow up less healthy and poorer because their families lack access to Medicaid, and they will put enough strain on the nation’s overall economy that they will make a future recession far more likely.
In the rest of this report, we provide some data and texture on the channels through which Medicaid cuts will damage present and future prospects for economic security:
- Medicaid cuts will substantially reduce incomes for families in the bottom 40% (the bottom two-fifths) of the income distribution. For the bottom fifth, $880 billion in Medicaid cuts over the next decade would translate into Medicaid benefit reductions equal to 7.4% of their money income. For the second fifth, these cuts would equal 1.7% of their money income. (Money income is defined as income received from wages, interest, dividends, rents, Social Security, unemployment insurance, Supplemental Security Income, and pensions.) Medicaid cuts will easily swamp the meager benefits these families might get from TCJA extensions.
- This is true for every state in the country. Medicaid cuts will squander most of the meager benefits from the TCJA extension even for families in the middle fifth of the income distribution.
- Medicaid cuts will lead to worse health and financial outcomes for young adults. Recent Medicaid expansions included in the Affordable Care Act (ACA) provided one of the only robust safety nets available to childless young adults in the U.S. These expansions led to better health and financial security—and notably reduced medical debt.
- Medicaid cuts will have terrible effects for health systems and health outcomes in rural parts of the United States.
- Rural hospitals have significantly lower operating margins than others and rely disproportionately on payments from Medicaid to remain in business. The financial viability and closures of rural hospitals have been clearly worse in states that have yet to accept the expansions to Medicaid under the ACA.
- For example, operating margins for rural hospitals are 2.0% in states that accepted the ACA Medicaid expansions but just 0.3% for others.
- Three-quarters of rural hospital closures since 2010 have come in the minority of states that did not accept the ACA Medicaid expansions.
- Rural towns and counties rely overwhelmingly on Medicaid to provide health insurance coverage—particularly for children. Medicaid covers over 50% of children in small towns and rural areas in six states: Arizona, Arkansas, Florida, Louisiana, New Mexico, and South Carolina.
- Rural hospitals have significantly lower operating margins than others and rely disproportionately on payments from Medicaid to remain in business. The financial viability and closures of rural hospitals have been clearly worse in states that have yet to accept the expansions to Medicaid under the ACA.
- If Medicaid cuts lead to children being left out of its protections, the cuts will result in worse outcomes when those children grow up: lower educational attainment and lower earnings as adults.
- Past Medicaid spending provided not just contemporaneous benefits to recipients but also proved to be an extremely good investment—leading to a future workforce that was healthier and had stronger labor force attachments.
- Medicaid cuts that deprive children of access to health coverage could actually cost the federal budget money on net in the long term, as these children would grow up to earn less in wages, pay less in taxes, and be more likely to receive other public benefits.
- Various forms of likely Medicaid cuts have been shown to forfeit between half and 266% of their deficit-reduction benefits once the spillover effects on children’s health and outcomes as adults are factored in. In short, many cuts will increase budget deficits in the coming decades.
- Finally, if the full $880 billion cut to Medicaid occurs and is put into effect in the next year, this will suck enormous amounts of purchasing power out of the economy. This, in turn, would leave us far more vulnerable to other potential recessionary shocks in the years ahead.
- The Federal Reserve will be forced to cut interest rates simply to keep the unemployment rate from rising.
- While lower interest rates might sound good to some, these cuts will constitute the Fed wasting nearly half of its current policy ammunition for fighting recessions simply to absorb the policy combination of lower taxes for the rich and lower incomes for the bottom half. This cannot be a good use of the Fed’s resources.
Medicaid and household incomes
The Congressional Budget Office (CBO) periodically releases valuable data highlighting the level and sources of household incomes in the United States (CBO 2024b). An extraordinary finding in this data is the importance of resources transferred to households in the form of Medicaid health insurance coverage. For example, on average between 2017 to 2021, CBO estimates that the value of Medicaid coverage for families in the bottom fifth of the income distribution (the poorest 20% of U.S. families) averaged 70% of their total money income (money income defined as income received from wages, interest, dividends, rents, Social Security, unemployment insurance, Supplemental Security Income, and pensions).
This obviously reflects both the low incomes of these families and the crushing expense of health care in the United States. There is a widespread belief (not universal, but widespread) that the United States should maintain a social contract ensuring that people should not be denied health care simply because they lack income. Medicaid (along with Medicare) is how this social contract is realized in the United States. The tangible, monetary value of maintaining this social contract to low-income American families is often easy to underestimate.
Medicaid is also crucially important for families in the second fifth of the income distribution (those with higher incomes than 20% of households but lower incomes than 60%). Medicaid constitutes roughly 12% of their money income. Even the middle fifth of families receive Medicaid benefits equal to almost 6% of their money incomes. This appearance of Medicaid benefits in households that appear as if they might make too high of an income to qualify reflects in part the volatility of incomes and the churn of households into and out of poverty and qualification for anti-poverty programs in the United States.4 Families that start a year with very low income can qualify for Medicaid, but then if they find high-quality employment for the rest of the year, their incomes can pull them out of the bottom fifth and the amount they receive from Medicaid trails off as their incomes rise to the point that they are no longer eligible for it. 5
A cut of $880 billion to Medicaid—currently on the table in the House Republican budget resolution—would constitute a cut of roughly 10.7% to the program’s projected spending going forward (CBO 2024a). Given the current contribution that Medicaid makes to household incomes in the bottom 40% of the income distribution, we can calculate how much this cut would reduce these incomes. Further, using estimates of the gains to household income stemming from extending the TCJA, we can compare how much the bottom 40% of the income distribution would lose from proposed Medicaid cuts as opposed to how much they’d gain from TCJA extensions.
As Figure 1 shows, the net loss for households in the bottom 40% of income distribution from this policy package is enormous. What is particularly striking is that the proposed Medicaid cuts that would do so much damage to the bottom 40% would only pay for roughly 20% of the total cost of the TCJA extension (Treasury-OTA 2025). More damage would have to be done elsewhere to finance these TCJA extensions.
Cutting Medicaid to pay for tax cuts benefits top 1% while harming the bottom 40%: Change to average household income stemming from proposed Medicaid cuts and extension of Tax Cuts and Jobs Act (TCJA)
| Medicaid cut | TCJA cut | |
|---|---|---|
| Bottom fifth of household income | -7.4% | 0.6% |
| Second fifth of household income | -1.7% | 1.0% |
| Top 1% of household income | 0.0% | 3.9% |

Note: In these estimates, we assume the federal share of Medicaid spending is unaffected by these cuts. In theory, states could make their contribution to Medicaid more generous to make up for federal cuts, but this would require that they raise taxes to do this.
Source: Data on value of Medicaid and household income from Congressional Budget Office (CBO) Distribution of Household Income in 2021. Data on proposed $880 billion in Medicaid cuts on overall Medicaid spending based on CBO data on budget projections. Distribution of gains from extending expiring TCJA provisions from Office Tax Analysis report.
Table 1 provides an estimate of how much the proposed Medicaid cuts would cost the bottom two-fifths of household incomes in every state (The methodology for Table 1 is provided in the appendix.). It also includes estimates for the middle fifth of U.S. households, who also suffer a smaller, but not trivial, cut to their household incomes as well.
Medicaid cuts as share of average household income by state
| Household income ($) | Value of Medicaid ($) | 10.7% Medicaid cut as % of household income | |||||||||
|---|---|---|---|---|---|---|---|---|---|---|---|
| Lowest fifth | Second fifth | Middle fifth | Lowest fifth | Second fifth | Middle fifth | Lowest fifth | Second fifth | Middle fifth | |||
| Alabama | 14,900 | 36,512 | 61,875 | 11,349 | 6,263 | 3,402 | 8.2% | 1.8% | 0.6% | ||
| Alaska | 24,843 | 58,356 | 90,869 | 18,002 | 9,934 | 5,395 | 7.8% | 1.8% | 0.6% | ||
| Arizona | 19,888 | 46,628 | 74,317 | 15,021 | 8,289 | 4,502 | 8.1% | 1.9% | 0.6% | ||
| Arkansas | 15,509 | 35,509 | 58,527 | 17,870 | 9,861 | 5,356 | 12.3% | 3.0% | 1.0% | ||
| California | 22,389 | 56,302 | 94,775 | 18,295 | 10,095 | 5,483 | 8.7% | 1.9% | 0.6% | ||
| Colorado | 24,354 | 56,848 | 90,320 | 14,310 | 7,897 | 4,289 | 6.3% | 1.5% | 0.5% | ||
| Connecticut | 22,368 | 55,886 | 94,085 | 14,519 | 8,012 | 4,352 | 6.9% | 1.5% | 0.5% | ||
| Delaware | 21,900 | 51,046 | 81,933 | 20,918 | 11,543 | 6,270 | 10.2% | 2.4% | 0.8% | ||
| District of Columbia | 16,658 | 58,390 | 105,768 | 15,596 | 8,606 | 4,674 | 10.0% | 1.6% | 0.5% | ||
| Florida | 18,374 | 43,069 | 69,512 | 10,788 | 5,953 | 3,233 | 6.3% | 1.5% | 0.5% | ||
| Georgia | 18,159 | 44,264 | 73,263 | 10,863 | 5,994 | 3,256 | 6.4% | 1.4% | 0.5% | ||
| Hawaii | 25,163 | 61,940 | 98,867 | 15,013 | 8,284 | 4,500 | 6.4% | 1.4% | 0.5% | ||
| Idaho | 21,126 | 46,238 | 71,248 | 10,601 | 5,850 | 3,177 | 5.4% | 1.4% | 0.5% | ||
| Illinois | 19,395 | 48,816 | 81,611 | 14,727 | 8,127 | 4,414 | 8.1% | 1.8% | 0.6% | ||
| Indiana | 18,941 | 43,515 | 69,645 | 13,217 | 7,293 | 3,961 | 7.5% | 1.8% | 0.6% | ||
| Iowa | 20,605 | 46,465 | 73,552 | 13,129 | 7,245 | 3,935 | 6.8% | 1.7% | 0.6% | ||
| Kansas | 20,314 | 45,817 | 72,521 | 8,218 | 4,535 | 2,463 | 4.3% | 1.1% | 0.4% | ||
| Kentucky | 15,214 | 37,298 | 62,511 | 18,379 | 10,142 | 5,509 | 12.9% | 2.9% | 0.9% | ||
| Louisiana | 13,319 | 34,056 | 60,369 | 20,053 | 11,066 | 6,010 | 16.1% | 3.5% | 1.1% | ||
| Maine | 19,054 | 43,673 | 71,224 | 11,987 | 6,615 | 3,593 | 6.7% | 1.6% | 0.5% | ||
| Maryland | 25,616 | 63,084 | 102,686 | 13,468 | 7,432 | 4,037 | 5.6% | 1.3% | 0.4% | ||
| Massachusetts | 21,591 | 57,772 | 100,309 | 14,329 | 7,907 | 4,295 | 7.1% | 1.5% | 0.5% | ||
| Michigan | 18,571 | 43,666 | 71,050 | 14,664 | 8,092 | 4,395 | 8.4% | 2.0% | 0.7% | ||
| Minnesota | 24,319 | 55,036 | 87,403 | 11,708 | 6,461 | 3,509 | 5.2% | 1.3% | 0.4% | ||
| Mississippi | 12,966 | 31,977 | 55,323 | 12,463 | 6,878 | 3,736 | 10.3% | 2.3% | 0.7% | ||
| Missouri | 18,486 | 42,425 | 68,635 | 9,453 | 5,216 | 2,833 | 5.5% | 1.3% | 0.4% | ||
| Montana | 19,022 | 42,228 | 67,891 | 15,203 | 8,389 | 4,557 | 8.6% | 2.1% | 0.7% | ||
| Nebraska | 21,198 | 47,561 | 74,981 | 8,454 | 4,665 | 2,534 | 4.3% | 1.0% | 0.4% | ||
| Nevada | 19,295 | 46,278 | 74,163 | 13,285 | 7,331 | 3,982 | 7.4% | 1.7% | 0.6% | ||
| New Hampshire | 25,946 | 58,737 | 93,899 | 8,621 | 4,757 | 2,584 | 3.6% | 0.9% | 0.3% | ||
| New Jersey | 23,705 | 59,853 | 101,132 | 11,909 | 6,572 | 3,569 | 5.4% | 1.2% | 0.4% | ||
| New Mexico | 14,202 | 35,764 | 60,783 | 21,783 | 12,020 | 6,529 | 16.4% | 3.6% | 1.1% | ||
| New York | 18,049 | 48,281 | 84,687 | 19,023 | 10,497 | 5,702 | 11.3% | 2.3% | 0.7% | ||
| North Carolina | 17,826 | 41,620 | 68,144 | 10,667 | 5,886 | 3,197 | 6.4% | 1.5% | 0.5% | ||
| North Dakota | 19,915 | 47,350 | 76,751 | 7,624 | 4,207 | 2,285 | 4.1% | 1.0% | 0.3% | ||
| Ohio | 17,931 | 42,595 | 69,629 | 14,184 | 7,827 | 4,251 | 8.5% | 2.0% | 0.7% | ||
| Oklahoma | 17,143 | 39,620 | 64,354 | 12,332 | 6,805 | 3,696 | 7.7% | 1.8% | 0.6% | ||
| Oregon | 20,567 | 48,663 | 78,833 | 14,960 | 8,255 | 4,484 | 7.8% | 1.8% | 0.6% | ||
| Pennsylvania | 19,394 | 46,049 | 76,163 | 14,424 | 7,960 | 4,323 | 8.0% | 1.8% | 0.6% | ||
| Rhode Island | 19,353 | 48,915 | 83,474 | 17,299 | 9,546 | 5,185 | 9.6% | 2.1% | 0.7% | ||
| South Carolina | 16,285 | 39,889 | 65,675 | 12,515 | 6,906 | 3,751 | 8.2% | 1.9% | 0.6% | ||
| South Dakota | 20,551 | 45,307 | 71,910 | 7,804 | 4,306 | 2,339 | 4.1% | 1.0% | 0.3% | ||
| Tennessee | 17,039 | 40,468 | 65,950 | 13,063 | 7,208 | 3,915 | 8.2% | 1.9% | 0.6% | ||
| Texas | 19,307 | 46,351 | 76,045 | 9,312 | 5,138 | 2,791 | 5.2% | 1.2% | 0.4% | ||
| Utah | 27,105 | 58,633 | 89,019 | 6,309 | 3,481 | 1,891 | 2.5% | 0.6% | 0.2% | ||
| Vermont | 20,772 | 47,509 | 76,903 | 15,395 | 8,495 | 4,614 | 7.9% | 1.9% | 0.6% | ||
| Virginia | 23,017 | 55,301 | 90,760 | 9,540 | 5,264 | 2,859 | 4.4% | 1.0% | 0.3% | ||
| Washington | 24,873 | 58,096 | 92,714 | 14,213 | 7,843 | 4,260 | 6.1% | 1.4% | 0.5% | ||
| West Virginia | 14,281 | 33,856 | 57,137 | 17,909 | 9,882 | 5,368 | 13.4% | 3.1% | 1.0% | ||
| Wisconsin | 21,559 | 48,014 | 75,473 | 11,333 | 6,254 | 3,397 | 5.6% | 1.4% | 0.5% | ||
| Wyoming | 20,496 | 47,618 | 76,729 | 6,317 | 3,486 | 1,893 | 3.3% | 0.8% | 0.3% | ||
Medicaid cuts will lead to worse health and financial outcomes, particularly for young adults
These extraordinarily steep Medicaid cuts greatly increase the risk that individuals will experience health and financial disruptions that can have serious consequences. Medical bills are one of the largest causes of unpaid debt collections and bankruptcy (CFPB 2014; Himmelstein et al. 2019). For low-income Americans, who often lack the savings or access to the credit necessary to buffer against a financial emergency, these bills and the medical debt they leave behind can be particularly burdensome (Pew Charitable Trusts 2015). By providing access to health care at a reduced cost, Medicaid improves finances directly by making health care more affordable. Since 2010 when the ACA was enacted into law, personal bankruptcy has steadily fallen year over year, and by 2016, fillings were only 50% what they were in 2010 (St. John 2017).
Careful research design methods have also shown that Medicaid expansions passed under the ACA directly led to increased financial security for low-income adults. Using survey data developed by the U.S. Department of Treasury and the FINRA Investor Education Foundation, researchers found that the share of low-income adults with unpaid medical bills declined by twice as much in states that decided to expand Medicaid relative to states that did not (Sojourner and Golberstein 2017).
Moreover, this same study found that low-income adults’ satisfaction with their financial situation increased more in Medicaid expansion states. Other studies have also linked Medicaid expansion to key measures of financial well-being. Using credit report data, researchers found that households living in low-income areas in states that accepted the Medicaid expansion had a lower amount of unpaid balances in collections by $65–$88. Those who gained new Medicaid coverage had a much steeper reduction in unpaid balances (of $1,140) (Hu et al. 2018). A Federal Reserve study found that, for counties with high uninsurance rates, Medicaid expansion led to less debt being sent to collection agencies, compared with similar counties in non-expansion states (Dussault, Pinkovskiy, and Zafar 2016). In short, the Medicaid expansions put into law by the passage of the Affordable Care Act clearly boosted the economic security of lower-income adults, making their lives less stressful.
Medicaid can also reduce health care costs indirectly by lowering the barrier for access to care, which improves health and can prevent more expensive care being needed down the line. This is particularly important for young adults, a group that receives notably stingy benefits from the current U.S. system of income support and social insurance. Prior to the ACA, young adults were often caught in limbo in their ability to secure decent health insurance coverage, having aged out of their parents’ plans but not being able to land a job with health care benefits.
For example, in the years prior to the ACA, nearly 30% of young adults were uninsured, and this uninsurance meant they often put off care: 76% of uninsured young adults reported cost-related access problems, such as not filling a prescription; skipping a medical test, treatment, or follow-up; having a medical problem but not seeing a doctor or going to a clinic; not seeing a specialist when needed; and delaying or not getting needed dental care (Davis 2010). Consequently, young adults too often didn’t seek care until a medical problem became severe, a delay that can lead to bigger costs down the line. In that same survey, 59% of uninsured young adults reported having a medical bill problem or outstanding debt.
In 2010, the ACA allowed young people to remain on their parents’ plans until they were 26. This change reduced uninsurance by 10.6 percentage points among young adults with middle-income parents; and by 9.1 percentage points among young adults with high-income parents. However, it wasn’t until the ACA Medicaid expansions took effect in 2014 that that low-income adults’ rate of uninsurance declined by 8.9 percentage points, as well (McMorrow et al. 2015). This ability to access affordable care had a substantial impact on their health.
Medicaid is crucial for the health of rural hospitals and communities
For rural areas, Medicaid is a lifeline both for the community and the health care institutions supporting that community (including by providing jobs). Rural areas are characterized by unique health and health insurance challenges, including lower access to job-based coverage, greater prevalence of self-employed jobs (such as farming and contracting), lower incomes, and a greater share of people with a disability (CBPP 2013).
Before the ACA was passed, rural residents made up a disproportionate share of the uninsured. The coverage provisions of the ACA —including Medicaid expansion— disproportionately benefited rural residents. Between 2013 and 2015, the uninsured rate among nonelderly rural adults dropped by 7 percentage points in states accepting the ACA Medicaid expansions compared with 4 percentage points in non-expansion states (Cross-Call et al. 2017).
Children and families across all states rely on Medicaid, but coverage is greatest in the South and the West. Figure 2, reproduced from the Georgetown University McCourt School of Public Policy, displays Medicaid and the Children’s Health Insurance Program (Medicaid for kids) coverage for children in rural and metro areas throughout the country for 2023 (Georgetown University CCF 2023). In six states—Arizona, Arkansas, Florida, Louisiana, New Mexico, and South Carolina— Medicaid/CHIP covers over half of all children in small towns and rural areas.
Medicaid coverage for children in metro and small town/rural area counties, 2023
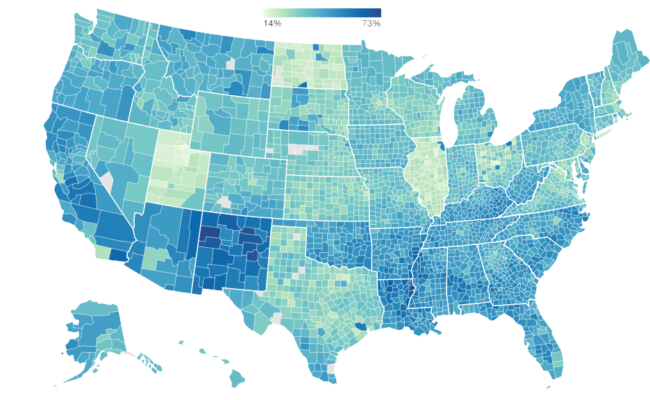
Source: Reproduced from Georgetown University Center for Children and Families county-level Medicaid/CHIP coverage estimates based on Georgetown CCF analysis of American Community Survey (ACS) Public Use Microdata Sample, accessed Feb 20, 2025.
Across the country, Medicaid remains a dominant source of coverage for children in rural areas. On the East Coast in New York and Pennsylvania, Medicaid covers 43.5% and 37.3% percent of rural children, respectively. For Missouri and Nebraska in the Midwest, Medicaid/CHIP coverage for children in rural areas is 38.3% and 32.7%, respectively. On the West Coast in Alaska and California, Medicaid/CHIP coverage for children in rural areas is 39.4% and 49.1%, respectively. In the South, the contrast between Texas and Louisiana is stark, with Texas remaining a holdout from the ACA Medicaid expansions and Louisiana having accepted these expansions in 2014. In Texas, Medicaid/CHIP coverage for kids in rural areas was 33.1%, but in Louisiana, Medicaid/CHIP coverage was almost two times as high at 57.7%.
Rural hospitals also substantially benefited from Medicaid expansion. Rural hospitals serve areas with higher rates of uninsured patients and, as a result, have higher rates of uncompensated care, which increases financial stress on these hospitals. Following the expansion of Medicaid, in 2019, researchers found that operating margins (a summary measure of financial viability for hospitals) in rural hospitals were larger relative to those in states that didn’t expand Medicaid. Median operating margins in rural hospitals that expanded Medicaid were around 2.0% compared with 0.3% for states that did not expand Medicaid (Levinson, Godwin, and Hulver 2023). Given how low operating margins in rural hospitals can be, access to Medicaid can be the difference in rural hospitals being able to stabilize their balance sheets instead of operating at a loss and eventually having to close down.
The threat of rural communities losing their hospitals entirely is not idle. Between 2010 and 2021, 136 rural hospitals closed down throughout the United States. Of these, nearly three-quarters (74%) were in the minority of states that had not accepted the Medicaid expansion provisions of the ACA (AHA 2022).
Medicaid is a powerful investment in the future of the workforce, and cuts might even cost the federal government in the long run
Since the goal of Medicaid is to ensure access to health care and long-term care for low- and moderate-income Americans and people with disabilities, it is not surprising that the program has positive effects on participants’ health and financial well-being and provides critical funding to providers who serve vulnerable populations. But Medicaid is not just a transfer of current resources. It is also an investment in the future workforce with notably high rates of return. When kids have access to Medicaid, they have better educational and labor market outcomes, which translate directly into higher lifetime tax payments out of higher wages. This, in turn, significantly blunts the long-run net cost of Medicaid benefits for children. Additionally, kids with access to Medicaid will become healthier and higher-wage adults who are less likely to draw on health and disability programs as adults, providing another budget offset to Medicaid investments.
Goodman-Bacon (2021) analyzed differences between states in welfare-based eligibility for Medicaid after its enactment in 1965 to estimate long-run effects of childhood eligibility on health, employment, and receipt of government benefits. The study estimates that access to Medicaid in childhood reduced the number of older adults receiving disability benefits by 1.2 million between 2000 and 2014. In all, the study concludes that Medicaid “saved the government more than its original cost and saved more than 10 million quality adjusted life years.” (Goodman-Bacon 2021). If future Medicaid cuts symmetrically reverse these effects, then estimated cost savings will be significantly eroded in future years and decades as kids deprived of access to health coverage grow up more likely to suffer from lower educational attainment, higher rates of disability benefit receipt, weaker labor force attachment, and lower wages (and resulting tax payments). It is the definition of a penny-wise, pound-foolish approach to budgeting.
Similarly, Brown, Kowalski, and Lurie (2020) documented positive effects of childhood Medicaid participation on the health, education, and earnings of young adults. These lead to higher tax payments and lower receipt of the Earned Income Tax Credit (EITC), with taxpayers recouping 58 cents of each dollar spent on Medicaid participation in childhood, not counting potential cost savings in future years or from reductions in spending on health benefits or on means-tested benefits other than EITC (Brown, Kowalski, and Lurie 2020).
These “fiscal externalities” from changing Medicaid coverage are well known and validated by Congressional Budget Office (CBO) findings. In a recent paper, they found that common methods proposed to cut Medicaid spending would save the federal government far less money than is commonly thought (Ash et al. 2023). These methods include making Medicaid a “block grant” to states. (This money would be entirely under state control with capped funding.) For example, the CBO found that various permutations of block-grant proposals for Medicaid could see between 51% and 266% of total static “savings” reversed by the fiscal externalities identified above. That is, if cuts fall heavily on children and these cuts lead to them growing up and earning less money in the labor market and being more likely to draw on other benefit programs later in life, the short-run budget savings could easily be entirely reversed in the long run.
One political challenge to making these research findings salient is timescale. The savings from more-generous Medicaid coverage (or the dissavings from Medicaid cuts) take decades to occur. Incorporating these important research findings into near-term budget debates requires policymakers to prioritize being good stewards of the future rather than responding to short-term demands.
Medicaid cuts would make the U.S. more vulnerable to recession
A Medicaid cut of $880 billion would be macroeconomically significant. All else equal, it would represent a drag on economic growth of about 0.5% (which would, in turn, increase unemployment by about 0.3 percentage points—leaving about 550,000 people involuntarily jobless). This drag on growth would occur due to reduced economywide spending. As people skipped going to the doctor, this would reduce spending on medical care, and for those who continued going even with less generous Medicaid coverage, their out-of-pocket costs would rise and crowd out spending on other items.
The depressing effects of Medicaid cuts on economywide spending generally are very large relative to other policy interventions. Previous research has highlighted that changes to Medicaid’s benefits translate powerfully into large changes in household spending. The reason for this is obvious. Families that qualify for Medicaid do very little saving, essentially living paycheck to paycheck. When their income rises or falls, this translates instantly into higher or lower spending by this group. One particularly high-quality assessment of the effect of changing Medicaid spending on the macroeconomy found extraordinarily large “multipliers,” increments to economic growth and employment stemming from Medicaid change (Chodorow-Reich et al. 2012). These multipliers were as large as 2, meaning that each $1 cut from Medicaid translated into a $2 reduction in overall gross domestic product (GDP), stemming from the reduced household spending spurred by the Medicaid cut.
Further, the tax cuts that these Medicaid spending cuts would help finance would do little to counteract this drag. It is well known that tax cuts that disproportionately raise incomes at the top of the distribution do little to boost economywide spending (Bivens and Fieldhouse 2012). The reason for this weak boost is that spending by richer households responds less to changes in current income. These households save a good part of their income, so giving them more income means lots of this boost “leak” away from spending.
All this means that a policy package combining lower taxes mostly on high-income households with Medicaid spending cuts would have noticeable effects in reducing economywide spending. All else equal, this would show up as higher unemployment and slower growth. Over the next few years, it is true that the Federal Reserve would have the ability to counteract this drag on growth by pulling down the interest rates it controls (the federal funds rate). But it would have to pull down rates by about half of their current value, going from roughly 4.25% to closer to 2.5%. This would constitute a significant draining of the Fed’s capacity to counteract other recessionary shocks, should they appear. Essentially, the Fed would be forced to spend almost half of its anti-recessionary ammunition simply to accommodate a policy package of lower taxes for the richest households combined with steep spending cuts for the most vulnerable. This policy package is ugly enough on fairness grounds, but the fact that it also comes with a squandering of readiness for the next recession layers another injury on top of it.
Conclusion
Low taxes for the rich and for corporations is the highest legislative priority of the Trump administration and congressional Republicans. To get there, they are willing to cut federal programs that are utterly vital to the incomes and security of vulnerable families. These cuts will not just cause harm to individual families, they will cascade, leading to hospital closures in rural counties, higher medical debt, lower earnings from future workers who will suffer from poorer health decades from now, and could even put upward pressure on federal budget deficits in the long run. In the very near term, these cuts will make the United States economy far more vulnerable to any recessionary shock. Nothing about this policy package—tax cuts mostly for the rich and benefit cuts for the vulnerable—is good for the vast majority of families in this country.
Appendix
Appendix table methodology
CBO (2024b) provides data on the components of income by household income quintile. We specifically use the CBO series on “households ranked by income before taxes and transfers.” We then construct an estimate of money income that would match the income concepts used in the household income variables of the American Community Survey (ACS). This money income variable from the ACS includes income from the following sources: wages, interest payments, dividends, rental income, pensions, Social Security, Supplemental Security income, unemployment insurance, and other cash transfers (like receipt of Temporary Assistance to Needy Families). The CBO data include all these categories except other cash transfers, which it bundles together with other non-cash transfers. Given how small these other cash transfers are, however, we leave this CBO component out of our analysis and think it cannot affect our estimates much.
When we calculate household money income by fifth in the CBO data and compare it with ACS data, we find a very close match in the second and middle fifth. For the bottom fifth, the CBO money income measure is larger by almost 12%. This is almost certainly driven by the fact that the CBO undertakes many data corrections and adjustments to account for the well-known problem of underreporting of transfer income in household surveys like the ACS. Given that a higher reported income for the bottom fifth actually reduces the importance of Medicaid for this group, using the CBO bottom-fifth income for our anchor in Table 1 is actually conservative, so we continue with it.
Matching CBO household income data to ACS concepts
| Lowest fifth | Second fifth | Middle fifth | |
|---|---|---|---|
| CBO data, ACS concepts | 17,300 | 41,320 | 67,560 |
| ACS data | 15,464 | 41,479 | 69,278 |
Source: 5-year 2021 ACS mean income by household quintiles and CBO (2024a).
We take the value of Medicaid divided by money income for households in the bottom two-fifths nationally from the CBO data. We then assume this national value varies across states in proportion to how their state’s Medicaid enrollment share (Medicaid enrollment divided by state population) compares with the national Medicaid enrollment share. This lets us assign a state-specific value of Medicaid relative to money income for the bottom two-fifths in every state. From there, we can assess the impact of a 10.7% cut to Medicaid by income fifth by state.
Notes
1. See Bivens (2025) for why the current macroeconomic situation means that such a large tax cut will inevitably put downward pressure on living standards for the vast majority of Americans, regardless of how it’s financed.
2. The budget resolution calls for the Energy and Commerce committee to cut spending by $880 billion over 10 years (but cuts to Medicare are ruled out). This committee has jurisdiction over Medicaid, and it is, by far, the single biggest program in their jurisdiction that they have been given permission to cut. It would be near mathematically impossible to spare Medicaid of any cuts given the overall size of the cut.
3. Social Security may well be responsible for keeping more people out of poverty, but Social Security is also a broad-based pension and insurance program. Its broad base provides extremely valuable benefits but also means it directs a smaller share of its resources specifically to alleviating poverty.
4. Other reasons for this might be simple misreporting or the fact that the CBO data are based on households, but Medicaid eligibility is hinged more on family income. One could have multiple families living in one household, with the total income of the household looking too high to qualify for Medicaid but the incomes of the individual families allowing them to qualify.
5. Ideally, they would smoothly qualify for very generous subsidies to purchase health insurance in the Affordable Care Act marketplace “exchanges.”
References
American Hospital Association (AHA). 2022. Rural Hospital Closures Threaten Access: Solutions to Preserve Care in Local Communities. American Hospital Association, September 2022.
Ash, Elizabeth, Wiliam Carrington, Rebecca Heller, and Grace Hwang. 2023. “Exploring the Effects of Medicaid During Childhood on the Economy and the Budget.” Working Paper Series Congressional Budget Office, Working Paper 2023-07, November 2023.
Bivens, Josh. 2025. There Will Be Pain: Continuing Low Tax Rates for the Rich and Corporations Will Hurt Working Families. Economic Policy Institute, February 2025.
Bivens, Josh, and Andrew Fieldhouse. 2012. A Fiscal Obstacle Course, Not a Cliff: Economic Impacts of Expiring Tax Cuts and Impending Spending Cuts, and Policy Recommendations. Economic Policy Institute, September 2012.
Brown, David W., Amanda E. Kowalski, and Ithai Z. Lurie. 2020. “Long-Term Impacts of Childhood Medicaid Expansions on Outcomes in Adulthood.” Review of Economic Studies 87, no. 2: 792–821. doi: 10.1093/restud/rdz039.
Center on Budget and Policy Priorities (CBPP). 2013. Rural America Will Benefit from Medicaid Expansion (fact sheet). June 7, 2013.
Chodorow-Reich, Gabriel, Laura Feiveson, Zachary Liscow, and William Gui Woolston. 2012. “Does State Fiscal Relief During Recessions Increase Employment? Evidence from the American Recovery and Reinvestment Act” American Economic Journal: Economic Policy 4, no. 3: 118–145. http://dx.doi.org/10.1257/pol.4.3.118.
Congressional Budget Office (CBO). 2024a. Budget and Economic Data. https://www.cbo.gov/data/budget-economic-data#3.
Congressional Budget Office (CBO). 2024b. The Distribution of Household Income in 2021. Publication no. 60341, September 11, 2024.
Consumer Financial Protection Bureau (CFPB). 2014. Consumer Credit Reports: A Study of Medical and Non-Medical Collections. December 2014.
Cross-Call, Jesse, Tara Straw, Arloc Sherman, and Matt Broaddus. 2017. House-Passed Bill Would Devastate Health Care in Rural America. Center on Budget and Policy Priorities, May 16, 2017.
Davis, Karen. 2010. A New Era in American Health Care: Realizing the Potential of Reform. Commonwealth Fund Publication no. 1419, June 2010.
Dussault, Nicole, Maxim L. Pinkovskiy, and Basit Zafar. 2016. “Is Health Insurance Good for Your Financial Health?” (blog post). Liberty Street Economics, Federal Reserve Bank of New York, June 6, 2016.
Georgetown University Center for Children and Families. 2023. “Medicaid Coverage in Metro and Small Town/Rural Counties, 2023” [interactive data], Georgetown University McCourt School of Public Policy, 2023.
Goodman-Bacon, Andrew. 2021. “The Long-Run Effects of Childhood Insurance Coverage: Medicaid Implementation, Adult Health, and Labor Market Outcomes.” American Economic Review 111, no. 8: 2550–2593. doi: 10.1257/aer.20171671.
Himmelstein, David U., Robert M. Lawless, Deborah Thorne, Pamela Foohey, and Steffie Woolhandler. 2019. “Medical Bankruptcy: Still Common Despite the Affordable Care Act.” American Journal of Public Health 109, no. 3: 431–433. doi: 10.2105/AJPH.2018.304901.
Hu, Luojia, Robert Kaestner, Bhashkar Mazumder, Sarah Miller, and Ashley Wong. 2018. “The Effect of the Affordable Care Act Medicaid Expansions on Financial Wellbeing.” Journal of Public Economics 163, 99–112. https://doi.org/10.1016/j.jpubeco.2018.04.009.
Levinson, Zachary, Jamie Godwin, and Scott Hulver. 2023. Rural Hospitals Face Renewed Financial Challenges, Especially in States That Have Not Expanded Medicaid. KFF, February 23, 2023.
McMorrow, Stacey, Genevieve M. Kenney, Sharon K. Long, and Nathaniel Anderson. 2015. “Uninsurance Among Young Adults Continues to Decline, Particularly in Medicaid Expansion States.” Health Affairs 34, no. 4: 616–620.
https://doi.org/10.1377/hlthaff.2015.0044.
Pew Charitable Trusts. 2015. The Role of Emergency Savings in Family Financial Security: What Resources Do Families Have for Financial Emergencies? November 2015.
Sojourner, Aaron, and Ezra Golberstein. 2017. “Medicaid Expansion Reduced Unpaid Medical Debt and Increased Financial Satisfaction.” Health Affairs Blog, July 24, 2017.
St. John, Allen. 2017. “How the Affordable Care Act Drove Down Personal Bankruptcy: Expanded Health Insurance Helped Cut the Number of Filings by Half.” Consumer Reports, May 2, 2017.
U.S. Department of Treasury, Office of Tax Analysis (Treasury-OTA). The Cost and Distribution of Extending Expiring Provisions of the Tax Cuts and Jobs Act of 2017. Office of Tax Analysis, January 10, 2025.