Full Report
Republican majorities in Congress and President Trump will soon legislate to extend expiring provisions of the 2017 tax law, commonly called the Tax Cuts and Jobs Act (TCJA). These extensions will lock in lower individual income and estate tax rates, with benefits disproportionately accruing to higher-income households. Further, the corporate income tax rate cuts that were part of the 2017 law will remain indefinitely—and there is some talk of providing corporations even deeper tax cuts.
This report highlights that efforts to keep tax rates low for the rich and corporations will likely result in sharper trade-offs now than in past episodes of tax cuts. No matter how these tax cuts are financed this time around, there will likely be noticeable economic pain for most working families in the United States. The most damaging method of financing these continued low rates for the rich and corporations would be spending cuts. But even deficit financing—which caused no pain earlier in the 2000s when used to finance tax cuts for the rich and corporations—has the clear potential to drag on economic growth this time around.
More specifically, we find:
- Despite a quarter-century downward ratcheting of federal revenue, the U.S. today has a fiscal gap—the amount of spending cuts or tax increases needed to stabilize the ratio of public debt to gross domestic product (GDP)—that is entirely manageable (roughly 2.1% of GDP).
- Extending the expiring provisions of the TCJA, however, would raise this fiscal gap to roughly 3.3% of GDP, making it substantially harder to close.
- The macroeconomic situation is much different today than it was in 2001 or 2017. This means that higher deficits are more likely to put a drag on growth going forward.
- While it would be good to reduce budget deficits going forward, the “how” matters as much as the “how much.” Deficit reduction via progressive tax increases would provide likely benefits for most Americans. Deficit reduction via spending cuts or the substitution of more regressive taxes would not.
- Spending cuts on the order needed to finance the expiration of TCJA provisions would do great damage to the economic security of working families.
- The distribution of federal government spending is extremely progressive—mostly serving to boost incomes and living standards of low- and moderate-income, highly vulnerable households.
- Cuts to key social insurance and income support programs like Supplemental Nutrition Assistance Program (SNAP, commonly called food stamps) or Medicaid would do substantial damage to the nation’s future workforce by depriving millions of children today of key health and developmental supports.
- Further, cuts of this size, if phased in quickly, would at minimum require the Federal Reserve to aggressively cut interest rates to avoid a recession, and could quite easily overwhelm any attempt by the Fed to buffer the economy from their effect, leading to recession and job losses.
Today’s fiscal situation
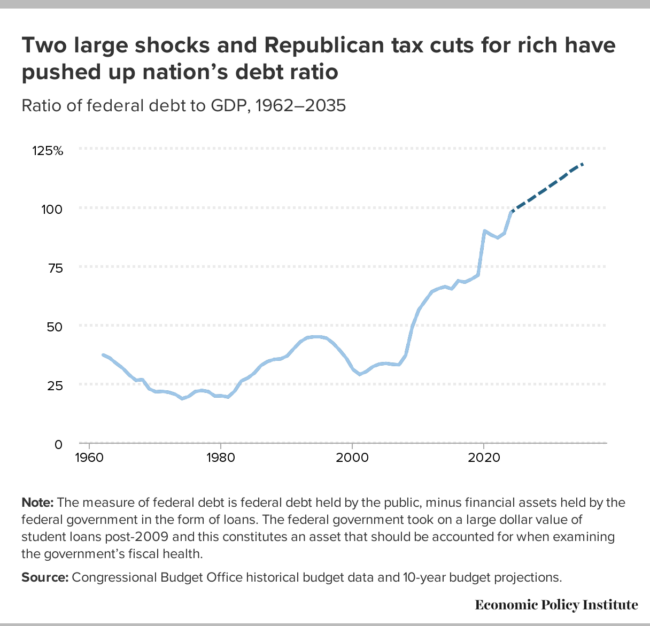
The most commonly used metric of the nation’s fiscal position is the ratio of federal government outstanding debt to overall gross domestic product (GDP), a measure sometimes known as the debt ratio (shown in Figure A).
Two large shocks and Republican tax cuts for rich have pushed up nation’s debt ratio: Ratio of federal debt to GDP, 1962–2035
| Debt to GDP | Debt to GDP | |
|---|---|---|
| 1962 | 37.3% | 37.3% |
| 1963 | 36.0% | 36.0% |
| 1964 | 33.7% | 33.7% |
| 1965 | 31.6% | 31.6% |
| 1966 | 28.7% | 28.7% |
| 1967 | 26.5% | 26.5% |
| 1968 | 26.8% | 26.8% |
| 1969 | 22.9% | 22.9% |
| 1970 | 21.6% | 21.6% |
| 1971 | 21.8% | 21.8% |
| 1972 | 21.4% | 21.4% |
| 1973 | 20.5% | 20.5% |
| 1974 | 18.7% | 18.7% |
| 1975 | 19.6% | 19.6% |
| 1976 | 21.7% | 21.7% |
| 1977 | 22.2% | 22.2% |
| 1978 | 21.7% | 21.7% |
| 1979 | 19.8% | 19.8% |
| 1980 | 19.9% | 19.9% |
| 1981 | 19.4% | 19.4% |
| 1982 | 21.9% | 21.9% |
| 1983 | 26.2% | 26.2% |
| 1984 | 27.5% | 27.5% |
| 1985 | 29.6% | 29.6% |
| 1986 | 32.8% | 32.8% |
| 1987 | 34.5% | 34.5% |
| 1988 | 35.4% | 35.4% |
| 1989 | 35.6% | 35.6% |
| 1990 | 36.9% | 36.9% |
| 1991 | 40.0% | 40.0% |
| 1992 | 42.9% | 42.9% |
| 1993 | 44.6% | 44.6% |
| 1994 | 45.0% | 45.0% |
| 1995 | 45.0% | 45.0% |
| 1996 | 44.4% | 44.4% |
| 1997 | 42.2% | 42.2% |
| 1998 | 39.2% | 39.2% |
| 1999 | 35.8% | 35.8% |
| 2000 | 31.1% | 31.1% |
| 2001 | 29.0% | 29.0% |
| 2002 | 30.2% | 30.2% |
| 2003 | 32.3% | 32.3% |
| 2004 | 33.4% | 33.4% |
| 2005 | 33.7% | 33.7% |
| 2006 | 33.3% | 33.3% |
| 2007 | 33.1% | 33.1% |
| 2008 | 37.1% | 37.1% |
| 2009 | 49.2% | 49.2% |
| 2010 | 56.5% | 56.5% |
| 2011 | 60.4% | 60.4% |
| 2012 | 64.2% | 64.2% |
| 2013 | 65.5% | 65.5% |
| 2014 | 66.3% | 66.3% |
| 2015 | 65.3% | 65.3% |
| 2016 | 68.8% | 68.8% |
| 2017 | 68.2% | 68.2% |
| 2018 | 69.5% | 69.5% |
| 2019 | 71.2% | 71.2% |
| 2020 | 90.1% | 90.1% |
| 2021 | 88.3% | 88.3% |
| 2022 | 87.1% | 87.1% |
| 2023 | 89.0% | 89.0% |
| 2024 | 97.8% | 97.8% |
| 2025 | 99.9% | |
| 2026 | 101.7% | |
| 2027 | 103.4% | |
| 2028 | 105.4% | |
| 2029 | 107.2% | |
| 2030 | 109.2% | |
| 2031 | 111.1% | |
| 2032 | 113.0% | |
| 2033 | 115.3% | |
| 2034 | 117.1% | |
| 2035 | 118.5% |

Note: The measure of federal debt is federal debt held by the public, minus financial assets held by the federal government in the form of loans. The federal government took on a large dollar value of student loans post-2009 and this constitutes an asset that should be accounted for when examining the government’s fiscal health.
Source: Congressional Budget Office historical budget data and 10-year budget projections.
This is far from a perfect measure of the federal government’s fiscal health, but a general rule of thumb is that this measure should not grow rapidly when the economy is healthy.1 The reasoning is that when the economy is at full employment—when spending is strong enough to keep the nation’s resources (particularly workers) fully employed—then taxes should be high enough to mostly cover what the government spends money on. If instead the federal government spends out more than it takes in when overall spending is strong enough to ensure full employment, this will generate inflationary pressures. The outcome will either be price inflation or the Fed will begin raising interest rates to tamp down private-sector demand.
But for most of the last quarter-century this reasoning has largely not held. Instead, the economy has operated for much of this time with spending significantly below what was needed to ensure full employment. During these times of slack aggregate demand, increases in debt were not just tolerable, they actively helped push the economy back closer to full health.2 The two large spikes in the debt ratio apparent on the graph after 2000 stem from two such emergencies: the global financial crisis of the late 2000s and the COVID-19 pandemic. The accompanying debt booms were affirmatively good things for the welfare of U.S. households, as they financed critical economic recovery measures.
Less apparent in Figure A but more important for the long-run fiscal health of the nation is the result of a steady ratcheting down of federal tax revenue since 2001. President George W. Bush and then-President Donald Trump presided over large tax cuts disproportionately skewed to benefit the rich and corporations in 2001, 2003, and 2017. The strain these tax cuts put on the nation’s fiscal stance is hard to overstate: Without these tax cuts the U.S. would have a fully sustainable fiscal situation today and roughly $500 billion on top of that each year to spend on socially useful public investments.
To see this, note that in 2010 the Congressional Budget Office (CBO) projected an “extended baseline scenario” where the tax cuts of the Bush administration expired as they were originally scheduled to do. Also, the CBO was of course also not including the effects of the 2017 tax cuts in its 2010 projection. They estimated that federal revenue would equal 20.6% of GDP in 2019.3 But because most of the Bush tax cuts eventually were made permanent and then the first Trump administration layered on tax cuts on top of them, actual revenue in 2019 turned out to be more than four percentage points of GDP lower (16.3%) than the CBO projection. In 2024 dollars these 4.3 percentage points of foregone revenue amount to more than $1 trillion.
Kogan and Vela (2024) have estimated that going forward the U.S. has a fiscal gap of roughly 2.1% of GDP. The fiscal gap represents the combination of spending cuts or tax increases that would be necessary to keep the debt ratio stable going forward. The revenue erosion caused by successive Republican administrations cutting taxes for the richest households can fully account for today’s fiscal gap (and then some). And yet even with this quarter-century downward ratcheting of federal revenue, today’s fiscal gap is eminently manageable without doing large harm to working families. In fact, the tax gap—or the estimate of taxes that are owed but not paid each year—is currently larger the nation’s overall fiscal gap.4 This tax gap, in turn, is driven by the richest households and businesses in the country paying less than they owe under the law.5
If the expiring provisions of the TCJA are renewed, the fiscal gap would rise to roughly 3.3% of GDP (Kogan and Vela 2024)6—exceeding the size of the tax gap. This would generally make it significantly harder to close; it would require boosting the size of tax increases or spending cuts needed to close it by more than 50%.
Today’s macroeconomic situation will make tax cuts more costly this time
The major tax cuts of 2001, 2003, and 2017 occurred during times when the U.S. economy remained hampered by too slack aggregate demand—meaning that spending by households, businesses, and governments was too low to fully employ all of the economy’s resources (particularly labor). In 2001, the stock market bubble burst caused a shallow but stubborn labor market recession that lasted well past 2003. In 2017, a steady but too slow labor market recovery since 2010 had still left the unemployment and labor force participation rates depressed relative to where they should have been. Besides measures of labor market distress (elevated unemployment and depressed prime-age employment to population ratios), low and falling inflation and interest rates were key signs that aggregate demand was overly slack. In all of these years interest rates effectively hovered near zero.
The 2001, 2003, and 2017 tax cuts were all deficit-financed. However, because they were enacted during times of aggregate demand slack, they did not drag on economic growth. In fact, they provided some useful macroeconomic stimulus in those years. This stimulus was extremely inefficient when graded in terms of economic activity generated per dollar increase in the deficit.7 Measures that transfer money to low- and moderate-income households are much more efficient stimulus, as these households are far more likely to spend rather than save extra disposable income.
Today, however, the U.S. does not need macroeconomic stimulus. Unemployment has been at or below 4.2% since November 2021, the longest stretch of unemployment this low since the Vietnam War. Further, as shown in Figure B, both inflation and interest rates are substantially higher in 2024 than what prevailed during the years of previous Republican tax cuts. Because the economy has enough aggregate demand today, large, deficit-financed tax cuts would likely instead push aggregate demand above the economy’s capacity to produce. This will either manifest as inflation or (if the Federal Reserve intervenes quickly and forcefully to forestall upward pressure on inflation) higher interest rates. Higher interest rates would crowd out private-sector investment as the cost of borrowing to finance these investments would rise. Over time, the depressed investment would slow economic growth as future generations of workers have less capital to work with.
Previous rounds of Republican tax cuts for the rich came online in very weak economies: Inflation and 10-year Treasury interest rates (%) in 2001–2003, 2017, and 2024
| 10-year Treasury interest rate | Inflation | |
|---|---|---|
| 2001–2003 | 2.0% | 1.8% |
| 2017 | 0.9% | 1.9% |
| 2024 | 5.0% | 2.5% |
Note: Because the tax cuts enacted under the George W. Bush administration were in both 2001 and 2003, we average interest rates and inflation for the 2001–2003 period.
Source: Congressional Budget Office historical economic data.
Crowding out of private-sector investment due to higher deficits is not always a major concern, but it could be in coming years, especially if a new round of low taxes for rich households is enacted. For example, if deficits are run to finance large increases in public-sector investment or to subsidize private-sector investments that would be otherwise under provided due to market failures—like investments in green energy generation—then the crowding out of private-sector investments does not lead to lower investment levels overall in the economy; investments just shift. If this shift leads to more capital that generates greenhouse gas abatements (like clean energy generation) and less “conventional” capital that generally supports higher greenhouse gas emissions, this shift can be very useful. But deficits run simply to finance low taxes for rich households and corporations across the board simply crowd out private-sector investment.
Further, recent years have seen a large burst of private-sector investment activity aimed at transitioning to a less fossil fuel-intensive economy.8 This burst has been aided by technological advances reducing the cost of clean energy generation, but it has also been pushed forward by policy measures undertaken by the Biden administration (mostly the Inflation Reduction Act). Once clean energy infrastructure is built and running, it would be essentially cost competitive with fossil fuel-generated energy along many dimensions. But building out this green energy infrastructure is very capital-intensive—wind turbines, solar farms, and geothermal wells need land and materials purchased and assembled. The financing of this activity is highly sensitive to interest rates. If tax cuts for the rich and corporations are deficit-financed and raise interest rates over coming years, this could provide one more roadblock to the swift transition to less carbon-intensive economic production, layering on yet another cost of these cuts.
All these considerations mean that keeping deficits in check and reducing the debt ratio in coming years would be desirable (the obvious exception to this is if something triggered a recession, in which case the normal prescription to use higher debt levels to finance recovery measures would absolutely hold). But from the perspective of maximizing the welfare of low- and middle-income working families, the “how” of deficit reduction matters every bit as much as the “how much.” If deficits are kept in check by collecting more in revenue from affluent households and corporations, then most U.S. households would benefit. If deficits are instead kept in check through sharp cuts to spending programs or by shifting the tax burden to moderate-income families—say by raising steep, across-the-board tariffs—then most Americans will experience declines in income and welfare.
Recommendations for first-, second-, and third-best fiscal solutions
In our view, the United States’ social insurance and income support are currently too stingy and the country needs a substantial boost to public investment to increase the economy’s productivity. Most of these expansions to public investment and the welfare state should be paid for with higher federal revenue, which should disproportionately come from the richest households and corporations.
A better measure for understanding why the U.S. should reduce rather than boost deficits going forward from 2024 is the ratio of inflation-adjusted debt service (or interest payments) to GDP, shown in Figure C. This real debt service metric shows how much the nation has to pay each year to service its accumulated debt. This metric avoids many of the problems of the debt ratio: It compares a flow with a flow, it accounts for the level of interest rates, and it is not backwards looking. Crucially, after decades of being an extremely modest burden, this measure has been edging up sharply in recent years (even as the recent episode of inflation eroded public debt significantly) and is forecast to rise even faster.
A better measure of fiscal pressure indicates manageable but growing burden: Ratio of real debt service payments to GDP, 1962–2035
| Year | Real debt service payments as % of GDP | Real debt service payments as % of GDP |
|---|---|---|
| 1962 | 0.90% | 0.90% |
| 1963 | 0.87% | 0.87% |
| 1964 | 0.74% | 0.74% |
| 1965 | 0.76% | 0.76% |
| 1966 | 0.68% | 0.68% |
| 1967 | 0.68% | 0.68% |
| 1968 | 0.60% | 0.60% |
| 1969 | 0.58% | 0.58% |
| 1970 | 0.62% | 0.62% |
| 1971 | 0.64% | 0.64% |
| 1972 | 0.67% | 0.67% |
| 1973 | 0.62% | 0.62% |
| 1974 | 0.63% | 0.63% |
| 1975 | 0.68% | 0.68% |
| 1976 | 0.81% | 0.81% |
| 1977 | 0.84% | 0.84% |
| 1978 | 0.88% | 0.88% |
| 1979 | 0.87% | 0.87% |
| 1980 | 0.97% | 0.97% |
| 1981 | 1.16% | 1.16% |
| 1982 | 1.50% | 1.50% |
| 1983 | 1.63% | 1.63% |
| 1984 | 1.90% | 1.90% |
| 1985 | 2.10% | 2.10% |
| 1986 | 2.16% | 2.16% |
| 1987 | 2.14% | 2.14% |
| 1988 | 2.25% | 2.25% |
| 1989 | 2.33% | 2.33% |
| 1990 | 2.40% | 2.40% |
| 1991 | 2.53% | 2.53% |
| 1992 | 2.57% | 2.57% |
| 1993 | 2.48% | 2.48% |
| 1994 | 2.36% | 2.36% |
| 1995 | 2.57% | 2.57% |
| 1996 | 2.61% | 2.61% |
| 1997 | 2.47% | 2.47% |
| 1998 | 2.24% | 2.24% |
| 1999 | 1.99% | 1.99% |
| 2000 | 1.78% | 1.78% |
| 2001 | 1.54% | 1.54% |
| 2002 | 1.23% | 1.23% |
| 2003 | 1.06% | 1.06% |
| 2004 | 1.09% | 1.09% |
| 2005 | 1.17% | 1.17% |
| 2006 | 1.34% | 1.34% |
| 2007 | 1.31% | 1.31% |
| 2008 | 1.40% | 1.40% |
| 2009 | 0.89% | 0.89% |
| 2010 | 0.69% | 0.69% |
| 2011 | 0.87% | 0.87% |
| 2012 | 0.70% | 0.70% |
| 2013 | 0.72% | 0.72% |
| 2014 | 0.62% | 0.62% |
| 2015 | 0.50% | 0.50% |
| 2016 | 0.67% | 0.67% |
| 2017 | 0.80% | 0.80% |
| 2018 | 1.11% | 1.11% |
| 2019 | 1.33% | 1.33% |
| 2020 | 1.07% | 1.07% |
| 2021 | 0.90% | 0.90% |
| 2022 | 1.38% | 1.38% |
| 2023 | 2.22% | 2.22% |
| 2024 | 3.04% | 3.04% |
| 2025 | 3.15% | |
| 2026 | 3.20% | |
| 2027 | 3.28% | |
| 2028 | 3.42% | |
| 2029 | 3.34% | |
| 2030 | 3.41% | |
| 2031 | 3.49% | |
| 2032 | 3.58% | |
| 2033 | 3.64% | |
| 2034 | 3.69% |
Note: Real debt service is calculated as nominal interest payments minus the product of the last year’s inflation rate multiplied by last year’s outstanding debt, minus remittances from the Federal Reserve to the federal government, all divided by GDP. Real debt service accounts for the effect of inflation in eroding the outstanding value of public debt, and for the fact that some debt service payments are actually paid to the Federal Reserve who in turn remit them back to the U.S. Treasury.
Source: Congressional Budget Office historical budget and economic data and 10-year budget and economic projections.
The exceptions to the rule that this extra spending should be financed with higher taxes are investments in decarbonization. When deficits run during periods of full employment crowd out private-sector investment, this essentially transfers some money from future generations to the present (current consumption is buoyed by not fully paying for public expenditures, while the future generation inherits a smaller than expected capital stock, making them less productive and lowering their incomes). But not counting the effect of global climate change, these future generations would almost certainly be substantially richer than ours. As a distributional matter, borrowing from richer future generations is not inherently immoral. More importantly, borrowing from future generations to finance investments that will leave them a much healthier planet and economy through decarbonization would be hugely appreciated by these future generations.9
Of course, given the current political reality, this recommendation to substantially raise public spending and raise revenue even more is not going to happen in the near term.
If we rule out transformative increases in the size of the public sector, the next-best policy path to close today’s fiscal gap would be to raise revenue solely from the richest households and corporations. Closing this gap would erase any risk of slowing growth through crowding out of private-sector investments, and because rich households and corporations save so much of incremental income gains, reducing their disposable income will not threaten to move the U.S. economy out of its current near full employment condition. The rise of inequality in recent decades makes it fully plausible to close today’s fiscal gap entirely with revenue increases from the very rich and corporations.
Unfortunately, even this more modest (and politically popular) recommendation is also not going to happen in the near term. Despite President Trump’s populist campaign rhetoric, his record from his first administration demonstrates his refusal to tax the rich and instead his preference to reward them with tax breaks.
If we take as given that the expiring provisions of the TCJA will be extended, this leaves three possible financing mechanisms: increased deficits, a tax shift with some other form of regressive taxes (tariffs possibly) significantly rising, or cuts to federal spending.
The potential economic damage of deficits, which was sketched out above, should not be taken lightly and optimal policymaking would take it totally out of play. That said, the damage that deficits might cause is uncertain. If deficits are increased to finance TCJA expansions and then something drives the economy into recession, then the crowding out will not occur. And even should it occur, the damage from deficits is to the overall growth of the economy. Given that the benefits of overall growth have for decades been disproportionately claimed by the most affluent households in the United States, one could argue that estimates of the damage done by deficits to this overall growth overstate how much they would affect income growth for most U.S. families.10 When compared with the certainty of damage to the bottom and middle of the income distribution from other forms of financing the TCJA tax cuts, deficits are the best of a bad set of options—and this menu of only bad options was essentially locked in as soon as renewing these tax cuts became inevitable.
Large across-the-board tariffs would act as an economy-wide sales tax on imports and would also clear space for price increases from import-competing goods producers. Given that sales taxes are far more regressive than the income tax increases that would be avoided by renewing the expiring provisions of the TCJA, this would clearly shift the burden of taxation onto low- and middle-income households and be a directly painful way to finance these renewals.
Federal government spending in the U.S. is stingy relative to other advanced economies, but it is highly effectively targeted at lower-income households.11 Cuts to this spending would therefore cause great damage to the most vulnerable households. This fact alone would argue that spending cuts would be the most damaging way to finance the coming TCJA expirations. However, the damage spending cuts would cause goes even further than this, weakening the workforce of future generations and threatening the very strong economy inherited by the Trump administration.
Spending cuts threaten tomorrow’s workforce
Much of social spending in the United States does not just provide contemporary boosts to economic opportunity and security, it also constitutes a valuable investment in the long-run productivity of the workforce as a whole. For example, a well-developed literature finds that children’s access to SNAP leads to better health outcomes, earnings, neighborhood quality, and home ownership, and reduces incidence of poverty and incarceration in adulthood. In this research, the longer children have access to SNAP as an income support, the better their outcomes are. All in all, it has been estimated that every $1 spent on SNAP that goes to young children yields $56 in net social benefits.12
Similar findings hold for Medicaid. Access to Medicaid as children leads to significant long-run benefits—seeing improved school performance, educational attainment, earnings, and better health later in life. Studies have found that Medicaid coverage of pregnancy and infants provides benefits that fully pay for the expenditures in the long run.
Spending cuts could even threaten today’s economic strength directly
We noted that the U.S. economy today sits at near full employment and has been there for years. This is the ideal time to engage in deficit reduction, even as such a reduction would put some drag on aggregate demand. Given that the interest rates controlled by the Federal Reserve are significantly higher over the past year than they have been in a long time, Fed interest rate cuts could boost demand and absorb much of the demand destruction that deficits would impose.
However, even with this space to cut interest rates, deficit reduction that solely took the form of spending cuts—and even spending cuts that only paid for TCJA expirations and didn’t even reduce the deficit relative to today—would require the Fed to use all of this space and leave monetary policy completely out of tools to counteract any further economic weakness.
For example, the Congressional Budget Office estimates that extending the TCJA provisions would cost roughly $4 trillion over the next 10 year (excluding interest costs). Extending these provisions would not provide any stimulus to today’s economy; the current policy would just be continued going forward. But if these expirations were fully paid for with spending cuts, this would constitute an enormous change relative to current policy. Further, the bang-for-buck benefits of spending increases or cuts is very large relative to tax changes—again because they are so directed at low- and middle-income households that tend to adjust spending very quickly to changes in disposable income. A strategy that kept tax rates from rising—particularly for higher-income households—while enacting large spending cuts would impose a significant drag on aggregate demand. On an annual basis, spending cuts of $400 billion would reduce economic activity by roughly $600 billion, or around 2% of overall GDP. 13
If the Fed tried to maintain aggregate demand in the face of cuts this large, they might be able to by cutting their policy interest rates from today’s upper bound of 4.5% all the way back to the zero rates that prevailed for much of the 2010s. Some literature argues that a cut this large would be able to avoid a percentage-point increase in unemployment, which roughly translates into a boost to GDP of roughly 2%. Other literature, however, would argue that as rates approached zero, their stimulative effect on aggregate demand would weaken, and conventional monetary policy would be unable to blunt the effect of federal spending cuts this large.14 What is sure is that cuts this large would require the Fed to exhaust all of its conventional recession-fighting ammunition to neutralize the drag on economy-wide spending. At best, this would leave the economy at the cusp of recession with all of the Fed’s conventional tools for boosting a recovery exhausted. This would be an extremely unwise policy decision—one made completely for the purpose of keeping taxes on high-income households and corporations historically low.
Notes
1. For a full accounting of why the debt ratio is not an optimal measure of a nation’s fiscal health, see Furman and Summers (2020). The short reasons why are: It compares a stock (outstanding value of the public debt) with a flow (annual income generated in an economy) instead of being a stock-stock or flow-flow measure; it does not account for the level of interest rates—which can profoundly affect a nation’s fiscal situation; and it is essentially backwards looking, focusing on debt accumulated in the past rather than influences that might affect the nation’s ability to finance desired spending in the future.
2. See Bivens (2020) for why debt must be expanded to support aggregate demand during economic emergencies.
3. See Congressional Budget Office (2010) for this projection.
4. See “The tax gap” (IRS 2024). The net tax gap for 2022 was estimated at just over $600 billion, or roughly 2.4% of GDP. While nobody thinks it’s realistic to push the tax gap all the way to zero, it is a reminder that a relatively aggressive increase in effort to collect taxes from the rich and corporations could have huge effects on the nation’s fiscal situation.
5. See Sarin and Summers (2019) for the composition of the tax gap.
6. Kogan and Vela (2024) draw on estimates from the Congressional Budget Office (CBO 2024) that the expiring provisions of the TCJA would cost more than 1% of GDP on average over the next 10 years.
7. See, for example, Bivens and Fieldhouse (2012) for a ranking of fiscal multipliers based on changes to taxes and spending.
8. See, for example, data collected by the Clean Investment Monitor database (Rhodium Group and MIT CEEPR n.d.).
9. See Bivens (2019) for a fleshed out discussion of these general principles for fiscal policy priorities.
10. See Gould and Kandra (2024) for evidence on the upward redistribution of the most important form of income in the economy: labor earnings.
11. See EPI’s U.S. Tax & Spending Explorer for evidence on how well-targeted most federal spending is to boosting incomes for low- and moderate-income households.
12. See Hoynes (2022) for the list of citations and a fuller description of the research literature on how SNAP and Medicaid spending on children leads to improved outcomes as adults.
13. This assumes a multiplier of 1.5 on these spending cuts, a relatively conservative measure.
14. Wu and Xia (2015) estimate that a 25 basis-point cut in the federal funds rate leads to unemployment a year later being 0.06% lower than would have prevailed absent the cut. Multiplying this by 18 (today’s target federal funds rate sits between 4.25 and 4.5; 4.5 divided by the 25 basis-point cut is 18) indicates that a 4.5 percentage-point cut in the federal funds rate would hence lower the unemployment rate by 1.1 percentage points a year later. Standard estimates of Okun’s Law relating changes in unemployment to changes in GDP are roughly 2 – meaning that a 1% decline in unemployment relative to baseline implies a rise of GDP of about 2% relative to baseline.
References
Bivens, Josh. 2019. Thinking Seriously About What ‘Fiscal Responsibility’ Should Mean: Full Employment and Reduced Inequality Are the Most Important Targets of Fiscal Policy. Economic Policy Institute, September 2019.
Bivens, Josh. 2020. Principles for the Relief and Recovery Phase of Rebuilding the U.S. Economy: Use Debt, Go Big, and Stay Big, and Be Very Slow When Turning Off Fiscal Support. Economic Policy Institute, December 2020.
Bivens, Josh, and Andrew Fieldhouse. 2012. A Fiscal Obstacle Course, Not A Cliff: Economic Impacts of Expiring Tax Cuts and Impending Spending Cuts, and Policy Recommendations. Economic Policy Institute, September 2012.
Rhodium Group and MIT Center for Energy and Environmental Policy Research (CEEPR). Clean Investment Monitor (database), 2024-Q3. Last modified November 20, 2024, with data through end of September 2024.
Congressional Budget Office (CBO). 2010. The Budget and Economic Outlook, 2010 to 2019. January 2010.
Congressional Budget Office (CBO). 2024. Budgetary Outcomes Under Alternative Assumptions About Spending and Revenues. May 2024.
Congressional Budget Office (CBO). (n.d.) Budget and Economic Data.
Economic Policy Institute. (n.d.) U.S. Tax and Spending Explorer.
Furman, Jason, and Lawrence Summers. 2020. A Reconsideration of Fiscal Policy in the Era of Low Interest Rates. Brookings Institution Discussion Draft, November 2020.
Gould, Elise, and Jori Kandra. 2024. Wage Inequality Fell in 2023 Amid a Strong Labor Market, Bucking Long-Term Trends. Working Economics Blog (Economic Policy Institute), December 11, 2024.
Hoynes, Hilary. 2022. “Examining the Powerful Impact of Investments in Early Childhood for Children, Families, and Our Nation’s Economy”, Testimony delivered to the U.S. House of Representatives Committee on the Budget, July 20, 2022.
Internal Revenue Service (IRS). “The Tax Gap” (web page). Last updated December 20, 2024.
Kogan, Bobby, and Jessica Vela. 2024. What Would It Take to Stabilize the Debt-to-GDP Ratio? Center for American Progress, June 2024.
Sarin, Natasha, and Lawrence Summers. 2019. Shrinking the Tax Gap: Approaches and Revenue Potential. National Bureau of Economic Research Working Paper no. 26475, November 2019.
Wu, Jing Cynthia, and Fan Dora Xia. 2015. Measuring the Macroeconomic Impact of Monetary Policy at the Zero Lower Bound. International Monetary Fund Working Paper no. 13-77, May 2015.