Infographic: Why is it a struggle to adequately staff schools?
This report is the second in a series examining the magnitude of the teacher shortage and the working conditions and other factors that contribute to the shortage.
What this series finds: The teacher shortage is real, large and growing, and worse than we thought. When indicators of teacher quality (certification, relevant training, experience, etc.) are taken into account, the shortage is even more acute than currently estimated, with high-poverty schools suffering the most from the shortage of credentialed teachers.
What this report finds: This report describes the challenges schools face in staffing themselves, both as a consequence of the teacher shortage and further contributing to it. It shows that a high share of public school teachers are leaving their posts: 13.8 percent are either leaving their school or leaving teaching altogether, according to most recent data. It also shows that schools are having a harder time filling the vacancies that turnover, attrition, and other factors (like increasing student enrollment or broadened curriculums) create. The share of schools that were trying to fill a vacancy but couldn’t tripled from the 2011–2012 to 2015–2016 school years (increasing from 3.1 to 9.4 percent), and in the same period the share of schools that found it very difficult to fill a vacancy nearly doubled (from 19.7 to 36.2 percent). These difficulties are also shaped by a dwindling pool of applicants to fill vacancies. From the 2008–2009 to 2015–2016 school years, there was a 15.4 percent drop in the number of education degrees awarded and a 27.4 percent drop in the number of people who completed a teacher preparation program. Schools are also having a harder time retaining credentialed teachers: that can be seen in the small but growing share of all teachers who are newly hired and in their first year of teaching (4.7 percent) and in the substantial shares of teachers who quit who are certified and experienced. All these challenges are more acute for high-poverty schools.
Why it matters: A shortage of teachers harms students, teachers, and the public education system as a whole. Lack of sufficient, qualified teachers and the staff instability that accompanies turnover threaten students’ ability to learn and reduce teachers’ effectiveness, and high teacher turnover consumes economic resources that could be better deployed elsewhere. The teacher shortage makes it more difficult to build a solid reputation for teaching and to professionalize it, which further contributes to perpetuating the shortage. In addition, the fact that the shortage is distributed so unevenly among students of different socioeconomic backgrounds challenges the U.S. education system’s goal of providing a sound education equitably to all children.
What we can do about it: Tackle the working conditions and other factors that are prompting teachers to quit and dissuading people from entering the profession, thus making it harder for school districts to retain and attract highly qualified teachers: low pay, a challenging school environment, and weak professional development support and recognition. In addition to tackling these factors for all schools, we must provide extra supports and funding to high-poverty schools, where teacher shortages are even more of a problem.
Update, October 2019: EPI analyses in this report are produced with 2011–2012 Schools and Staffing Survey (SASS) data), 2012–2013 Teacher Follow-Up Survey (TFS) data, and 2015–2016 National Teacher and Principal Survey (NTPS) school-level data, and are unaffected by the National Center for Education Statistics’ reexamination of weights developed for the teacher data in the 2015–2016 NTPS used in other reports in this series.
Introduction
The teacher shortage in the nation’s K–12 schools is an increasingly recognized but still poorly understood crisis: The shortage is recognized by the media and policymakers, and researchers have estimated the size of the shortage—about 110,000 teachers in the 2017–2018 school year, up from no shortage before 2013 (Sutcher, Darling-Hammond, and Carver-Thomas 2016).1 But the shortage is poorly understood because the reasons for it are complex and interdependent. The shortage occurs because there is an insufficient number of credentialed teachers to fill vacancies at schools. Unfilled vacancies happen for any number of reason, including reduced attractiveness of teaching as a profession, increases in school enrollment, reductions in class sizes, and excessive number of teachers leaving their schools. The teacher shortage constitutes a crisis because of its negative effects on students, teachers, and the education system at large. This crisis calls for urgent, comprehensive, and sustainable policy solutions.
The first report in this series, The Teacher Shortage Is Real, Large and Growing, and Worse Than We Thought (García and Weiss 2019a), established that current national estimates of the teacher shortage likely understate the magnitude of the problem: When issues such as teacher qualifications and the unequal distribution of highly credentialed teachers across high- and low-poverty schools are taken into consideration, the teacher shortage problem is much more severe than previously recognized. Building on that research, and using the same quality and equity angles, this paper examines challenges schools are facing in trying to recruit, hire, and retain sufficient, qualified teachers, with a particular focus on high-poverty schools, where those struggles are heightened.
This report shows that schools’ staffing efforts are challenged by teachers leaving the profession at high rates and by the reduced pipeline of new teachers as fewer people have entered teaching preparedness pathways in recent years. We also present data suggesting that teachers entering the profession don’t have the same qualifications their peers in years past had, due to the proliferation of nontraditional teacher preparation programs and changes in the requirements for obtaining an initial teaching certificate. We also show staffing trends are affecting the qualifications held by the teaching workforce overall: A lot of teachers quit teaching and some of the teachers who quit are as credentialed or more credentialed than the teachers who stay, and the share of all teachers who are inexperienced has increased over time.
These challenges and changes in the aggregate qualification of the teaching labor force manifest in schools in many ways. Schools are reporting difficulties in staffing their schools and are leaving vacancies unfilled despite actively trying to hire for them. Over time the share of teachers who are newly hired has increased as has the share of teachers who are newly hired and in their first year of teaching. High-poverty schools are hit hardest: They find it harder to fill vacancies than low-poverty schools and schools overall, and they experience higher turnover and attrition than low-poverty schools. These findings suggest that efforts to address teacher shortages must consider how schools are affected by both teacher attrition and turnover and by the shrinking pipeline of new potential teachers and the factors that have eroded the appeal of—and regard for—teaching as a profession for both incoming and acting teachers.
How do struggles to recruit and hire drive the teacher shortage, and why is the shortage a concern?
For schools, the teacher shortage manifests in their inability to staff themselves with teachers who have qualifications appropriate to their specific needs. The number of new teachers a school needs and the qualifications those teachers must have depend on the subject matter and courses the school needs to offer, the size and characteristics of the student body, the state or district requirements that broadened the curriculum or reduced class sizes, the vacancies generated by teachers who left the school or the profession, and other “supply and demand” drivers.2
Net of some of the external or institutional factors just mentioned, the staffing problem arises when vacancies occur against a backdrop of high rates of teacher attrition (teachers quitting teaching altogether) and turnover (teachers leaving their position to another position or school) and a shrinking pool of new teachers with the needed qualifications due to a waning interest in a teaching career. Indeed, high attrition and a dwindling pool of applicants are the two most troubling dynamics of the education labor market and are largely driving the teacher shortage and hence are largely responsible for the costs and consequences of the teacher shortage (Ingersoll 2004, 2014; Sutcher, Darling-Hammond, and Carver-Thomas 2016; Darling-Hammond et al. 2017).
As we saw in the first report, the shortage imposes real costs on teachers themselves, on students, on schools, and on the education system at large. In addition to the economic cost of replacing teachers who are leaving (Carroll 2007; Carver-Thomas and Darling-Hammond 2017; LPI 2017), there are performance costs when highly qualified teachers leave schools. High absolute and net teacher turnover—i.e., overall and when comparing the shares of teachers who leave a school with the share who arrive—harms both the morale of those teachers who stay, and the cohesion of the school as a whole, which makes sense given the central role teachers play in one another’s decisions regarding curriculum, instruction, student assessment, and school governance and policy (Sorensen and Ladd 2018; Kraft and Papay 2014). Net turnover increases a school’s share of inexperienced teachers who are not fully certified or credentialed to teach the subject to which they are assigned, and turnover begets further turnover, substantially weakening the overall quality and ability of the school’s teacher pool (Sorensen and Ladd 2018).3 Turnover also depresses student achievement (Ronfeltd, Loeb, and Wyckoff 2013; Darling-Hammond 1999; Ladd and Sorensen 2016), especially in our highest-poverty schools, with “turnover-induced loss of general and grade-specific experience” as the main driver of declining student achievement (see Sorensen and Ladd 2018, 2, citing Hanushek, Rivkin, and Shiman 2016).4
In this report, we examine the challenges schools face accessing a sufficient pool of qualified applicants, filling vacancies that arise, and retaining credentialed teachers. We also identify disparities in recruitment and attrition between high- and low-poverty schools, which should be expected, given the substantial disparities between working conditions in high-poverty schools and in low-poverty schools (as examined in the forthcoming reports in this series).
Challenges to recruiting and hiring credentialed teachers
How easy or hard it is for schools to recruit and hire strong teachers to fill open positions depends in part on the size and qualifications of the pool of potential new teachers. That is why changes to the pool of potential new teachers, to how well teachers in the pool were prepared, to what requirements they had to meet to access a teaching credential, and to the total number of teachers who need to be recruited all affect the ease or difficulty of filling openings in a school.
The pipeline of potential teachers is shrinking
The diminishing pool of applicants and changes in the characteristics of those applicants over time help to explain some of the challenges to recruitment. Schools will struggle to staff their ranks with well-prepared teachers if fewer individuals are attracted into teaching or if their training and preparation have weakened.
While requirements vary state to state, generally someone must earn a bachelor’s degree from an accredited institution and complete a teacher preparation program (or “teacher certification program,” as referred to in our last report) to be eligible to obtain a certificate to teach. (Teacher preparation programs prepare candidates to meet certification requirements but do not award certificates—only the state can do that. Candidates may complete a program but fail to pass the required certification tests or may fail to meet some other requirements to earn the certification.) All teachers need a bachelor’s degree, but not all teachers need a bachelor’s degree in education. However, a bachelor’s degree in education is a common route into teaching because the teacher preparation program is completed as part of the education major. Persons who wish to be teachers but who did not major in education as an undergraduate may pursue a master’s degree in education or may enroll in an alternative teacher preparation program. Teachers also pursue master’s degrees and doctorates to advance their education. For these reasons, we can glean insights into the popularity of teaching and the strength of the teacher pipeline by looking at the number of people pursing education degrees and enrolling in teacher preparation programs (see footnote 6 and table notes for descriptions of the types of teacher preparation programs).
Both the appeal of education as a discipline and the pool of potential new teachers shrank significantly between the 2008–2009 and 2015–2016 school years, as suggested by Figure A, which shows a dramatic drop in both the number of people awarded degrees in education and the number of people enrolling in and completing teacher preparation programs. From 2008–2009 to 2015–2016, the number of enrollees in teacher preparation programs fell 37.8 percent, and the number of people who completed teacher preparation programs fell 27.4 percent.5
Fewer people are interested in teaching: Change in number of people awarded degrees in education, and enrolling in, or completing, teacher preparation programs from 2008–2009 to 2015–2016
| Change between 2008-09 and 2015-16 | |
|---|---|
| Awarded education degree (B.A., M.A., Ph.D.) | -15.4% |
| Enrolled in teacher prep. program | -37.8% |
| Completed teacher prep. program | -27.4% |

Note: Data for other years are available in Appendix Tables 1 and 2 at the end of this report.
Source: Digest of Education Statistics (National Center for Education Statistics 2018) and Higher Education Act Title II State Report Card System (U.S. Department of Education 2017a and 2017b)
Table 1 further unpacks these sharp reductions and provides context. For example it shows that not only did the number of people awarded education degrees fall, the share of education degrees awarded as a percentage of all degrees awarded fell, with the exception of Ph.D.s. (Ph.D.s increased in both total number of degrees and as a share of degrees awarded but constitute a very small percentage of education degrees awarded.) Of all the bachelor’s degrees awarded in 2015–2016, 4.5 percent were in the field of education; of all the master’s degrees awarded, 18.6 percent were in education. These shares were 1.8 and 8.4 percentage points smaller than in 2008–2009, before the teacher shortage crisis developed. (During the 2008–2009 school year school systems were just starting to grapple with the economic recession, which led to big cuts in school spending that in some cases have yet to be fully restored, as noted in Leachman, Masterson and Figueroa 2017 and Leachman and Figueroa 2019). To put it another way, in percent terms, bachelor’s and master’s degrees in education awarded as a share of all degrees fell by roughly a third (28.5 percent and 31.2 percent, respectively) from 2008–2009 to 2015–2016.
Change in number of people awarded education degrees and enrolled in or completing teacher preparation programs, by degree and program type, 2008–2009 to 2015–2016
| 2008–2009 | 2015–2016 | Change 2008–2009 to 2015–2016 | |
|---|---|---|---|
| Degrees awarded in education | |||
| Total degrees awarded | 289,282 | 244,851 | -15.4% |
| Bachelor’s | 101,716 | 87,221 | -14.3% |
| Master’s | 178,538 | 145,792 | -18.3% |
| Ph.D. | 9,028 | 11,838 | 31.1% |
| Education degrees as a share of all degrees awarded | |||
| Total share | 12.0% | 8.5% | -3.5 pp (-29.0%) |
| Bachelor’s | 6.4% | 4.5% | -1.8 pp (-28.5%) |
| Master’s | 27.0% | 18.6% | -8.4 pp (-31.2%) |
| Ph.D. | 5.8% | 6.6% | 0.8 pp (13.8%) |
| Enrollment in teacher preparation programs | |||
| Total enrollment | 690,552 | 429,541 | -37.8% |
| Traditional program | 609,106 | 337,690 | -44.6% |
| Alternative–IHE | 42,851 | 25,678 | -40.1% |
| Alternative–not IHE | 38,595 | 66,173* | 71.5% |
| Completers of teacher preparation programs | |||
| Total completers | 217,400 | 157,901 | -27.4% |
| Traditional program | 174,858 | 126,300 | -27.8% |
| Alternative–IHE | 17,750 | 12,494 | -29.6% |
| Alternative–not IHE | 24,792 | 19,107 | -22.9% |
* Almost the entire change is driven by the increase in the number of enrollees in these programs in Texas.
Note: Data include totals for 50 states and the District of Columbia. IHE stands for institution of higher education. IHEs offer traditional and alternative teacher preparation programs. Alternative–not IHE refers to an alternative teacher preparation program provided by an entity other than an IHE. Data for other years are available in Appendix Tables 1 and 2 at the end of this report.
Source: Digest of Education Statistics 2018 Table 322.10, Table 323.10, and Table 324.10 (NCES 2018) and Higher Education Act Title II State Report Card System (U.S. Department of Education 2017a and 2017b) .
The table also shows negative but much more intense trends for enrollees in specific types of teacher preparation programs. Although, as shown above, overall enrollees decreased by 37.8 percent from 2008–2009 to 2015–2016, enrollees in traditional programs fell by 44.6 percent, and enrollees in alternative programs offered by institutions of higher education (IHEs) fell by 40.1 percent. When we look at the number of people who completed teacher preparation programs by program type, the changes by program type are closer. Overall, the number of completers decreased by 27.4 percent. Completers of alternative programs at institutions of higher education decreased the most (down by 29.6 percent), followed by completers of traditional programs (down by 27.8 percent), and by completers of alternative programs (down by 22.9 percent).6
The aggregate numbers alone point to a reduction in the size of the pool of teachers. But the qualifications of that pool are also affected by the type and quality of the training of the applicants, which in turn can affect the effectiveness of novice teachers in the classrooms. As shown in the table, the increase of potential teachers who are enrolled in or who have completed alternative training programs is notable. Our first report in this series (García and Weiss 2019a) found a marked increase in the share of current teachers who had followed alternative routes into teaching between 2011–2012 and 2015–2016 (i.e., who went into teaching after completing an alternative teacher preparation program). Although the research on the quality of preparation programs is inconclusive, there are concerns associated with the proliferation of nontraditional programs (Fraser and Lefty 2018).7 Some of these concerns relate to the relative instability of nontraditional-entry teachers as members of the teaching workforce as alternative routes into teaching are associated with higher turnover (Redding and Smith 2016). 8
Other factors that influence the qualifications of the teacher workforce include changes in the standards for becoming a teacher such as licensure examinations and the requirements of preparation programs. Our exploration of Title II data from the U.S. Department of Education (2017c and 2017d) identifies certain trends that could negatively affect teacher qualifications (although more detailed qualitative work would be needed to assess the reasons for, and net impact of, the changes, which is beyond of the scope of this report).
Nevertheless, we found that the number of states requiring content-specific bachelor’s degrees for initial teaching credentials decreased. (If a state requires a content-specific bachelor’s degree, that generally means that if a teacher is to teach a specific subject, such as math, the teacher must have majored in that subject.) Of states with data in 2008–2009 and 2015–2016, fewer states required a content-specific bachelor’s for elementary, middle-level, and secondary level certificates in 2015–2016. Examining the requirements across all initial certificates available, we also noted a large decrease in the share initial teaching certificates requiring a content-specific bachelor’s degree for middle school, which fell from 38.6 percent to 22.8 percent of all initial certificates, a 15.8 percentage-points decrease. Over the same period there were also drops in the share of initial certificates requiring performance assessments (down 16.2 percentage points), supervised clinical experience (down 10.8 percentage points), or a police record examination (down 17.2 percentage points) in order to earn a teaching certificate. However, there was an increase in the share of initial certificates requiring “prescribed coursework” (up 10.8 percentage points) in order to get a teaching certificate.
Hiring teachers is difficult, especially in high-poverty schools
Schools’ hiring patterns help explain the teacher shortage because they reflect the actual school-level need for teachers, the share of schools that are hiring (irrespective of the reasons), and challenges filling vacancies.9 Shortages arise when finding proper, qualified candidates is difficult or when some vacancies remain unfilled, and shortages grow if these circumstances become more challenging over time.10
As shown in Table 2, a large majority of schools report having vacancies to fill, so most are hiring at a given time (about eight in 10 schools report having vacancies for the 2015–2016 school year). And nearly one in 10 (9.4 percent) of those schools that were trying to hire said they were unable to fill a vacancy in at least one field (math, English, etc.) in the 2015–2016 school year. Finally, over a third (36.2 percent) of schools trying to fill vacancies report finding it very difficult to fill a vacancy in at least one field.
Schools with teacher vacancies and difficulty filling vacancies in all schools and in low- and high-poverty schools
| Total | Low-poverty | High-poverty | Gap (high- minus low-poverty school) | Ratio high/low poverty | |
|---|---|---|---|---|---|
| Schools reporting teacher vacancies | 79.8% | 81.1% | 78.9% | -2.2 ppt. | 1.0 |
| Of schools reporting vacancies | |||||
| Unable to fill a vacancy in at least one field | 9.4% | 7.2% | 10.5% | 3.4 ppt. | 1.5 |
| Found it “very difficult” to fill a vacancy in at least one field | 36.2% | 34.3% | 36.8% | 2.4 ppt. | 1.1 |
Note: Data are for public noncharter schools and are based on a count of schools, not on the total number of vacancies or the number of teachers the school failed to hire. All principals are asked whether their school has or does not have any vacancies (“teaching positions for which teachers were recruited and interviewed by this school’s hiring authority”). The shares reported in the table represent the share of schools that had any vacancies, and, for those with vacancies, the share of schools that could not fill a vacancy in at least one of the fields listed on the questionnaire, and the share of schools that filled a vacancy but found it "very difficult" in at least one of the fields. Fields included were: (1) general elementary, (2) special education, (3) English or language arts, (4) social studies, (5) computer science, (6) mathematics, (7) biology or life sciences, (8) physical sciences, (9) ESL or bilingual education, (10) foreign languages, (11) music or art, (12) career or technical, and (13) other. A principal is in a low-poverty school if less than 25 percent of the student body in his/her school is eligible for free or reduced-price lunch programs; a principal is in a high-poverty school if 50 percent or more of the student body is his/her school is eligible for those programs.
Source: 2015–2016 National Teacher and Principal Survey (NTPS) microdata from the U.S. Department of Education's National Center for Education Statistics (NCES)
The data also show that while high-poverty schools were less likely to be hiring than their low-poverty counterparts (i.e., fewer of them reported having teaching vacancies for which teachers were recruited and interviewed), high-poverty schools with vacancies found it more difficult to hire teachers. Well over a third (36.8 percent) of high-poverty schools with vacancies reported that it was “very difficult” to fill at least one of their vacancies versus 34.3 percent of low-poverty schools.
There are also differences between high- and low-poverty schools in the share that are unable to fill vacancies. While these differences are small in absolute terms, they are relatively large. For example, the share of high-poverty schools that had vacancies and report being unable to fill teaching positions in at least one field is 10.5 percent, but this share is greater than the 7.2 percent share in low-poverty schools.
One consequence of this greater challenge in high-poverty schools is their higher share of brand new teachers and teachers who are new hires. Here our analysis coincides with what Sorensen and Ladd found in their 2018 study. The share of all teachers who were newly hired teachers (new to the school completing the survey) was 11.2 percent, on average, in the 2015–2016 school year (Table 3). But that share was two percentage points higher in high-poverty schools (12.1 percent versus 10.1 percent in low-poverty schools). And, when we look at the share of all teachers who are not only newly hired teachers but in their first year of teaching, we see again that the share is higher in high-poverty schools (5.3 percent versus 3.7 percent). Finally, in high-poverty schools, the share of newly hired teachers who are in their first year of teaching is much higher than in low-poverty schools (39.8 percent versus just 33.8 percent). Although the differences are small in relative terms, these three measures together point to an added source of disadvantage for low-income children and the schools that serve them.
Newness of teachers in low- and high-poverty schools
| Total | Low-poverty | High-poverty | Gap (high- minus low-poverty school) | Ratio high/low poverty | |
|---|---|---|---|---|---|
| Share of all teachers who are newly hired teachers | 11.2% | 10.1% | 12.1% | 2.0% | 1.2 |
| Share of all teachers who are newly hired teachers and in their first year of teaching | 4.7% | 3.7% | 5.3% | 1.6% | 1.5 |
| Share of newly hired teachers who are in their first year of teaching | 37.8% | 33.8% | 39.8% | 6.0% | 1.2 |
Note: Data are for public noncharter schools. One survey question asked principals how many teachers held full- or part-time positions in the school around the first of October for the 2015–2016 school year. Another survey question asked how many teachers at the school around the first of October were newly hired by the school and, of those newly hired teachers, how many were in their first year of teaching. The share of all teachers who are newly hired was calculated by dividing the number of teachers who were newly hired by the total number of full- and part-time teachers in each school and averaging that number across all schools responding to survey. Calculating the share of all teachers who are newly hired and in their first year of teaching follows the same process. The last row uses the previous two numerators. For each school, the total number of teachers who are in their first year of teaching is divided by the total number of newly hired teachers in each school and averaged across all schools. A principal is in a low-poverty school if less than 25 percent of the student body in his/her school is eligible for free or reduced-price lunch programs; a principal is in a high-poverty school if 50 percent or more of the student body is his/her school is eligible for those programs.
Source: 2015–2016 National Teacher and Principal Survey (NTPS) microdata from the U.S. Department of Education's National Center for Education Statistics (NCES)
Challenges to hiring teachers have increased over time
Not only is hiring a challenge, but the data show that it has become substantially harder in the past few years. First, the share of schools reporting any vacancy increased by more than 11 percentage points between the 2011–2012 and 2015–2016 school years (from 67.2 percent to 78.8 percent, top panel Figure B). Even more troubling, the share of schools that were trying to hire but reported an unfilled vacancy in at least one position tripled during this period (from 3.1 percent to 9.4 percent). And the share of hiring schools reporting that they had found it “very difficult” to fill at least one vacancy also increased—almost doubling (from 19.7 percent to 36.2 percent). Relatedly, the share of all teachers who were newly hired teachers increased between the 2011–2012 and 2015–2016 school years (from 7.2 percent to 11.2 percent), as did the share of all teachers who were newly hired and in their first year of teaching (from 4.0 percent to 4.7 percent), indicating that the teaching workforce became less experienced over this period.
Change over time in the share of schools reporting having vacancies, difficulty filling vacancies, and newly hired and first-year teachers, 2011–2012 to 2015–2016
| 2011–2012 | 2015–2016 | |
|---|---|---|
| Share of schools reporting vacancies | 67.2% | 78.8% |
| Share of hiring schools unable to fill at least one vacancy | 3.1% | 9.4% |
| Share of hiring schools reporting that filling one or more vacancies was “very difficult” | 19.7% | 36.2% |
| Share of all teachers who are newly hired | 7.2% | 11.2% |
| Share of all teachers who are newly hired and in their first year of teaching | 4.0% | 4.7% |
| Share of newly hired teachers who are in their first year of teaching | 42.4% | 37.8% |
Note: Data are for public noncharter schools and are based on a count of schools, not on the total number of vacancies or the number of teachers the school failed to hire. All principals were asked whether their school has or does not have any vacancies (“teaching positions for which teachers were recruited and interviewed by this school’s hiring authority”). The shares reported in the table represent the share of schools that had any vacancies, and, for those with vacancies, the share of schools that could not fill a vacancy in at least one of the fields listed on the questionnaire, and the share of schools that filled a vacancy but found it "very difficult" in at least one of the fields. Fields included were: (1) general elementary, (2) special education, (3) English or language arts, (4) social studies, (5) computer science, (6) mathematics, (7) biology or life sciences, (8) physical sciences, (9) ESL or bilingual education, (10) foreign languages, (11) music or art, (12) career or technical, and (13) other. With regard to teachers hired, one survey question asked principals how many teachers held full- or part-time positions in the school around the first of October for the 2015–2016 school year. Another survey question asked how many teachers at the school around the first of October were newly hired by the school and, of those newly hired teachers, how many were in their first year of teaching. The share of all teachers who were newly hired was calculated by dividing the number of teachers who were newly hired by the total number of full- and part-time teachers in each school and averaging that number across all schools responding to survey. Calculating the share of all teachers who were newly hired and in their first year of teaching follows the same process.
Source: 2011–2012 Schools and Staffing Survey (SASS) and 2015–2016 National Teacher and Principal Survey (NTPS) microdata from the U.S. Department of Education's National Center for Education Statistics (NCES)
Retaining credentialed teachers is difficult
Excessive attrition is another troubling dynamic plaguing teacher labor markets and a major driver of shortages (Ingersoll 2004, 2014; Sutcher, Darling-Hammond, and Carver-Thomas 2016; Darling-Hammond et al. 2017). Attrition and turnover—leaving the profession altogether or switching schools—are high in teaching in both absolute and relative terms. Turnover and attrition have been increasing over time (Goldring, Taie, and Riddles 2014) and are higher for U.S. teachers than among teachers in other countries (Darling-Hammond et al. 2017).11 Teachers see much higher attrition than their peers in most occupations: About 30 percent of college graduates who became teachers were not in the profession five years later, compared with 14 percent of pharmacists, 16 percent of engineers, and 19 percent of nurses and lawyers (Ingersoll 2014).12 Among the other professions Ingersoll described in his study, the only ones with higher attrition rates are secretaries, child care workers, paralegals, and correctional officers. It is worth noting that these other professions, with the exception of correctional officers, are very heavily female and relatively low paying, unlikely a coincidental association and one that affirms the findings in our later reports in this series about teachers’ insufficient pay, weak supports, and even lack of societal respect.
Teacher turnover and attrition rates are high, causing staff instability and increasing pressure to hire
After the 2011–2012 school year, 6.5 percent of teachers left the school but remained in the profession (the measure of turnover), and 7.3 percent left the teaching profession (the measure of attrition), for a total of 13.8 percent of teachers lost to turnover or attrition generating the potential need for a replacement (Figure C). As in other aspects of teacher shortages, however, rates vary between low- and high-poverty schools. In low-poverty schools, 88.1 percent of teachers who were teaching when the 2011–2012 Schools and Staffing Survey was administered were at the same school the following year, compared with 84.6 percent in high-poverty schools. To put it another way, the aggregate turnover and attrition rate is 15.3 in high-poverty schools—that’s 3.4 percentage points higher than the aggregate turnover and attrition rate in low-poverty schools (11.9 percent), creating more potential vacancies in high-poverty schools than in better-off schools.13
Share of teachers who stay, leave the school, or quit the profession, by share of low-income students taught
| Teaching at same school | Left the school but in teaching | Left teaching | |
|---|---|---|---|
| Total | 86.2% | 6.5% | 7.3% |
| Low-poverty schools | 88.1% | 5.7% | 6.2% |
| High-poverty schools | 84.6% | 7.1% | 8.2% |
Note: Data are for teachers in public noncharter schools in the 2011–2012 Schools and Staffing Survey (SASS). In the 2012–2013 Teacher Follow-up Survey (TFS), principals were asked about the teachers’ status the year after SASS was administered. Teaching status is coded from the perspective of whether teachers are generating a vacancy in the school the year after the SASS. Teachers who stay at the same school are teachers whose status the year after is “Teaching in this school.” Teachers who left teaching are those who generated a vacancy and are not in the profession (left teaching, on long-term leave, or deceased). Teachers who generated a vacancy in the school year but are in the profession (teaching in another school or are on short-term leave and returning to the school) are in the "left the school but teaching" category.
Source: 2011–2012 Schools and Staffing Survey (SASS) and 2012–2013 Teacher Follow-up Survey (TFS) microdata from the U.S. Department of Education's National Center for Education Statistics (NCES)
Teacher turnover and attrition rates affect the overall qualifications of the teaching labor force
More data are needed to determine whether attrition causes certain schools to lose teachers with qualifications associated with effective teaching. As suggested by the literature and noted in our first paper in this series, overall, the credentials of teachers who stay in teaching are stronger than the credentials of teachers who quit the profession, which would indicate no leakage in teaching overall through attrition. 14
Table 4 provides a detailed look at the shares of teachers with various qualifications (certification, experience, and educational background, as in our first report) by teacher status, i.e., whether the teacher stays in the school, leaves the school but stays in the profession, or leaves teaching altogether. The table also provides shares of teachers with an additional qualification—certification by the National Board for Professional Teaching Standards (NBPTS) in at least one content area. (The NBPTS is a nongovernmental organization that administers National Board certification, a voluntary national assessment program that certifies teachers who demonstrate advanced knowledge, skills, and practice in their certificate area.)
Qualifications of teachers who stay, leave the school, or quit the profession
| Teaching at same school | Left the school but in teaching | Left teaching | Total | |
|---|---|---|---|---|
| Certification | ||||
| Fully certified | 92.1% | 88.1% | 90.3% | 91.7% |
| Not fully certified | 7.9% | 11.9% | 9.7% | 8.3% |
| Took traditional route into teaching | 86.1% | 82.5% | 82.9% | 85.7% |
| Took alternative route into teaching | 13.9% | 17.5% | 17.1% | 14.3% |
| Earned NBPTS certification | 16.6% | 15.2% | 18.3% | 16.6% |
| Did not earn NBPTS certification | 83.4% | 84.8% | 81.7% | 83.4% |
| Experience | ||||
| Experienced (over 5 years) | 80.9% | 66.1% | 77.2% | 79.7% |
| Mid-career (6–20 years) | 57.7% | 54.9% | 42.4% | 56.4% |
| Senior (Over 21 years) | 23.3% | 11.2% | 34.8% | 23.3% |
| Inexperienced (5 years or less) | 19.1% | 33.9% | 22.8% | 20.3% |
| Novice (1–2 years) | 6.0% | 13.2% | 10.0% | 6.8% |
| Early career (3–5 years) | 13.1% | 20.7% | 12.8% | 13.5% |
| Education | ||||
| Educational background in subject of main assignment | 69.5% | 66.9% | 63.1% | 68.9% |
| No educational background in subject of main assignment | 30.5% | 33.1% | 36.9% | 31.1% |
Note: Data are for teachers in public noncharter schools. According to research and to the U.S. Department of Education, highly qualified teachers have the following four credentials: They are fully certified (with a regular, standard state certificate or advanced professional certificate versus not having completed all the steps); they took a traditional route into teaching (participated in a traditional certification program versus an alternative certification program, the latter of which is defined in the teacher survey questionnaire as “a program that was designed to expedite the transition of nonteachers to a teaching career, for example, a state, district, or university alternative certification program”); they are experienced (have more than five years of experience); and they have a background in the subject of main assignment; i.e., they have a bachelor's or master's degree in the main teaching assignment field (general education, special education, or subject-matter specific degree) versus having no educational background in the subject of main assignment. The table also provides shares of teachers with an additional qualification—certification by the National Board for Professional Teaching Standards (NBPTS) in at least one content area. Teaching status is determined by the reported status of teachers in the Teacher Follow-up Survey conducted for the 2012–2013 school year, one year after the 2011–2012 Schools and Staffing Survey. Teachers who stay at the same school are teachers whose status the year after is “Teaching in this school.” Teachers who left teaching are those who generated a vacancy in the 2012–2013 school year and are not in the profession (they left teaching, were on long-term leave, or were deceased). Teachers who generated a vacancy in the school year but remained in the profession (i.e., left to teach in another school or were on short-term leave and planned to return to the school) are in the "left the school but in teaching" category.
Source: 2011–2012 Schools and Staffing Survey (SASS) and 2012–2013 Teacher Follow-up Survey (TFS) microdata from the U.S. Department of Education's National Center for Education Statistics (NCES)
As the table shows, the qualifications of teachers who stay, leave the school, or quit the profession differ, but schools are not consistently losing strong credentials due to attrition, because the qualifications of teachers staying at the school are the strongest (with the exception of teachers who are NBTPS).15 On average, 92.1 percent of teachers who stay at the same school have a regular, state, or advanced professional certificate (i.e., are fully certified); 86.1 percent took a traditional route into teaching, 80.9 percent are experienced, and 69.5 percent have an educational background in the subject of main assignment. Among teachers who left the school or quit teaching, smaller shares are fully certified (88.1 percent and 90.3 percent, respectively), have taken a traditional route into teaching (82.5 percent and 82.9 percent), are experienced (66.1 percent and 77.2 percent), and have an educational background in the subject of main assignment (66.9 percent and 63.1 percent, respectively).16
Earlier in this report we showed that turnover and attrition are higher in high-poverty schools (see discussion around Figure C). Here we discuss how turnover and attrition could be responsible for some leakage of credentials from high-poverty schools. One reason is the weaker link between higher credentials and retention in high-poverty schools. As we showed in our last paper in this series (see García and Weiss 2019a, particularly Table 2), while higher credentials deter attrition (in our analysis, shown descriptively, not causally), this link between quality and retention was weaker in high-poverty schools.17 Also, because, just as teachers who stay in high-poverty schools are less qualified than teachers who stay in low-poverty schools (García and Weiss 2019a, Figure D), teachers in high-poverty schools who end up quitting the profession are more qualified with respect to certification than teachers who in low-poverty schools who quit the profession. See Appendix Table 3, which replicates Table 2 from Garcia and Weiss 2019a; Appendix Figure A, which replicates Figure D in Garcia and Weiss 2019a; and Appendix Figure B, which provides data on teachers in high- and low-poverty schools who quit.18
It’s hard to determine exactly how the exit of credentialed teachers affects the qualifications of the teacher labor force overall and in high- and low-poverty schools because the qualifications of the overall teacher pool also depend on the qualifications of the teachers coming into the workforce and into these schools. But as Ladd and Sorensen (2018) find, “all schools experiencing periods of high turnover are more likely to hire not-fully-licensed teachers,” and “schools serving large proportions of low-income student are much more likely to do so. Since schools serving high-poverty student populations already experience above average turnover rates, these differential impacts are particularly worrying” (p. 20). In short, high-poverty schools would need to compensate for these negative trends by hiring greater shares of credentialed teachers to keep up with their wealthier counterparts, and we know that doing so would be extremely unlikely.
Conclusion
In practice, the teacher shortage manifests in schools as an inability to be staffed adequately. A school may need to hire more teachers for any one or more of the following reasons: school enrollment increases, teachers leave, the curriculum expands and teachers are needed in new fields, a policy reduces class size, the school’s budget increases, etc. And for any reason or combination of reasons—insufficient teachers coming into teaching, excessive numbers of teachers quitting the profession because of worsening working conditions, etc.—those needed teachers are increasingly difficult for a school to find.19 This imbalance creates a shortage.
This report focuses on the challenges schools face filling their vacancies (or meeting their staffing needs) primarily due to two trends: more teachers leaving schools and the profession and fewer people entering the teaching profession. It also raises three concerns on top of the leakage of teachers from the profession and the dwindling pool or potential new teachers. First is the potential change or decline in the qualifications of the teaching workforce, driven by increased churn (turnover and attrition) in the teacher labor market, by changes in the strength of the teaching preparation programs, by alterations in the requirements to accessing an initial teaching credential, and by the slight loss of credentialed teachers who leave the profession. Second is the increased difficulty that schools are having filling vacancies, which in turn has increased the pressure on schools to hire teachers with fewer credentials and thus affected the overall qualifications of the teaching workforce. Third is the fact the high-poverty schools are in an especially difficult position: they are more likely to have vacancies and have a hard time filling vacancies, they are more likely to fill positions with newly hired teachers (and newly hired teachers in their first year of teaching), their teachers are more likely to leave the school or leave the profession, and, as shown in García and Weiss 2019a, they are more likely to face a shortage of highly qualified teachers.
In our next reports, we will discuss the factors that make it hard for schools—and especially for high poverty schools—to attract and retain teachers, and, relatedly, why teachers want to leave the profession and why people are less inclined to pursue a teaching career in the first place. In brief, we will show that the supply of new teachers is not meeting the demand at least in part because teacher pay and working conditions and the prestige of teaching are deteriorating. We argue that policymakers are failing to meet the needs of their constituents by failing to address the factors that are prompting teachers to quit and dissuading people from entering the profession, by underestimating what this job involves and by not supporting efforts to professionalize teaching.
About the authors
Emma García is an education economist at the Economic Policy Institute, where she specializes in the economics of education and education policy. Her research focuses on the production of education (cognitive and noncognitive skills); evaluation of educational interventions (early childhood, K–12, and higher education); equity; returns to education; teacher labor markets; and cost-effectiveness and cost–benefit analysis in education. She has held research positions at the Center for Benefit-Cost Studies of Education, the Campaign for Educational Equity, the National Center for the Study of Privatization in Education, and the Community College Research Center; consulted for MDRC, the World Bank, the Inter-American Development Bank, and the National Institute for Early Education Research; and served as an adjunct faculty member at the McCourt School of Public Policy, Georgetown University. She received her Ph.D. in economics and education from Columbia University’s Teachers College.
Elaine Weiss is the lead policy analyst for income security at the National Academy of Social Insurance, where she spearheads projects on Social Security, unemployment insurance, and workers’ compensation. Prior to her work at the academy, Weiss was the national coordinator for the Broader Bolder Approach (BBA) to Education, a campaign launched by the Economic Policy Institute, from 2011–2017. BBA promoted a comprehensive, evidence-based set of policies to allow all children to thrive in school and life. Weiss has coauthored and authored EPI and BBA reports on early achievement gaps and the flaws in market-oriented education reforms. She is co-authoring Broader, Bolder, Better, a book with former Massachusetts Secretary of Education Paul Reville that will be published by Harvard Education Press in June 2019. Weiss came to BBA from the Pew Charitable Trusts, where she served as project manager for Pew’s Partnership for America’s Economic Success campaign. She has a Ph.D. in public policy from the George Washington University Trachtenberg School and a J.D. from Harvard Law School.
Acknowledgments
The authors are grateful to Lora Engdahl for her edits to this piece and for her extraordinary help and contributions to structuring the contents of this series of papers. We are also thankful to John Schmitt for his supervision of this project and to Lawrence Mishel for his guidance in earlier stages of the development of this research. We acknowledge Julia Wolfe for her assistance with the tables and figures in this report, Kayla Blado for her work disseminating the report and her assistance with the media, John Carlo Mandapat for the infographic that accompanies this report, and the rest of the communications staff at EPI for their contributions to the different components of this report and the teacher shortage series. We appreciate EPI communications director Pedro da Costa’s coordination of all the steps required for the publication of this report and of the series.
Data sources used in this report
The analyses presented in this report mainly rely on the Schools and Staffing Survey (SASS) 2011–2012, the Teacher Follow-up Survey (TFS) 2012–2013, and the National Teacher and Principal Survey (NTPS) 2015–2016. The surveys collect data on and from teachers, principals, and schools in the 50 states and the District of Columbia.20 All three surveys were conducted by the U.S. Census Bureau for the U.S. Department of Education. The survey results are housed in the National Center for Education Statistics (NCES), which is part of the Department of Education’s Institute of Education Sciences (IES).
The NTPS is the redesigned SASS, with a focus on “flexibility, timeliness, and integration with other Department of Education data” (NCES 2019). Both the NTPS and SASS include very detailed questionnaires at the teacher level, school level, and principal level, and the SASS also includes very detailed questionnaires at the school district level (NCES 2017). The TFS survey, which is the source of data on teachers who stay or quit, was conducted a year after the 2011–2012 SASS survey to collect information on the employment and teaching status, plans, and opinions of teachers in the SASS. Following the first administration of the NTPS, no follow-up study was done, preventing us from conducting an updated analysis of teachers by teaching status the year after the NTPS. NCES plans to conduct a TFS again in the 2020–2021 school year, following the 2019–2020 NTPS.
The 2015–2016 NTPS includes public and charter schools only, while the SASS and TFS include all schools (public, private, and charter schools).21 We restrict our analyses to public schools and teachers in public noncharter schools.
Digest of Education Statistics 2018
The Digest of Education Statistics 2018 (NCES 2018) provides “a compilation of statistical information covering the broad field of American education from prekindergarten through graduate school.” We use information included in “Chapter 3 Postsecondary Education.”
In the tables consulted, the information is available from 1970 to 2016–2017, which we reproduce in the appendix. In the body of the report, we focus on academic years 2008–2009 and 2015–2016 (the first year serves as a pre-recession marker and allows us to match it with the eldest information available in the Title II data (see below); 2015–2016 allows us to match it with the most recent NTPS data). Values for other years, including the SASS’s 2011–2012 data, the TFS’s 2012–2013 data, and several rates of change, are also shown in the appendix. The tables consulted are:
- Table 322.10. Bachelor’s degrees conferred by postsecondary institutions, by field of study: Selected years, 1970–71 through 2016–17 (available at: https://nces.ed.gov/programs/digest/d18/tables/dt18_322.10.asp)
- Table 323.10. Master’s degrees conferred by postsecondary institutions, by field of study: Selected years, 1970–71 through 2016–17 (available at: https://nces.ed.gov/programs/digest/d18/tables/dt18_323.10.asp)
- Table 324.10. Doctor’s degrees conferred by postsecondary institutions, by field of study: Selected years, 1970–71 through 2016–17 (available at: https://nces.ed.gov/programs/digest/d18/tables/dt18_324.10.asp)
Title II data
The Title II of the Higher Education Act of 1965 (HEA), “as amended in 2008 by the Higher Education Opportunity Act (HEOA), requires states to report annually on key elements of their teacher preparation programs and requirements for initial teacher credentialing, kindergarten through 12th grade.” (U.S. Department of Education 2016)
The U.S. Department of Education maintains a Title II website with a “Data Tools” tab linking to Excel spreadsheets with data on various measures for academic years 2008–2009 (the first available year of data) and subsequent years, up to the most recent available year (academic year 2015–2016). We use the spreadsheets for enrollees and completers22 of teacher preparation programs, for requirements for an initial teaching credential, and for states requiring content-specific bachelor’s degrees for all initial teaching credentials.
The “Data Tools” tab can be found here ( https://title2.ed.gov/Public/DataTools/Tables.aspx) and is cited as U.S. Department of Education 2017e in the references section. Specific spreadsheets used are:
- U.S. Department of Education 2017b (https://title2.ed.gov/Public/DataTools/NewExcels/EnrollmentProgramType.aspx)
- U.S. Department of Education 2017a (https://title2.ed.gov/Public/DataTools/NewExcels/CompletersProgramType.aspx)
- U.S. Department of Education 2017c (https://title2.ed.gov/Public/DataTools/NewExcels/Requirements.aspx)
- U.S. Department of Education 2017d (https://title2.ed.gov/Public/DataTools/NewExcels/ContentDegrees.aspx)
Appendix
The shares of credentialed staying teachers are smaller in high-poverty schools: Percentage-point difference between the share of teachers staying in high-poverty schools who have a given credential and the share of teachers staying in low-poverty schools with that credential
| Gap | |
|---|---|
| Fully certified | -1.8 |
| Took traditional route | -6.3 |
| Experienced (over 5 years) | -5.2 |
| Has ed. background in subject | -5.4 |
Notes: Data are for teachers in public noncharter schools. According to research and to the U.S. Department of Education, highly qualified teachers have the following four credentials: They are fully certified (with a regular, standard state certificate or advanced professional certificate versus not having completed all the steps); they took a traditional route into teaching (participated in a traditional certification program versus an alternative certification program, the latter of which is defined in the teacher survey questionnaire as “a program that was designed to expedite the transition of nonteachers to a teaching career, for example, a state, district, or university alternative certification program”); they are experienced (have more than five years of experience); and they have a background in the subject of main assignment; i.e., they have a bachelor's or master's degree majoring in the main teaching assignment field (general education, special education, or subject-matter specific degree) versus having no educational background in the subject of main assignment. A teacher is in a low-poverty school if less than 25 percent of the student body in his/her class is eligible for free or reduced-price lunch programs; a teacher is in a high-poverty school if 50 percent or more of the student body she/he teaches are eligible for those programs. Teaching status is determined by the reported status of teachers in the Teacher Follow-up Survey conducted for the 2012–2013 school year, one year after the Schools and Staffing Survey. Teachers who stay at the same school are teachers whose status the year after is “Teaching in this school.”
Source: Reproduced from Figure D in The Teacher Shortage is Real, Large and Growing, and Worse than We Thought (Garcia and Weiss 2019a). 2011–2012 Schools and Staffing Survey (SASS) microdata and 2012–2013 Teacher Follow-up Survey (TFS) microdata from the U.S. Department of Education's National Center for Education Statistics (NCES)
The shares of certified quitting teachers are larger in high-poverty schools: Percentage-point difference between the share of teachers quitting in high-poverty schools who have a given credential and the share of teachers quitting in low-poverty schools with that credential
| Gap | |
|---|---|
| Fully certified | 0.4 |
| Certified by the NBPTS | 6.1 |
| Took traditional route | -11.1 |
| Experienced (over 5 years) | -3.7 |
| Has ed. background in subject of main assignment | -9.5 |
Note: Data are for teachers in public noncharter schools in the 2011–2012 Schools and Staffing Survey (SASS). Teachers who quit are those who generated a vacancy in the 2012–2013 school year and are not in the profession (they left teaching, were on long-term leave, or were deceased). According to research and to the U.S. Department of Education, highly qualified teachers have the following four credentials: They are fully certified (with a regular, standard state certificate or advanced professional certificate versus not having completed all the steps); they took a traditional route into teaching (participated in a traditional certification program versus an alternative certification program, the latter of which is defined in the teacher survey questionnaire as “a program that was designed to expedite the transition of nonteachers to a teaching career, for example, a state, district, or university alternative certification program”); they are experienced (have more than five years of experience); and they have a background in the subject of main assignment; i.e., they have a bachelor's or master's degree majoring in the main teaching assignment field (general education, special education, or subject-matter specific degree) versus having no educational background in the subject of main assignment. The figure also provides information on an additional qualification—certification by the National Board for Professional Teaching Standards (NBPTS) in at least one content area. A teacher is in a low-poverty school if less than 25 percent of the student body in his/her class is eligible for free or reduced-price lunch programs; a teacher is in a high-poverty school if 50 percent or more of the student body she/he teaches are eligible for those programs. Teaching status is determined by the reported status of teachers in the Teacher Follow-up Survey conducted for the 2012–2013 school year, one year after the Schools and Staffing Survey.
Source: 2011–2012 Schools and Staffing Survey and 2012–2013 Teacher Follow-up Survey microdata from the National Center for Education Statistics (NCES)
Number of people awarded education degrees and degrees awarded as share of all degrees, by degree, various years from 1970–1971 to 2015–2016
| 1970–71 | 1980–81 | 1990–91 | 2000–01 | 2005–06 | 2006–07 | 2008–09 | 2009–10 | 2010–11 | 2011–12 | 2012–13 | 2013–14 | 2014–15 | 2015–16 | 2016–17 | Change 2008–09 to 2015–16 | Change 2011–12 to 2015–16 | Change 2008–09 to 2016–17 | |
|---|---|---|---|---|---|---|---|---|---|---|---|---|---|---|---|---|---|---|
| Degrees awarded in education | ||||||||||||||||||
| B.A. Education | 176,307 | 108,074 | 110,807 | 105,458 | 107,235 | 105,683 | 101,716 | 101,287 | 104,008 | 105,656 | 104,698 | 98,838 | 91,596 | 87,221 | 85,118 | -14.3% | -17.4% | -16.3% |
| B.A. Total | 839,730 | 935,140 | 1,094,538 | 1,244,171 | 1,485,104 | 1,524,729 | 1,601,399 | 1,649,919 | 1,716,053 | 1,792,163 | 1,840,381 | 1,870,150 | 1,894,969 | 1,920,750 | 1,956,032 | |||
| M.A. Education | 87,666 | 96,713 | 87,352 | 127,829 | 174,622 | 176,583 | 178,538 | 182,165 | 185,127 | 179,047 | 164,652 | 154,655 | 146,581 | 145,792 | 145,680 | -18.3% | -18.6% | -18.4% |
| M.A. Total | 235,564 | 302,637 | 342,863 | 473,502 | 599,862 | 610,703 | 662,082 | 693,313 | 730,922 | 755,967 | 751,718 | 754,582 | 758,804 | 785,757 | 804,684 | |||
| Ph.D. Education | 6,041 | 7,279 | 6,189 | 6,284 | 7,584 | 8,261 | 9,028 | 9,237 | 9,642 | 10,118 | 10,572 | 10,929 | 11,772 | 11,838 | 12,687 | 31.1% | 17.0% | 40.5% |
| Ph.D. Total | 64,998 | 98,016 | 105,547 | 119,585 | 138,056 | 144,694 | 154,564 | 158,590 | 163,827 | 170,217 | 175,026 | 177,587 | 178,548 | 178,134 | 181,352 | |||
| B.A.+M.A.+Ph.D. in education | 270,014 | 212,066 | 204,348 | 239,571 | 289,441 | 290,527 | 289,282 | 292,689 | 298,777 | 294,821 | 279,922 | 264,422 | 249,949 | 244,851 | 243,485 | -15.4% | -16.9% | -15.8% |
| B.A.+M.A.+Ph.D., all fields of study | 1,140,292 | 1,335,793 | 1,542,948 | 1,837,258 | 2,223,022 | 2,280,126 | 2,418,045 | 2,501,822 | 2,610,802 | 2,718,347 | 2,767,125 | 2,802,319 | 2,832,321 | 2,884,641 | 2,942,068 | |||
| Education degrees as a share of all degrees awarded | ||||||||||||||||||
| Total | 23.7% | 15.9% | 13.2% | 13.0% | 13.0% | 12.7% | 12.0% | 11.7% | 11.4% | 10.8% | 10.1% | 9.4% | 8.8% | 8.5% | 8.3% | -3.5 ppt. | -2.4 ppt. | -3.7 ppt. |
| B.A. | 21.0% | 11.6% | 10.1% | 8.5% | 7.2% | 6.9% | 6.4% | 6.1% | 6.1% | 5.9% | 5.7% | 5.3% | 4.8% | 4.5% | 4.4% | -1.8 ppt. | -1.4 ppt. | -2.0 ppt. |
| M.A. | 37.2% | 32.0% | 25.5% | 27.0% | 29.1% | 28.9% | 27.0% | 26.3% | 25.3% | 23.7% | 21.9% | 20.5% | 19.3% | 18.6% | 18.1% | –8.4 ppt. | -5.1 ppt. | -8.9 ppt. |
| Ph.D. | 9.3% | 7.4% | 5.9% | 5.3% | 5.5% | 5.7% | 5.8% | 5.8% | 5.9% | 5.9% | 6.0% | 6.2% | 6.6% | 6.6% | 7.0% | 0.8 ppt. | 0.7 ppt. | 1.2 ppt. |
Source: Digest of Education Statistics 2018 (U.S. Department of Education 2018), Table 322.10, Table 323.10, and Table 324.10
Number of people enrolled in or completing teacher preparation programs, by degree and program type, all school years from 2008–2009 to 2015–2016
| 2008–09 | 2009–10 | 2010–11 | 2011–12 | 2012–13 | 2013–14 | 2014–15 | 2015–16 | Change 2008–09 to 2015–16 | Change 2011–12 to 2015–16 | Change 2008–09 to 2016–17 | |
|---|---|---|---|---|---|---|---|---|---|---|---|
| Completers | |||||||||||
| Total completers | 217,400 | 216,484 | 214,063 | 198,958 | 189,166 | 175,276 | 167,639 | 157,901 | -27.4% | -20.6% | – |
| Traditional | 174,858 | 174,902 | 177,300 | 170,400 | 160,971 | 146,834 | 137,611 | 126,300 | -27.8% | -25.9% | – |
| Alternative– IHE | 17,750 | 18,280 | 16,868 | 13,946 | 12,849 | 12,484 | 11,985 | 12,494 | -29.6% | -10.4% | – |
| Alternative– not IHE | 24,792 | 23,302 | 19,895 | 14,612 | 15,346 | 15,958 | 18,043 | 19,107 | -22.9% | 30.8% | – |
| Enrollees | |||||||||||
| Total enrollees | 690,552 | 703,870 | 665,804 | 605,932 | 486,690 | 440,862 | 405,813 | 429,541 | -37.8% | -29.1% | – |
| Traditional enrollees | 609,106 | 615,842 | 592,890 | 544,014 | 430,757 | 382,036 | 346,055 | 337,690 | -44.6% | -37.9% | – |
| Alternative– IHE | 42,851 | 49,047 | 39,683 | 32,213 | 24,903 | 25,511 | 24,959 | 25,678 | -40.1% | -20.3% | – |
| Alternative– not IHE | 38,595 | 38,981 | 33,231 | 29,705 | 31,030 | 33,315 | 34,799 | 66,173* | 71.5%* | 122.8%* | – |
* Almost the entire change was driven by the increase in the number of enrollees in these programs in Texas.
Note: Data include totals for 50 states and the District of Columbia. IHE stands for institution of higher education. IHEs offer traditional and alternative teacher preparation programs. Alternative–not IHE refers to an alternative teacher preparation program provided by an entity other than an IHE.
Source: Higher Education Act Title II State Report Card System (U.S. Department of Education 2017a and 2017b)
Credentials of teachers who stay in their school versus who quit teaching: Share of teachers with various credentials and gap between teachers who stay and those who quit, by school type
| Low-poverty | High-poverty | |||||
|---|---|---|---|---|---|---|
| Teaching at same school | Left teaching | Gap between stayed and left | Teaching at same school | Left teaching | Gap between stayed and left | |
| Certification | ||||||
| Fully certified | 93.1% | 89.6% | 3.5 ppt. | 91.3% | 90.0% | 1.3 ppt. |
| Took traditional route into teaching | 89.6% | 88.8% | 0.8 ppt. | 83.3% | 77.7% | 5.6 ppt. |
| Experience | ||||||
| Experienced (more than 5 years) | 83.7% | 79.0% | 4.7 ppt. | 78.6% | 75.4% | 3.2 ppt. |
| Education | ||||||
| Educational background in subject of main assignment | 72.5% | 68.8% | 3.7 ppt. | 67.1% | 59.3% | 7.8 ppt. |
Notes: Data are for teachers in public noncharter schools. According to research and to the U.S. Department of Education, highly qualified teachers have the following four credentials: They are fully certified (with a regular, standard state certificate or advanced professional certificate versus not having completed all the steps); they took a traditional route into teaching (participated in a traditional certification program versus an alternative certification program, the latter of which is defined in the teacher survey questionnaire as “a program that was designed to expedite the transition of nonteachers to a teaching career, for example, a state, district, or university alternative certification program”); they are experienced (have more than five years of experience); and they have a background in the subject of main assignment; i.e., they have a bachelor's or master's degree majoring in the main teaching assignment field (general education, special education, or subject-matter specific degree) versus having no educational background in the subject of main assignment. A teacher is in a low-poverty school if less than 25 percent of the student body in his/her class is eligible for free or reduced-price lunch programs; a teacher is in a high-poverty school if 50 percent or more of the student body she/he teaches are eligible for those programs. Teaching status is determined by the reported status of teachers in the Teacher Follow-up Survey conducted for the 2012–2013 school year, one year after the Schools and Staffing Survey. Teachers who stay at the same school are teachers whose status the year after is “Teaching in this school.” Teachers who left teaching are those who generated a vacancy in the 2012–2013 school year and are not in the profession (they left teaching, were on long-term leave, or were deceased). Not included in the table are teachers who generated a vacancy in the school year but remained in the profession (i.e., left to teach in another school or were on short-term leave and planned to return to the school).
Source: Reproduced from The Teacher Shortage is Real, Large and Growing, and Worse than We Thought (Garcia and Weiss 2019a). 2011–2012 Schools and Staffing Survey (SASS) microdata and 2012–2013 Teacher Follow-up Survey (TFS) microdata from the U.S. Department of Education's National Center for Education Statistics (NCES)
Endnotes
1. For a more detailed review of the media coverage of the shortage, see García and Weiss 2019a.
2. Teacher demand-side drivers are linked to the need for teachers, i.e., how many teachers are needed for a given number of students with a given set of needs, or with the size of school budgets. Supply-side drivers are linked to the number of qualified people who are available and willing to teach, i.e., the number of people interested in and training to be teachers and the attachment existing teachers feel to the profession.
3. Sorensen and Ladd note that class sizes did not generally increase as a result of high teacher turnover in North Carolina, likely because of state policies that preclude increasing class size to accommodate teacher vacancies. On average, across math and English language arts (ELA) classes in middle school, 20.9 percent of teachers have three or fewer years of experience, 12.0 percent have lateral or provisional licenses, and 29.5 percent are teaching out of their subject of certification. Licensure exam scores of middle school math and ELA teachers are, on average, 0.13 standard deviations below the mean of all teachers. For a comparison with national-level shares, see García and Weiss 2019a.
4. This finding contrasts with prior suggestions by Hanushek and others that, because teachers who leave tend to be less able and skilled, their exit will improve the quality of a schools’ teaching pool (Hanushek and Rivkin 2007). This perspective reduces pressure to adopt policies that encourage the retention of teachers, overlooking the trade-off between the qualifications and quality of teachers who leave and those who come (Sorensen and Ladd 2018).
5. Notwithstanding this evidence of the short-term decrease in people awarded teaching degrees or completing teacher preparation programs, Cowan et al. (2016) note that “teacher production has grown steadily since the mid-1980s.” They add that this increase “has more than kept up with increases in student enrollment in public schools.” The long-term view provides a broader context but in a way hides short-term issues that more closely affect today’s teacher labor markets. Indeed, the short-term trend is one in which the number of pupils increased, so unless there is an intention to scale back staffing, any decline of the teacher pool is problematic.
6. Traditional teacher preparation programs are typically undergraduate programs offered by institutions of higher education (IHEs) and entered into by individuals who enter college with the goal of becoming a teacher (U.S. Department of Education 2016). (Programs at IHEs leading to a master’s of the arts degree in education are also often considered traditional programs.) Alternative programs are almost exclusively post-baccalaureate programs that require a bachelor’s degree for admission to the program, offered by IHEs, private or nonprofit organizations, state or local education agencies, or partnerships of entities. (For main differences between traditional and alternative teacher preparation programs, see U.S. Department of Education 2015 and U.S. Department of Education 2016.) The requirements for alternative routes to a teaching certificate vary significantly across states.
7. Teachers from alternative routes have been found to be more effective in some studies (Xu, Hannaway, and Taylor 2011), as effective as teachers from traditional programs in other research (Whitford, Zhang, and Katsiyannis 2017, Clark et al. 2017; Kane, Rockoff, and Staiger 2008), and less effective than their peers (Darling-Hammond et al. 2005). After assessing the pros and cons of both types of programs, Fraser and Lefty (2018) acknowledge that “advocates for alternative approaches claim that education schools are hopelessly stuck and unlikely to reform, and that alternative routes represent the optimal way to prepare new teachers for twenty-first-century classrooms” but conclude that “the university is the proper home for teacher preparation and that the rise of alternative routes is a mostly negative development.
8. Moreover, in our analysis of the National Teacher and Principal Survey (NTPS) 2015–2016 data (to be published in a forthcoming paper in this series), we find that, on average, teachers who enter teaching from alternative programs feel less prepared to do their jobs in the classroom (García and Weiss 2019b).
9. Vacancies and hires may happen for any of a number of reasons, including a school’s need to replace teachers who left the school or quit teaching, to increase the number of teachers in order to offer additional subjects or reduce the student-to-teacher ratio, to adapt to increases in student enrollment, etc. These factors, which differ across schools, may point to greater difficulties hiring in some schools, but our data do not allow us to explore vacancies that arise due to curriculum changes and other factors mentioned in this note.
10. A school may end up filling in a vacancy in a temporary manner, or may make some adjustment to cover the vacancy, for example by expanding a class size or finding an underprepared teacher.
11. See Ingersoll (2014) for a comparison of attrition among teachers and their peers in most occupations (discussed later in this report). See Goldring, Taie, and Riddles (2014) for the evolution of rates of stayers, movers, and leavers among public school teachers between 1988–1989 and 2012–2013 (Table 1 in their report). See Darling-Hammond et al. (2017) for some notes on the attrition and turnover rates in the U.S. and other jurisdictions. Some of the comparisons yield only modest gaps.
12. These shares are based on data that follows individuals over time, whereas the information in Table 4 is based on the characteristics of the 2011–2012 teaching cohort. They offer complementary information to each other.
13. Using the SASS data and classifying schools by eligibility of Title I funds, Sutcher et al. (2016) find that attrition of full-time teachers was approximately 55 percent higher in high-poverty schools (schools eligible for Title I funds) than in low-poverty schools (schools ineligible for Title I). Using data from North Carolina, Sorensen and Ladd (2018) find that “an urban school with high levels of student poverty faces an average turnover rate of over 34 percent versus just above 20 percent in low-poverty rural schools” (p. 13). Title I of the Elementary and Secondary Education Act of 1965 (20 U.S.C. 6301 et seq.) provides financial assistance to local educational agencies (LEAs) and public schools with high numbers or percentages of poor children to help ensure that all children meet challenging state academic content and student academic achievement standards.
14. See summary in García and Weiss (2019a). A caveat is that the credentials by teaching status are not independent from the reasons why teachers stay, quit, or leave. For example, teachers who are close to retirement are likely to have more experience, be fully certified, etc.).
15. The share of teachers who are certified by the NBPTS is larger among teachers who leave the profession than among teachers who stay (18.3 percent versus 16.6; this may be driven by teachers who are retiring).
16. Early career teachers are more likely to quit than middle-career teachers (Allensworth, Ponisciak, and Mazzeo 2009; Guarino, Santibáñez, and Daley, 2006; Ingersoll 2001). Podolsky et al. 2016 estimate that attrition rates after five years in teaching are “at least” 19 percent using longitudinal data and explain that the rate with national cross-sectional data was about 30 percent (Podolsky et al. 2016; Darling-Hammond and Sykes 2003).
17. As we noted in our previous study, “in both types of schools, the credentials of teachers who stay in the school are better than those of teachers who quit teaching altogether. But the differences are narrower for teachers in high-poverty schools (with the exception of the share of teachers who majored in their subject of main assignment).” (García and Weiss 2019a)
18. The share of certified teachers who quit is larger (a gap of 0.4 percentage points), and the share of NBPTS certified teachers is larger (by 6.1 percentage points). The share of teachers who entered the profession following alternative certification programs is smaller (by 11.1 percentage points), and a substantially smaller share has an educational background in the subject of main assignment (by 9.5 percentage points).
19. The shortage could occur even if demand were decreasing or staying constant, if supply decreased more drastically, or if supply stayed constant (or increased insufficiently). A shortage can be explained starting from a change in demand, or starting from a change in supply, as it is a gap, or difference, or imbalance between two curves.
20. The 2015–2016 NTPS does not produce state-representative estimates. The forthcoming 2017–2018 NTPS will support state-level estimates.
21. The forthcoming 2017–2018 NTPS additionally includes the private sector.
22. Information for completers is available for school years before 2008–2009, but not for the breakdown by type of institution shown in the tables.
References
Allensworth, Ellen, Stephen Ponisciak, and Christopher Mazzeo. 2009. The Schools Teachers Leave: Teacher Mobility in Chicago Public Schools. Consortium on Chicago School Research at the University of Chicago Urban Education Institute, June 2009.
Carroll, T.G. 2007. Policy Brief: The High Cost of Teacher Turnover. National Commission on Teaching and America’s Future.
Carver-Thomas, Desiree, and Linda Darling-Hammond. 2017. Teacher Turnover: Why It Matters and What We Can Do About It. Learning Policy Institute, August 2017.
Clark, Melissa A., Eric Isenberg, Albert Y. Liu, Libby Makowsky, and Marykate Zukiewicz. 2017. Impacts of the Teach for America Investing in Innovations Scale-Up. Mathematica Policy Research, February 2017.
Cowan, James, Dan Goldhaber, Kyle Hayes, and Roddy Theobald. 2016. “Missing Elements in the Discussion of Teacher Shortages.” Educational Researcher 45, no. 8: 460–462. https://doi.org/10.3102/0013189×16679145.
Darling-Hammond, Linda, Dion Burns, Carol Campbell, A. Lin Goodwin, Karen Hammerness, Ee-Ling Low, Ann McIntyre, Mistilina Sato, and Ken Zeichner. 2017. Empowered Educators: How High-Performing Systems Shape Teaching Quality Around the World, 1st Edition. San Francisco: Jossey-Bass.
Darling-Hammond, Linda. 1999. Teacher Quality and Student Achievement: A Review of State Policy Evidence. Center for the Study of Teaching and Policy, University of Washington, December 1999.
Darling-Hammond, Linda, Deborah J. Holtzman, Su Jin Gatlin, and Julian Vasquez Heilig. 2005. Does Teacher Preparation Matter? Evidence about Teacher Certification, Teach for America, and Teacher Effectiveness. Education Policy Analysis Archives 13, no. 42. https://doi.org/10.14507/epaa.v13n42.2005.
Darling-Hammond, Linda, and Gary Sykes. 2003. “Wanted: A National Teacher Supply Policy for Education: The Right Way to Meet the ‘Highly Qualified Teacher’ Challenge.” Education Policy Analysis Archives 11, no. 33.
Fraser, James W., and Lauren Lefty. 2018. Three Turbulent Decades in the Preparation of American Teachers: Two Historians Examine Reforms in Education Schools and the Emergence of Alternative Routes to Teaching. Johns Hopkins School of Education, Institute for Education Policy, September 2018.
García, Emma, and Elaine Weiss. 2019a. The Teacher Shortage Is Real, Large and Growing, and Worse Than We Thought: Report 1 in the “Perfect Storm in the Teacher Labor Market” series. Economic Policy Institute, March 2019.
García, Emma, and Elaine Weiss. 2019b. Insufficient Teacher Preparation and Support Challenge Recruitment and Drive Exits, Especially in High-Poverty Schools. Report 5 in the “Perfect Storm in the Teacher Labor Market” series. Economic Policy Institute, forthcoming 2019.
Goldring, Rebecca, Soheyla Taie, and Minsun Riddles. 2014. Teacher Attrition and Mobility: Results From the 2012–13 Teacher Follow-up Survey (NCES 2014-077). U.S. Department of Education. Washington, DC: National Center for Education Statistics.
Guarino, Cassandra M., Lucrecia Santibáñez, and Glenn A. Daley. 2006. “Teacher Recruitment and Retention: A Review of the Recent Empirical Literature.” Review of Educational Research 76, no. 2: 173–208.
Hanushek, Eric A., and Steven G. Rivkin. 2007. “Pay, Working Conditions, and Teacher Quality.” The Future of Children 17, no. 1: 69–86.
Hanushek, Eric A., Steven G. Rivkin, and Jeffrey C. Shiman. 2016. “Dynamic Effects of Teacher Turnover on the Quality of Instruction.” National Center for Analysis of Longitudinal Data in Education Research (CALDER) Working Paper no. 170, November 2016.
Ingersoll, Richard M. 2001. “Teacher Turnover and Teacher Shortages: An Organizational Analysis.” American Educational Research Journal 38, no. 3: 499–534. https://doi.org/10.3102/00028312038003499.
Ingersoll, Richard M. 2004. “Revolving Doors and Leaky Buckets.” In Letters to the Next President: What We Can Do about the Real Crisis in Public Education, edited by Carl D. Glickman, 141–150. New York: Teachers College Press.
Ingersoll, Richard M. 2014. “Why Do High-Poverty Schools Have Difficulty Staffing Their Classrooms with Qualified Teachers?” Presentation for panel discussion How Do We Get Experienced, Accomplished Teachers into High-Need Schools?,” Albert Shanker Institute, October 8, 2014.
Kane, Thomas J., Jonah E. Rockoff, and Douglas O. Staiger. 2008. “What Does Certification Tell Us About Teacher Effectiveness? Evidence from New York City.” Economics of Education Review 27, no. 6: 615–631.
Kraft, Matthew A., and John P. Papay. 2014. “Can Professional Environments in Schools Promote Teacher Development? Explaining Heterogeneity in Returns to Teaching Experience.” Educational Evaluation and Policy Analysis 36, no. 4: 476–500.
Ladd, Helen F., and Lucy C. Sorensen. 2016. “Returns to Teacher Experience: Student Achievement and Motivation in Middle School.” Education Finance and Policy 12, no. 2: 241–279.
Leachman, Michael, Kathleen Masterson, and Eric Figueroa. 2017. A Punishing Decade for School Funding. Center on Budget and Policy Priorities, November 2017.
Leachman, Michael, and Eric Figueroa. 2019. K-12 School Funding Up in Most 2018 Teacher-Protest States, But Still Well Below Decade Ago. Center on Budget and Policy Priorities, November 2017.
Learning Policy Institute (LPI). 2017. What’s the Cost of Teacher Turnover? (calculator). September 2017.
National Center for Education Statistics (NCES) (U.S. Department of Education). 2017. Documentation for the 2011–12 Schools and Staffing Survey. March 2017.
National Center for Education Statistics (NCES) (U.S. Department of Education). 2018. Digest of Education Statistics: 2018.
National Center for Education Statistics (NCES) (U.S. Department of Education). 2019. “NTPS Overview” (web page), accessed March 2019.
Podolsky, Anne, Tara Kini, Joseph Bishop, and Linda Darling-Hammond. 2016. Solving the Teacher Shortage: How to Attract and Retain Excellent Educators. Learning Policy Institute, September 2016.
Redding, Christopher, and Thomas M. Smith. 2016. “Easy In, Easy Out: Are Alternatively Certified Teachers Turning Over at Increased Rates?” American Educational Research Journal 53, no. 4: 1086–1125. https://doi.org/10.3102/0002831216653206.
Ronfeldt, Matthew, Susanna Loeb, and James Wyckoff. 2013. “How Teacher Turnover Harms Student Achievement.” American Educational Research Journal 50, no. 1: 4–36.
Sorensen, Lucy C., and Helen Ladd. 2018. “The Hidden Costs of Teacher Turnover.” National Center for Analysis of Longitudinal Data in Education Research (CALDER) Working Paper no. 203-0918-1, September 2018.
Sutcher, Leib, Linda Darling-Hammond, and Desiree Carver-Thomas. 2016. A Coming Crisis in Teaching? Teacher Supply, Demand, and Shortages in the U.S. Learning Policy Institute, September 2016.
U.S. Department of Education. 2015. Alternative Teacher Preparation Programs, June 2015.
U.S. Department of Education. 2016. Preparing and Credentialing the Nation’s Teachers: The Secretary’s 10th Report on Teacher Quality, August 2016.
U.S. Department of Education. 2017a. “Completers, by State, by Program Type” [data table]. Data from the Higher Education Act Title II State Report Card (SRC) Reporting System. Spreadsheet downloadable at https://title2.ed.gov/Public/DataTools/NewExcels/CompletersProgramType.aspx.
U.S. Department of Education. 2017b. “Enrollment, by State, by Program Type” [data table]. Data from the Higher Education Act Title II State Report Card (SRC) Reporting System. Spreadsheet downloadable at https://title2.ed.gov/Public/DataTools/NewExcels/EnrollmentProgramType.aspx.
U.S. Department of Education. 2017c. “Requirements for an Initial Teaching Credential, by State” [data table]. Data from the Higher Education Act Title II State Report Card (SRC) Reporting System. Spreadsheet downloadable at https://title2.ed.gov/Public/DataTools/NewExcels/Requirements.aspx.
U.S. Department of Education. 2017d. “States Requiring Content Specific Bachelor’s Degrees for All Initial Teaching Credentials” [data table]. Data from the Higher Education Act Title II State Report Card (SRC) Reporting System. Spreadsheet downloadable at https://title2.ed.gov/Public/DataTools/NewExcels/ContentDegrees.aspx.
U.S. Department of Education. 2017e. Higher Education Act Title II State Report Card (SRC) Reporting System [data series]. Office of Postsecondary Education. Data accessed via data tools at https://title2.ed.gov/Public/DataTools/Tables.aspx.
Whitford, Denise K., Dake Zhang, and Antonis Katsiyannis. 2017. “Traditional vs. Alternative Teacher Preparation Programs: A Meta-Analysis.” Journal of Child and Family Studies 27, no. 3: 671–685.
Xu, Zeyu, Jane Hannaway, and Colin Taylor. 2011. “Making a Difference? The Effects of Teach For America in High School.” Journal of Policy Analysis and Management 30, no. 3: 447–469. https://doi.org/10.1002/pam.20585.

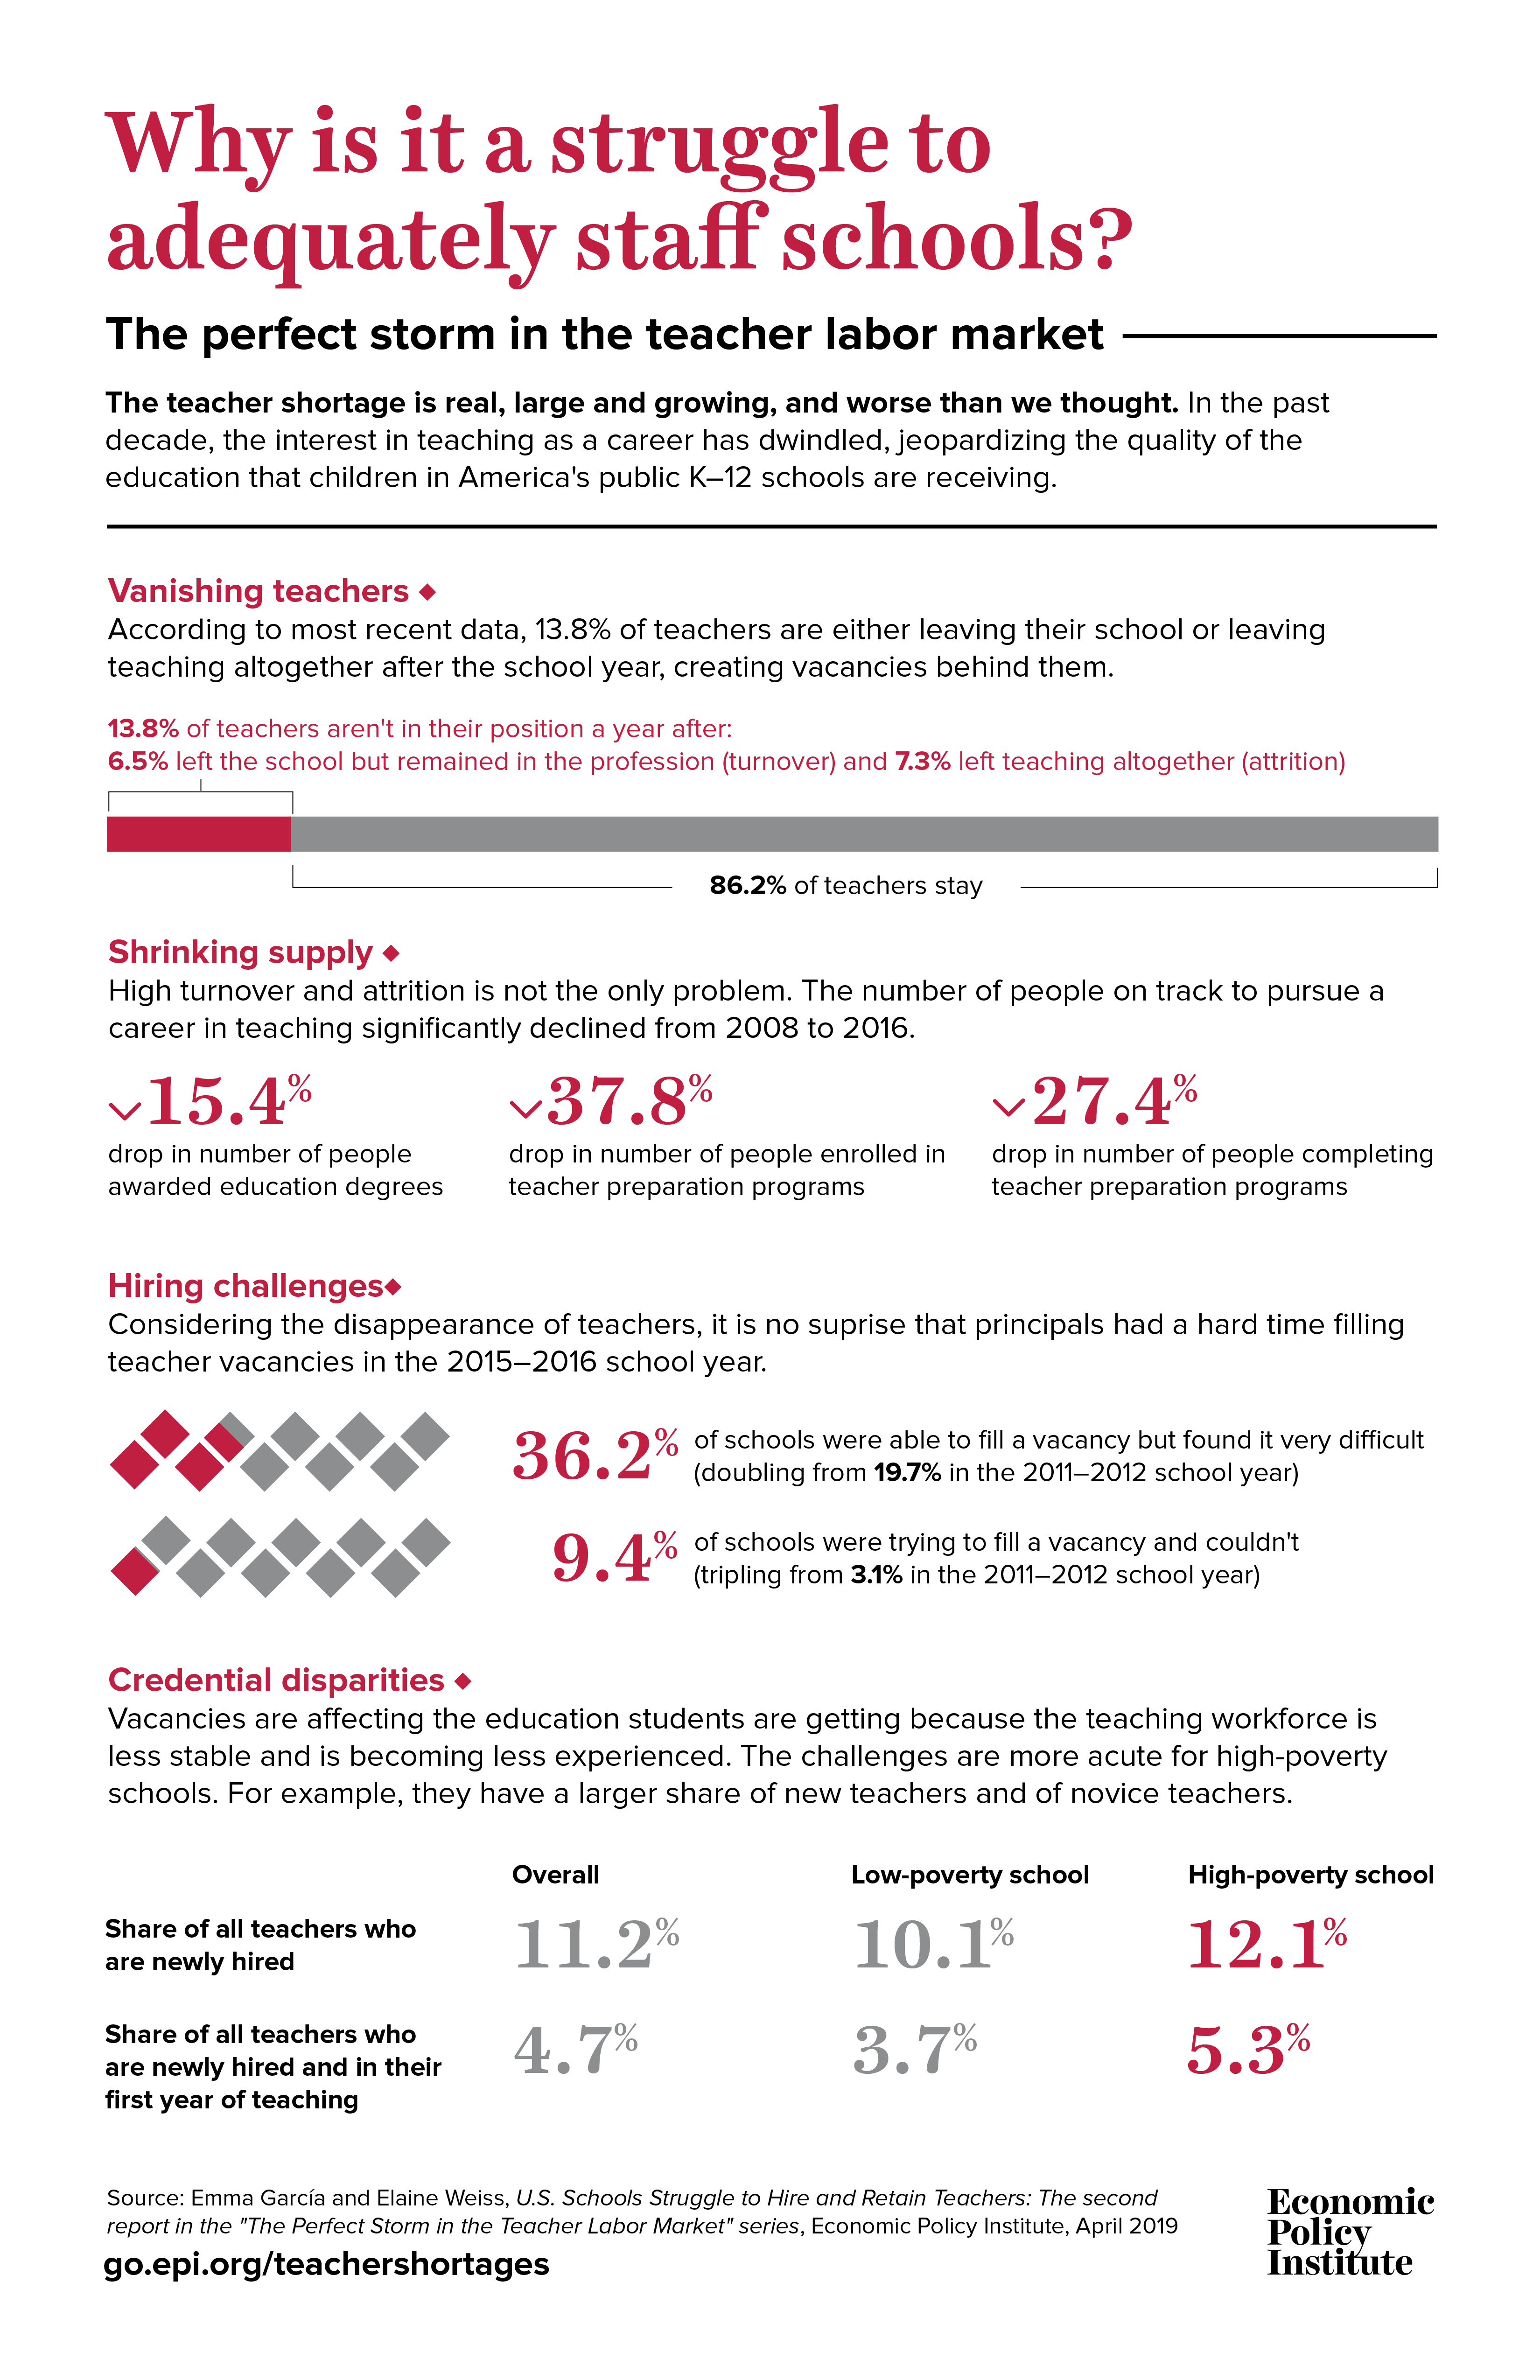