Full Report
The United States became the richest country in the world in the 20th century in large part thanks to universal public education. But trends in recent years threaten the continuing quality of public schools. Public investments in education saw a disturbing pullback in the decade before the COVID-19 pandemic as many state governments prioritized tax cuts over education spending. While significant federal relief for education in response to the pandemic has buoyed spending, this federal support will ebb in the coming years.
The Trump administration is seeking to hobble or even abolish the Department of Education and undermining federal efforts to support public schools. Earlier this summer they impounded $6.2 billion previously allocated by Congress and put their full support behind efforts to privatize public education in their recently passed 2025 reconciliation package. This provision would provide dollar-for-dollar federal tax credit designed to support private and religious K–12 schools, costing the federal government tens of billions of dollars per year (Davis 2025).
At the state level, the increasing use of universal voucher policies threatens to divert even more funds away from public-school systems and to worsen the quality of education for students remaining in public schools. And in recent years, debates about banning books and diversity, equity, and inclusion curricula decisions have eclipsed discussions on the damage caused by pulling back resources for public schools. Wherever one comes down on debates about the precise curriculum taught in public schools, arguing that it should be taught less with less funding and under-resourced teachers and classrooms, is misguided at best. Yet that is where too many school systems in the U.S. are heading, making it urgent to pay more attention to current trends and debates about the level of resources available to our public schools.
The terrible irony is that these efforts to reduce investments in public schools come on the heels of a recent wave of academic research highlighting just how valuable new investments in public education can be. For decades before the 2010s, it became mainstream to claim that the level of spending on K–12 education was not a primary determinant of student success and that incremental additions to per-pupil spending would disappoint in terms of the extra academic and later life success they would generate. In this view, it was the composition and the use of spending, not the levels, that should be a first-order concern of policymakers. The new wave of research has revealed that this is incorrect: The level of spending per pupil has large effects on student success, and additions to this level of spending are the most reliable educational policy tool we have to help children succeed academically and as adults. This report examines data on educational spending and reviews research linking this spending to various economic outcomes. The sweep of the evidence is clear: The U.S. should devote more resources to ensure that all children have access to an excellent public education and veer off the current destructive path of starving public schools of needed resources.
Key findings:
- The best measure of quality-adjusted spending on public education is per-pupil public spending on K–12 education as a share of per capita potential gross domestic product (GDP). This measure accounts for the fact that as the economy grows richer, key educational inputs (like teachers’ salaries) must rise in line with the rest of the labor market to keep quality constant.
- This quality-adjusted measure rose throughout the 1970s and 1980s, reflecting a continuous increase in public education investments. However, this spending growth slowed in the 1990s and even fell after the Great Recession in 2008, reflecting society’s lagging investment in public education.
- Increases in educational spending between the 1960s and 1990s were due in large part to an expansion in the scope of services public schools provided their communities—e.g., spending on special education programs or food—and not an increase in instructional resources. Given this, it shouldn’t be surprising that these increases did not directly translate into higher test scores for the general population of public schools.
- Currently, the U.S. ranks extremely low among its peer countries in educational spending, with 22 countries providing more investment effort for public education, as measured by per-pupil spending divided by per capita GDP.
- Disparities in school spending between districts are stark. High-income districts spend more than is necessarily required to meet educational standards, while low-income districts are underspending relative to what is needed to meet basic adequacy thresholds. In 2019, spending in higher-poverty districts was $4,000 below the per student threshold, while spending in lower-poverty districts was $5,700 above the per student threshold.
- While researchers have debated for decades about the importance of the level of per-pupil spending on student outcomes and the social rate of return of incremental spending level increases, a new wave of the robust research has shown that additional money in public schools directly increases the test scores of public school students, with greater effects for students in low-income districts.
- In high-poverty and medium-poverty districts, there often exist large gaps between current spending levels and the levels needed to lift all students in the district to “adequate” performance on achievement measures.
- Between 1995 and 2008, the average “adequacy gap” in per-pupil spending expanded as many states significantly reduced education budgets.
- This increase in the average adequacy gap was much more pronounced in states with a Republican trifecta governing.
- Privatization and universal voucher programs threaten the funding of public schools. There is no evidence that students that take up vouchers do better academically and voucher programs burden state budgets by subsidizing private education.
How much do we spend on public education? Where does that money go?
Figure A shows average per-pupil spending in the United States as well as its composition in 2021 (expressed in $2024). The average per-pupil spending for public schools was $18,777—an unusually high spending level due to the federal Elementary and Secondary School Emergency Relief Funds that went to state and local governments to help them make investments to allow children to regain educational ground potentially lost because of school closures and disruptions during the COVID-19 pandemic. On average, pandemic-related fiscal aid boosted per-pupil spending by $597 in 2021.
Of the $18,777 spent on average per pupil, nearly $16,422 went directly toward supporting children’s elementary and secondary education, including expenses for instruction and instructional equipment (like technology and school supplies), student services (like transportation, food, and medical services), general administration costs, and operation and maintenance expenses. Less than one-third of per-pupil spending went to salaries, which average roughly $6,089 per student. An additional $1,848 per student went toward capital outlays, which include the construction of buildings. Of the $2,217 “Other” expenditures, $1,131 went to operation and maintenance of buildings, including electricity, heating, and plumbing. Transportation and food, while crucial to student success, were a very small share of overall funding at $576 and $500 per pupil, respectively.
Education spending primarily goes towards instruction: Total per-pupil expenditures by function, 2021
| Per-pupil spending | |
|---|---|
| Instruction, salaries | $6,089 |
| Instruction, other | $3,883 |
| Other | $2,217 |
| Student & instructional support | $1,900 |
| Capital outlay | $1,848 |
| General & school administration | $1,260 |
| Transportation | $576 |
| Interest, school debt | $505 |
| Food services | $500 |

Note: Expenditures are in real 2024 dollars.
Source: EPI analysis of National Center for Education Statistics (2025a) data.
Trends in school funding over time and how to assess its effectiveness
To get a sense of how funding has changed over time, Figure B shows total spending on public education, adjusted for inflation, divided by the number of school-age children in the U.S. since 1960. Based on this measure alone, one may conclude that the nation has displayed an admirable willingness to boost society’s resources for providing public education. For example, between 1960 and 2021, spending per child for public education rose from $3,801 to $18,777.
Long-run spending on education requires closer examination: Total per-pupil expenditures on education, 1960–2021
| School year | Total expenditure per pupil |
|---|---|
| 1960 | $3,801 |
| 1962 | $4,108 |
| 1964 | $4,300 |
| 1966 | $4,793 |
| 1968 | $5,412 |
| 1970 | $5,945 |
| 1971 | $6,292 |
| 1972 | $6,514 |
| 1973 | $6,607 |
| 1974 | $6,700 |
| 1975 | $7,074 |
| 1976 | $7,352 |
| 1977 | $7,395 |
| 1978 | $7,617 |
| 1979 | $7,664 |
| 1980 | $7,790 |
| 1981 | $7,853 |
| 1982 | $8,063 |
| 1983 | $8,334 |
| 1984 | $8,674 |
| 1985 | $9,015 |
| 1986 | $9,556 |
| 1987 | $9,916 |
| 1988 | $10,317 |
| 1989 | $10,862 |
| 1990 | $11,310 |
| 1991 | $11,571 |
| 1992 | $11,577 |
| 1993 | $11,651 |
| 1994 | $11,779 |
| 1995 | $11,914 |
| 1996 | $12,047 |
| 1997 | $12,380 |
| 1998 | $12,896 |
| 1999 | $13,328 |
| 2000 | $13,738 |
| 2001 | $14,341 |
| 2002 | $14,861 |
| 2003 | $15,048 |
| 2004 | $15,200 |
| 2005 | $15,467 |
| 2006 | $15,814 |
| 2007 | $16,362 |
| 2008 | $16,784 |
| 2009 | $17,213 |
| 2010 | $16,857 |
| 2011 | $16,243 |
| 2012 | $15,852 |
| 2013 | $15,717 |
| 2014 | $15,885 |
| 2015 | $16,491 |
| 2016 | $16,989 |
| 2017 | $17,367 |
| 2018 | $17,670 |
| 2019 | $18,233 |
| 2020 | $18,631 |
| 2021 | $18,777 |
Notes: Expenditures are in real 2024 dollars. The year denotes the end of the school year. 2021 refers to FY 2020–2021.
Source: EPI analysis of National Center for Education Statistics (2025b) data.
This upward trend in real education spending is sometimes compared unfavorably with measures of student achievement that didn’t rise as quickly over this period to foster the impression that this additional spending has had disappointingly small payoffs (Elbaum 2023; Mueller 2024). But this conclusion is too simplistic and fails to account for key functions performed by public schools and the fact that they must compete with other sectors for key inputs (like labor).
First, public schools in the United States serve many functions; fostering success in academic achievement evaluations is only one such function. Public schools also are a primary provider of nutrition and health needs for millions of students: Roughly 30 million students received school lunch every day in 2024 (USDA 2025), with over 20 million of these for free or reduced-price. More than 15 million students received breakfast each day in 2024, with over 12 million for free or reduced-price (USA 2025). Schools also are the locus for integrating new residents of the United States into society. And they provide credentials and skills to help students achieve success in the labor market as adults.
Since 1960, the number and scope of functions provided by public schools and the populations they serve have increased dramatically. Rothstein and Hawley (1995) and Rothstein (1997) highlighted the public-school spending functions that grew the fastest in nine representative school districts between 1967 and the mid-1990s. Over time, the functions and populations that have seen the fastest growth have not necessarily been those that might be expected to boost the achievement scores of the general student population. For example, a disproportionately large share of spending growth from 1967 to 1996 could be accounted for by the rise spending on special education—the integration of children with disabilities or particular needs who were historically kept out of public schooling. This particular rise in spending stemmed from society’s increasing recognition that these children and their families deserve the right to public education and its benefits. But this type of spending, while important, will likely not translate directly into improved test scores for the general population of public schools. Of the seven districts surveyed in Rothstein’s report, special education accounted for 3.6% of total expenditures in 1967, but by 1996, this share increased to 19%. Food similarly increased as a share of the budget in these seven districts, from 1.9% in 1967 to 4.8% in 1996.
While these exact spending breakdowns do not exist in the NCES data we examine in this report, the data points we do have confirm that special education remains a large spending priority in K–12 public schools. In 2000, the Special Education Expenditure Project conducted a nationwide survey and confirmed the findings of Rothstein and Hawley (1995) and Rothstein (1997), finding that special education accounted for 21% of overall education spending (Lieberman 2024). Using district-level data on special education spending in 2021 for the 70% of districts that reported special education spending, we found that special education spending accounted for 14.7% of all elementary and secondary education expenditures, still a fivefold increase over what prevailed in the late 1960s. Food spending has also remained high, representing 3.6% of budgets in 2021.
The second reason why comparing school spending with educational outcomes over time can be misleading for drawing conclusions about the efficacy of spending is that schools are in competition with other economic sectors to purchase inputs, like labor. This means that school spending needs to rise in line with overall economic growth to attract the same level and quality of inputs over time. In other words, it is not enough for spending to just rise with inflation—it must also rise with gains in economy-wide productivity. This is especially relevant when we are talking about the teaching workforce. If teachers’ pay only rose with the rate of inflation, their pay relative to other college-educated professionals would rapidly fall and schools would find themselves with a smaller and lower-quality pool of potential teachers to hire. This dynamic whereby teachers’ wages and other school inputs must grow in line with overall economic growth just to maintain a constant level of quality is called the Baumol effect.
Given that public-school spending per pupil must keep pace with economic growth to avoid eroding in its real effectiveness, assessing how well spending trends have maintained educational effectiveness over time requires one to scale this spending against some measure of overall economic growth. Figure C shows potential GDP per capita and education funding per pupil since 2010, in aggregate and in parts. We use 2010 as our starting year because substantial federal fiscal aid to state and local governments was provided in 2009 and 2010 as part of the American Recovery and Reinvestment Act. While this aid was not earmarked for education, state and local fiscal resources are fungible, and any aid meant that it was easier to keep education spending stable in the face of the recessionary shocks. Further, the 2010 elections saw a wave of Republican state governments take power, and this partisan shift is strongly predictive of sharp cutbacks in education spending (as we show later in this paper). We use a measure of potential GDP rather than actual GDP because the steep recession of 2008–2009 left actual GDP significantly depressed, but decisions about long-run investment decisions—like public school investments—should not be conditioned on how high the current unemployment rate is. Instead, they should be conditioned on what is the long-run sustainable base of GDP to finance these investments from.
Educational spending has not maintained effectiveness over time: Growth in potential GDP per capita, total K–12 school spending, and spending on instruction, fall 2009–2022
| Potential GDP per capita | Total elementary and secondary expenditures | Instruction | |
|---|---|---|---|
| 2009 | 1 | 1 | 1 |
| 2010 | 0.997838006 | 0.982032744 | 0.979308152 |
| 2011 | 1.006800554 | 0.980088841 | 0.968143721 |
| 2012 | 1.022348401 | 0.979888926 | 0.965546844 |
| 2013 | 1.036397084 | 1.000979922 | 0.984405923 |
| 2014 | 1.058267793 | 1.031095473 | 1.016876374 |
| 2015 | 1.070284654 | 1.043077301 | 1.032571532 |
| 2016 | 1.08292338 | 1.063154882 | 1.05157993 |
| 2017 | 1.101119544 | 1.079342539 | 1.062077563 |
| 2018 | 1.120569171 | 1.115087134 | 1.092118281 |
| 2019 | 1.141799731 | 1.132544459 | 1.111662091 |
| 2020 | 1.162377372 | 1.161983243 | 1.138876265 |
Note: Total expenditures include total current expenditures for elementary and secondary services, capital gains, and interest payment on debt.
Source: EPI analysis of data from the Bureau of Economic Analysis and the National Center for Education Statistics, Common Core of Data.
Following the Great Recession in 2008 and the slow ensuing recovery, growth in per-pupil expenditures stagnated and fell further behind GDP growth.
One key change in the overall economy that has made it more difficult for schools to attract the teaching workforce they need is the increase in opportunities for women in the wider job market. While women’s labor force participation rose sharply from the early 1960s until the late 1990s, occupational segregation often confined women to a narrow set of occupations, which included teaching. As women have been able to diversify their career paths, they have also had greater opportunities to compete for higher-paying jobs than teaching. Today, the gap between women teachers’ pay compared with other similarly qualified college educated workers is at its all-time high. Women teaching public K–12 education earn 21.4% less than women with comparable education and demographic characteristics (Allegretto 2024). This “pay penalty”—which has accelerated sharply over the last 25 years—makes teaching a less desirable job, as evidenced by surveys of teacher satisfaction. According to the Survey of the American Teacher, the share of teachers that were very satisfied with their careers was at an all-time high 2008 at 62%, but has subsequently declined by at least 20 percentage points throughout the 2010s and is currently at some of the lowest levels recorded over the last half-century (Kraft and Lyon 2024).
This historical analysis provides insight into how policymakers should determine levels of public support for education. The growth in school-age population has slowed considerably in recent years, a trend likely to continue going forward. Fewer students will somewhat reduce the need for educational investments, but this won’t offset the need to attract quality teachers. Meeting these two needs—to keep up with productivity growth generally and to keep up with a labor market producing more equitable outcomes by gender—is clearly positive for society at large and should lead to more resources being available for public education. But this also means that higher spending levels will be needed just to maintain the current education quality; if policymakers fail to recognize and act on this, the quality of public education will inevitably decline.
How to know if we’re spending enough on public education
The previous section noted that trends in public school spending need to be scaled against economically relevant benchmarks to assess whether the quality of educational services being provided to students over time is rising or falling. We find that when they are properly scaled, quality-adjusted educational investments have been falling in recent decades.
But examining trends over time does not tell us what level of spending is enough for U.S. public K–12 education. Because public education is not provided in markets and because there are so many positive spillover effects associated with education spending, it is inaccurate to assume that the current supply of public educational services in the United States reflects the broad social need for these services. Public investments in education are the outcome of politics and policymaking, and steep shortfalls in these investments from socially optimal levels can persist indefinitely.
Useful benchmarks for assessing whether the U.S. is spending enough on public education include:
- Historical trends: Has the public educational investment “effort”—i.e., the share of the economy’s resources that society is willing to dedicate to public education—kept pace with economic growth in a way that would at least hold educational input quality constant?
- International comparisons: Does the United States expend as much public investment effort as our advanced country peers, and what do recent trends in this effort look like?
- Adequacy measures: Does the United States spend enough to ensure that every school district in the United States can achieve average scores on achievement tests that meet common targets for educational adequacy?
- The social return to additional spending: Do additional increments of educational investment lead to measurably higher social benefits?
Most of these benchmarks indicate that more spending would deliver large social benefits. Before delving deeper into each of these questions, it is important to highlight a clear sign that public spending on education may be insufficient: the well-established fact that teachers routinely dip into their own pockets to supplement school supplies for their students. Figure D shows the average amount that teachers spend out of their pay to supplement school supplies by state for the 2020–2021 school year. Teachers in South Dakota spend the least of their own money on school supplies that school year ($315), while teachers in Nevada and Alaska spend the most ($587 and $691, respectively).
Teachers across the U.S. spend their own money to support students: Average amount of their own money that public and private school teachers spent on classroom supplies without reimbursement, 2020–2021
| State | Average amount spent |
|---|---|
| Alabama | $487 |
| Alaska | $691 |
| Arizona | $428 |
| Arkansas | $348 |
| California | $599 |
| Colorado | $384 |
| Connecticut | $460 |
| Delaware | $495 |
| Washington D.C. | $581 |
| Florida | $465 |
| Georgia | $459 |
| Hawaii | $491 |
| Idaho | $389 |
| Illinois | $384 |
| Indiana | $410 |
| Iowa | $367 |
| Kansas | $390 |
| Kentucky | $387 |
| Louisiana | $473 |
| Maine | $340 |
| Maryland | $485 |
| Massachusetts | $433 |
| Michigan | $482 |
| Minnesota | $375 |
| Mississippi | $378 |
| Missouri | $366 |
| Montana | $426 |
| Nebraska | $346 |
| Nevada | $587 |
| New Hampshire | $368 |
| New Jersey | $424 |
| New Mexico | $494 |
| New York | $463 |
| North Carolina | $431 |
| North Dakota | $392 |
| Ohio | $424 |
| Oklahoma | $498 |
| Oregon | $430 |
| Pennsylvania | $401 |
| Rhode Island | $529 |
| South Carolina | $379 |
| South Dakota | $315 |
| Tennessee | $398 |
| Texas | $485 |
| Utah | $369 |
| Vermont | $323 |
| Virginia | $374 |
| Washington | $453 |
| West Virginia | $396 |
| Wisconsin | $322 |
| Wyoming | $502 |
Note: Average amount spent includes zeroes for teachers who did not spend any money of their own.
Source: EPI analysis of National Center for Education Statistics, National Teacher and Principal Survey data.
Historical trends in public investment effort in education
As noted above, the stability of public education spending as a share of GDP does not guarantee a constant quality of education over time (unless enrollment is shrinking). As productivity rises in sectors of the economy that are more amenable to automation and other labor-saving processes but largely remains constant in sectors that require intensive face-to-face contact (like education), maintaining the same amount and quality of inputs into public education will require spending to be a rising share of GDP.
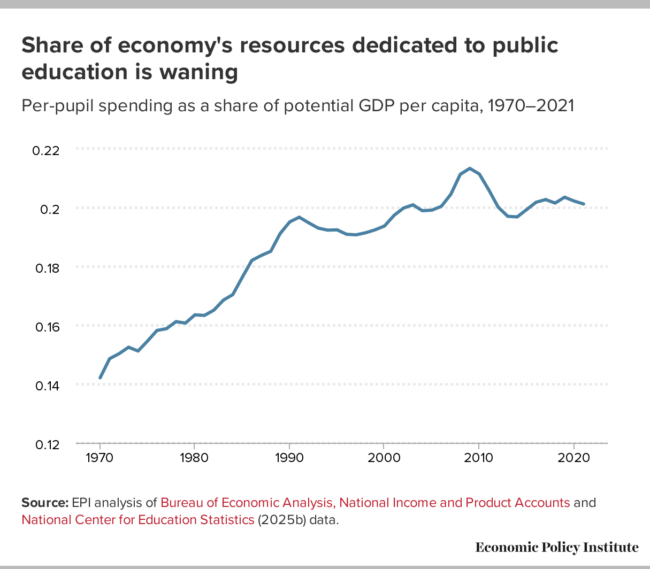
How rapidly public education should be rising as a share of GDP depends on the growth of the share of school-age children (ages 5–18), but also depends on productivity growth in the rest of the economy. If this growth is fast in historic terms, then public education’s share of overall GDP should rise rapidly just to keep pace in terms of the amount and quality of inputs needed to retain or attract away from other sectors. If this productivity growth is slow in historic terms, then public education’s share of overall GDP can rise more slowly and yet remain constant in effective terms. One rough proxy that accounts for both enrollment and productivity growth is per-pupil public spending on K–12 education divided by per capita GDP. To keep recessions (which reduce GDP) from pulling this measure around in uninformative ways we use a measure of potential GDP from the Congressional Budget Office (CBO), which estimates how much GDP could be produced in the country if unemployment was maintained at low levels. If this measure of per-pupil spending as a share of per capita GDP is falling, then society’s educational investment effort can be said to be lagging. Figure E highlights the recent history of this measure of spending.
Share of economy's resources dedicated to public education is waning: Per-pupil spending as a share of potential GDP per capita, 1970–2021
| Year | Per-pupil spending, share |
|---|---|
| 1970 | 0.1421 |
| 1971 | 0.1486 |
| 1972 | 0.1503 |
| 1973 | 0.1525 |
| 1974 | 0.1512 |
| 1975 | 0.1546 |
| 1976 | 0.1582 |
| 1977 | 0.1588 |
| 1978 | 0.1612 |
| 1979 | 0.1607 |
| 1980 | 0.1635 |
| 1981 | 0.1633 |
| 1982 | 0.1651 |
| 1983 | 0.1685 |
| 1984 | 0.1704 |
| 1985 | 0.1763 |
| 1986 | 0.1820 |
| 1987 | 0.1837 |
| 1988 | 0.1851 |
| 1989 | 0.1912 |
| 1990 | 0.1951 |
| 1991 | 0.1967 |
| 1992 | 0.1948 |
| 1993 | 0.1930 |
| 1994 | 0.1923 |
| 1995 | 0.1924 |
| 1996 | 0.1909 |
| 1997 | 0.1907 |
| 1998 | 0.1914 |
| 1999 | 0.1924 |
| 2000 | 0.1937 |
| 2001 | 0.1973 |
| 2002 | 0.1998 |
| 2003 | 0.2009 |
| 2004 | 0.1989 |
| 2005 | 0.1991 |
| 2006 | 0.2004 |
| 2007 | 0.2045 |
| 2008 | 0.2113 |
| 2009 | 0.2133 |
| 2010 | 0.2114 |
| 2011 | 0.2060 |
| 2012 | 0.2001 |
| 2013 | 0.1970 |
| 2014 | 0.1968 |
| 2015 | 0.1993 |
| 2016 | 0.2018 |
| 2017 | 0.2027 |
| 2018 | 0.2015 |
| 2019 | 0.2035 |
| 2020 | 0.2022 |
| 2021 | 0.2012 |
Source: EPI analysis of Bureau of Economic Analysis, National Income and Product Accounts and National Center for Education Statistics (2025b) data.
This measure of educational investment effort rose throughout the 1970s and 1980s, reflecting a continuous investment in public education. However, spending on K–12 education as a share of per capita GDP slowed in the 1990s and outright stalled after the Great Recession in 2008, reflecting a lagging public education investment effort.
International comparisons
Another benchmark for assessing whether the U.S. invests enough in public education is how we compare with our international peers. A well-educated workforce is a key driver of economic growth and competitiveness. If the United States is failing to match a high standard compared with international peers, this could make U.S. relative economic performance suffer.
Figure F provides a simple ranking of countries based on average public per-pupil spending on K–12 education, expressed as a share of per capita GDP in each country in 2019. This is in line with our measure above on educational investment effort. The United States does not rank highly, with 22 countries surpassing its investment effort for public education.
22 countries invest more in public education than the U.S.: Change in expenditure on educational institutions per full-time equivalent student as a share of GDP per capita, 2009–2019
| Country | Share |
|---|---|
| Korea | %32 |
| Norway | 27 |
| Austria | 25 |
| Portugal | 25 |
| Iceland | 25 |
| Sweden | 24 |
| Belgium | 24 |
| Switzerland | 24 |
| Japan | 23 |
| Poland | 23 |
| Estonia | 23 |
| Finland | 22 |
| Czechia | 22 |
| Italy | 22 |
| United Kingdom | 22 |
| France | 22 |
| Slovak Republic | 22 |
| Slovenia | 22 |
| Denmark | 22 |
| Latvia | 22 |
| Canada | 22 |
| Greece | 21 |
| United States | 21 |
| Germany | 21 |
| Israel | 21 |
| Spain | 20 |
| Hungary | 20 |
| Australia | 20 |
| Chile | 19 |
| Luxembourg | 19 |
| Netherlands | 19 |
| Lithuania | 18 |
| New Zealand | 16 |
| Türkiye | 13 |
| Mexico | 11 |
| Ireland | 10 |
Note: K–12 education is globally defined as primary to post-secondary non-tertiary education.
Source: EPI analysis of Organisation for Economic Co-operation and Development data.
Figure G shows the change in this per-pupil spending since 2010 for the 29 countries with data in each year. Again, the United States ranks in the bottom third of countries on this metric, with an outright decline in educational investment effort. The U.S. is therefore not only spending less on this measure than most other advanced economies, but it is also reducing this spending while dozens of our advanced country peers are increasing it.
U.S. rank in education spending has declined over time: Change in education spending, 2009–2019
| Country | Difference |
|---|---|
| Slovak Republic | 4.57 |
| Chile | 3.69 |
| Israel | 3.55 |
| Czechia | 3.48 |
| United Kingdom | 2.33 |
| Iceland | 2.17 |
| Finland | 0.36 |
| Sweden | -0.05 |
| Australia | -0.25 |
| Netherlands | -0.25 |
| Hungary | -0.58 |
| Portugal | -0.60 |
| Norway | -0.90 |
| Belgium | -0.91 |
| New Zealand | -0.93 |
| Mexico | -1.41 |
| France | -1.47 |
| Poland | -1.66 |
| United States | -1.88 |
| Italy | -2.83 |
| Spain | -4.88 |
| Denmark | -5.63 |
| Lithuania | -6.07 |
| Slovenia | -6.48 |
| Latvia | -6.64 |
| Estonia | -7.28 |
Note: K–12 education is globally defined as primary to post-secondary non-tertiary education.
Source: EPI analysis of Organisation for Economic Co-operation and Development data.
Estimated returns to new increments of public education spending
In the 1990s and early 2000s, the conventional wisdom in many education policy discussions was that the U.S. government was spending “enough” on K–12 education, and that marginal additions to spending per pupil would likely not generate improved student outcomes (Hanushek 2006). This conclusion led policies and initiatives to focus on changing how educational resources were deployed rather than increasing the average level of public resources.
Some of these initiatives statistically monitored teacher performance to remove teachers deemed ineffective. Others focused on increasing the share of students educated in charter schools or private schools—including through the expansion of voucher programs which diverted public funds to pay for private-school tuition. But the outcomes of such initiatives have been largely ineffective or show little sign that they could be widely scaled as improvements for public education.
More recent research overturns this older conventional wisdom and highlights just how damaging a detour these initiatives may have been, demonstrating that in fact incremental increases in education spending translate directly and reliably into significant gains in student outcomes and provide a much more reliable lever with which to improve educational quality in the United States.
Crucially, this wave of new research has overcome the statistical challenge of trying to isolate the causal effect of higher spending levels of educational and social outcomes. Public education spending is not random and depends on a number of factors that are correlated with student success. For example, spending in a given district might rise as higher-income families move into the area and property values (and taxes) increase. These higher-income families might also be able to provide greater in-home resources that will aid their children’s academic performance. Simple correlations between the level of district spending and student success might hence show a positive relationship, but the causality would not necessarily be running from district spending decisions to student success; both might instead be driven by a third variable, which is simply the level of family resources on average across the district.
Running the opposite direction, much of school funding is explicitly compensatory, targeting students facing greater socioeconomic disadvantage to attempt to even out total resources (both in home and public) available to students for academic success. But if this greater spending targets students with fewer in-home resources, it could show a negative relationship between levels of spending and student performance, and again would not be reflecting the causal effect of this spending.
Newer research has found natural experiments that allow truly exogenous changes in school spending to be identified, and hence the effects on student achievement to reflect the causal effect of this spending.
This research can be divided into three strands:
- Pre-COVID-19 research focused on court-ordered school finance reforms (SFRs) as the natural experiment;
- Pre-COVID-19 research on other sources of exogenous variation in school spending as natural experiments; and
- Post-COVID-19 research on the large increase in federal fiscal aid to state and local governments earmarked for education as the policy experiment.
Pre-COVID-19 research on court-order school finance reforms
Jackson, Johnson, and Persico (2015) used longitudinal data to trace the educational trajectories and adult earnings outcomes for a nationally representative set of students who were exposed to court orders mandating changes to a state’s school finance system. These court-ordered reforms imposed discrete and significant changes in a state’s school finance system that differentially affected students in different districts within a state and/or who were born in different years—allowing researchers to isolate any variation coming only from changes in spending. The authors found that a 10% increase in school spending for 12 years led to 7.7% higher wages and a 9.8% increase in family income in adulthood. Large positive effects were also found for high school graduation, completed years of education, and a reduced incidence of poverty in adulthood.
Other studies have used the school finance reforms as part of their quasi-experimental design to understand the relationship between educational funding and student outcomes. Candelaria and Shores (2019) studied more recent reforms and found positive effects on high school graduation rates. Rothstein and Schanzenbach (2022) studied the recent wave of adequacy reforms and found a 2.0 percentage point increase in high school graduation and a 1.4 percentage point increase in college enrollment. Similarly, Hyman (2017) concluded that students exposed to 10% more funding were 3.0 percentage points more likely to enroll in college and 2.3 percentage points more likely to graduate from college. Lafortune, Rothstein, and Schanzenbach (2018) studied the recent wave of adequacy reforms and found an increase in test scores for students in low-income districts which closed the gap between low- and high-income districts by one-fifth over the 10 years following the reforms. Biasi (2019) studied the effects of these reforms on intergenerational mobility and found that reducing the gap in funding between low- and high-income districts disproportionately increased the income of children with parental income in the 10th and 25th percentile later in life as adults. The new evidence therefore shows how much public schooling can deliver for students when schools are adequately resourced.
Other pre-COVID-19 natural experiments
Court-ordered school finance reforms are not the only source of exogenous variation in spending that can be used to assess the causal effect of more resources for public education. Jackson and Mackevicius’ (2024) literature review of 32 papers highlighted research that uses discontinuities in state funding formulas or changes in local elections to assess the effect of higher spending levels. Their overall finding is that higher levels of school spending cause higher levels of student achievement, measured either by test results or the probability of attending college. Their baseline estimates are that each $1,000 in additional per-pupil spending raises achievement scores by roughly 3.2% of a standard deviation, and raises the probability of college attendance by nearly 3 percentage points—implying that the benefits outweighed the costs of this higher level of spending.
Other papers also use the introduction of new capital investments to assess the value of higher educational spending. Cellini, Ferreira, and Rothstein (2010) look at referenda on bond initiatives to finance new education investment that either passed or failed by narrow margins. Districts where bond referenda narrowly passed and new investments came online should differ from districts where such measures narrowly failed only by the impact of this new investment. They find that treated districts—those that saw a narrow passage of a bond referendum to finance new education investments—saw identifiable increases in student test scores after just a few years. Most impressively, treated districts saw immediate and large increases in home prices. This strongly indicates that the public highly values well-funded schools, and that no market exists to let them easily “buy” these well-funded schools directly—after all, it took a political intervention (the passage of a bond issue through public referenda) in order for these homeowners to secure the gain in value spurred by higher school investments. Specifically, Cellini, Ferreira, and Rothstein (2010) found that every $1 in increased educational investment made possible by narrowly passed bond referenda results in an increase of home prices in the district of more than $1.50. If educational investments were set in an efficient market, one would expect these investments to rise until the return to them (in the form of higher home prices) was just $1. This sizable gap in the cost versus returns to educational investment signals clearly that the public would value higher educational investments.
Lafortune and Schönholzer (2022) took a similar approach to Cellini, Ferreira, and Rothstein (2010) in examining a large increase in educational facility investments in the Los Angeles Unified School District (LAUSD) between 1997 and 2008. Over this period, voters in LA approved nearly $20 billion in state and local bond issues to finance increased educational expenditures. This large investment effort proceeded in numerous phases. Lafortune and Schönholzer (2022) used the staggered rollout of new facility investments to essentially see which students in the LAUSD were treated with new investments. They then measured the causal effect of these new investments on student achievement and surrounding home prices. They found significantly positive effects on test scores, attendance, and home prices. Like Cellini, Ferreira, and Rothstein (2010) they found that each $1 in new spending resulted in $1.62 in increased household value, mostly through upward pressure on home prices as demand for homes in districts receiving greater investment increased. Again, these findings strongly suggest that relative to efficient market outcomes, there is an underinvestment in public education relative to the public’s underlying demand.
Biasi, Lafortune, and Schönholzer (2025) also used the bond referenda approach described above. They find that bond authorization raises test scores and is most beneficial in districts with more disadvantaged student populations. This disproportionate effect arises for two reasons. First, these districts prioritize bonds to finance spending that directly improve student learning instead of simply improving school amenities (like an athletic field or school theatre). Second, underinvestment in these districts in the past have led to investment deficits, leading to disproportionate gains when these deficits are addressed.
Assessing the effectiveness of COVID-19 fiscal relief for education
During 2020 and 2021, three separate legislative aid packages provided fiscal aid to state and local governments with funds earmarked for education. This dedicated education aid was spurred by policymakers seeking to blunt the effect of the COVID-19 pandemic on students’ education. Most of the aid was given directly to local school districts without state or federal oversight and was not tied directly to district-level education disruptions caused by the pandemic. The fact that aid was not targeted by pre-existing situations in local school districts means that it can be treated as a purely exogenous change in spending and hence its effect on subsequent educational performance can be interpreted as causal.
The Education Recovery Scorecard (ERS) project (a joint research effort of Harvard and Stanford) assessed the contribution of federal educational aid to subsequent outcomes (see Dewey et al. 2025). Essentially, the ERS approach measures the relationship between federal pandemic relief spending per student and the change in average student achievement between 2022 and 2023, while controlling for several district-level characteristics that might affect achievement (like measures of community poverty).
The overall ERS finding is almost exactly in line with the effect of extra money estimated before the COVID-19 pandemic: Each $1,000 increase in per-pupil spending increased student achievement by just under 1% of a standard deviation. The effect was more pronounced for math than for reading scores. When they restricted their assessment to high-poverty districts, the per-dollar effect was nearly double. They concluded that their results “imply that the federal pandemic relief contributed to academic recovery during the 2022–2023 school year, and that the impacts were in line with what would have been expected from prior research.” What makes this especially informative, however, is that the federal aid pushed per-pupil expenditures significantly above pre-pandemic levels, and even this significant increase saw no decline in the marginal boost it provided to student achievement. This discredits any argument that we have saturated public education spending and are nearing the point where more money would stop yielding social returns.
Where net new spending on public education could do the most good
The burgeoning literature we highlighted shows that higher levels of public spending on K–12 education could generate large social benefits—benefits that are reflected directly in higher measurable student outcomes. Moreover, when schools get more investment, home prices increase, reflecting the families’ underlying demand for investment in public education. These higher home prices reflect buyers’ valuation of being in districts with well-funded public schools and show just how much they’ll pay in order to be near one. This new literature argues for paying more policy attention to the level of public resources for education, not just how these resources are deployed. But this research can also inform where new additions to public resources for K–12 education could do the most good.
The literature cited in the previous section generally found that the overall improvements in student outcomes spurred by higher levels of spending are driven disproportionately by students raised in low-income households (Jackson and Mackevicius 2024). Lafortune, Rothstein, and Schanzenbach (2018) studied the recent wave of adequacy reforms and found that the test score gap between low- and high-income school districts within a state fell by roughly 10% of a standard deviation 10 years after the reforms. Biasi (2019) studied the effects of these reforms on intergenerational mobility and found that a $4,500 reduction in the funding gap between the richest and poorest districts in a state—slightly larger than the average funding gap in 1990 ($4,012)—improved upward mobility: Students exposed to these changes born in the bottom 10% of parental income had a 5.6 percentile higher rank in adult income, which corresponds to an increase in adult earnings of 16.2%.
Another strand of research directly estimates the additional resources that would be needed to ensure that every public school student in the United States received an adequate education (Baker, Di Carlo, and Weber 2024)—defined as the level of funding needed in a district to ensure students reach an average level of student achievement.
This “adequacy gap” between what schools need to hit these metrics versus what they’re currently receiving in public resources is larger for districts where neighborhood poverty is higher. This is for two reasons. First, per-pupil spending is often lower in low-income districts. Second, students in low-income districts need more funding per pupil to compensate for the much lower level of out-of-school resources available to them. Higher-income parents can spend more on educational enrichment activities, can often spend more time helping children with schoolwork, and often have higher educational credentials themselves, placing them in a better position to guide children academically.
To understand how these differences in overall per-pupil spending affect different components of educational spending, Table 1 shows overall per-pupil spending by district income and spending for detailed expenditure categories. The table shows that schools in high-income districts spend nearly $2,000 much more on educational spending per pupil, compared with low-income districts. Children in poorer neighborhoods end up going to schools that are less resourced than those in well-off neighborhoods, leaving teachers and instructional staff the herculean task of providing similar education with fewer resources.
Total expenditures for low- and high-poverty districts, 2021
| Low-poverty districts | High-poverty districts | |
|---|---|---|
| Total expenditures | $20,872 | $18,777 |
| Instruction | $11,039 | $9,678 |
| Salaries- Total instruction | $6,899 | $5,983 |
| Salaries- Regular instruction | $4,765 | $3,881 |
| Salaries- Special education | $920 | $670 |
| Benefits- Total instruction | $3,217 | $2,560 |
| Student services | $6,521 | $6,088 |
| Transportation | $750 | $675 |
| Pupil services | $1,115 | $874 |
| Operations and maintenance | $1,716 | $1,691 |
| Other services | $2,940 | $2,848 |
| Other elementary & secondary services | $539 | $723 |
| Food | $510 | $703 |
| Capital outlays | $2,276 | $1,935 |
| Interest payments | $497 | $352 |
Note: Expenditures are in real 2024 dollars.
Source: EPI analysis of data from the National Center for for Education Statistics, Common Core of Data.
The disparities in funding for teachers’ salaries and benefits highlight a particular struggle that low-income districts face in recruitment and retention. High-income districts spend $6,899 per pupil on salaries for teachers and support staff personnel, while low-income districts only spend $5,983. This trend is true for regular instruction, but also for special education instruction, with high-income districts outspending low-income districts by nearly 46% ($920 per pupil compared with $670). This trend can be particularly damaging because schools in high-poverty districts are likely to have a greater share of the student body with special education needs.
Student services refer to all the services schools provide beyond instruction, including transportation, pupil and instructional services, operations and maintenance, and business/central operations. High-income districts spend about $1,115 per pupil while low-income districts spend only $874 per pupil.
Again, this gap can be particularly damaging because students in low-income districts likely require more resources for pupil and student services beyond instructional time to compensate for the gap in out-of-school resources available to them relative to higher-income students.
One area where the funding allocation is actually higher in low-income districts than in high-income districts is food services. More students in low-income communities rely on free and reduced-cost lunch programs financed with public dollars, while food service is functionally privatized for moderate- and higher-income students. Finally, more is spent on adult education in low-income districts, because community members there are more likely to rely on public education for compensatory education (not shown Table 1).
Estimating what is actually required for universal adequacy
To assess the adequacy of school spending in high- and low- income districts, Figure H uses data from the School Finance Database to show the actual per-pupil spending in 2019 for low- and high-income districts, as well as the money that is required in those districts to provide an adequate education. We use spending in an earlier year (2019) to avoid any temporary spending from the COVID-19 Elementary and Secondary Spending programs that buoyed state spending in 2021 and better represent a baseline level of school funding available to most students.
Baker, Di Carlo, and Weber (2024) provide estimates on what level of spending is required for an adequate education, using a cost model to calculate adequate funding levels for most of the nation’s public-school districts. The cost model incorporates factors that affect students’ needs in a given district, such as Census child poverty rate, its labor costs, student characteristics, and teacher labor markets. These factors help illustrate the resources available outside the school that affect student learning outcomes. For example, students in high-poverty district will have fewer resources at home and thus require more resources in their school to achieve a given outcome goal, like a score on a standardized test, relative to students in more affluent areas. Similarly, teacher labor markets, a key education cost, vary across districts and thus have implications for student achievement. The model then provides, for each district, the cost amount of spending required to achieve an adequate education, which they determine to be national average math and reading scores in grades three to eight.
Some districts already spend more (some substantially more) than the adequate threshold of education spending, while others spend substantially less. This should not be a shock; there are hundreds if not thousands of well-resourced school districts in the United States providing a level of educational quality that would rival anywhere else in the world. The problem is that this is not the norm. Figure H shows that while low-poverty districts spend more than is necessarily required to meet educational standard, high-poverty districts are not spending enough to meet basic adequacy thresholds. In 2019, high-poverty districts underspent by $4,000 per student, while low-poverty districts overspent by $5,700 per student.
Spending is inadequate in high-poverty school districts: Per-pupil spending compared with estimated spending required to achieve national average test scores, by poverty quintile of school district, 2019
| Required spending | Actual spending | |
|---|---|---|
| Highest-poverty (poorest) | $20,133 | $12,722 |
| High-poverty | $13,540 | $12,927 |
| Medium-poverty | $11,670 | $13,379 |
| Low-poverty | $9,946 | $13,719 |
| Lowest-poverty (affluent) | $8,357 | $16,054 |
Note: The figure shows how much is spent in each of the five types of districts and how much they would need to spend for students to achieve national average test scores.
Source: Adapted from Baker, Di Carlo, and Weber (2024).
Challenges to financing our schools fairly and adequately
This section highlights two among the many policy challenges to providing enough funding to guarantee an adequate public education for all U.S. children. First, there is the long-running structural challenge of so much public-school finance depending on local property taxes. The second challenge is a political one that stems from the fact that Republican-dominated state governments almost universally fail to provide enough public investment in K–12 education, with this problem becoming nationally acute in the 2010s as the number of Republican trifectas (control of both governorship and state legislatures) grew.
Local property taxes and disparities in public education funding
Educational funding is skewed toward high-income districts in part because public education in the U.S. relies heavily on revenue from local property tax revenues. Districts with higher-priced homes will be able to raise more revenue for a given tax rate, giving them a funding advantage over others. In 2019, for example, 46% of per-pupil education funding came from local revenue (overwhelmingly property taxes), 44% came from state revenue sources, and the remainder came from the federal government. This funding model in which local revenue is so important inevitably generates inequalities between districts.
Figure I shows the trends in average amount of per-pupil revenue spending, by type of government revenue, for high- and low- poverty districts over time. In 1995, local per-pupil revenue for high-poverty districts was $4,450 and $7,820 for low-poverty districts—a gap of $3,370. Yet by 2021, $12,110 of per-pupil revenue came in from local government in low-poverty districts while only $7,444 per pupil revenue was from local government in high-poverty districts—a gap of over $4,500 per pupil. The overall funding gap is closed a bit by revenue from federal and state sources in high-poverty districts exceeding that of low-poverty districts, but these state and federal resources are not nearly large enough to offset the inequality created by property tax financed local revenue.
Low-poverty districts have far more revenue from local sources than high-poverty districts: Total district revenue by source and district poverty status, 1995–2021
| Low poverty, federal | Low poverty, state | Low poverty, local | High poverty, federal | High poverty, state | High poverty, local | |
|---|---|---|---|---|---|---|
| 1995 | $407 | $5,105 | $7,820 | $965 | $6,233 | $4,450 |
| 1996 | $407 | $5,267 | $7,711 | $944 | $6,421 | $4,433 |
| 1997 | $404 | $5,444 | $7,762 | $973 | $6,658 | $4,490 |
| 1998 | $440 | $5,611 | $7,952 | $1,055 | $6,948 | $4,607 |
| 1999 | $482 | $6,091 | $7,943 | $1,123 | $7,256 | $4,643 |
| 2000 | $518 | $6,430 | $7,889 | $1,189 | $7,519 | $4,684 |
| 2001 | $535 | $6,764 | $8,287 | $1,268 | $7,940 | $4,892 |
| 2002 | $611 | $6,932 | $8,517 | $1,463 | $8,056 | $5,027 |
| 2003 | $693 | $7,050 | $8,600 | $1,637 | $8,075 | $5,116 |
| 2004 | $737 | $6,926 | $9,005 | $1,752 | $7,991 | $5,299 |
| 2005 | $752 | $7,140 | $9,262 | $1,807 | $8,123 | $5,441 |
| 2006 | $760 | $7,207 | $9,544 | $1,840 | $8,284 | $5,801 |
| 2007 | $738 | $7,503 | $9,844 | $1,738 | $8,747 | $6,027 |
| 2008 | $725 | $7,598 | $9,929 | $1,684 | $9,065 | $5,974 |
| 2009 | $992 | $7,644 | $10,246 | $1,961 | $9,052 | $6,217 |
| 2010 | $1,390 | $7,272 | $10,211 | $2,583 | $8,367 | $6,140 |
| 2011 | $1,207 | $7,224 | $10,189 | $2,400 | $8,331 | $6,148 |
| 2012 | $934 | $7,301 | $10,335 | $1,943 | $8,344 | $6,220 |
| 2013 | $831 | $7,284 | $10,452 | $1,780 | $8,232 | $6,437 |
| 2014 | $807 | $7,654 | $10,620 | $1,700 | $8,534 | $6,574 |
| 2015 | $827 | $7,991 | $10,994 | $1,743 | $8,835 | $6,806 |
| 2016 | $831 | $8,204 | $11,252 | $1,738 | $9,100 | $6,823 |
| 2017 | $834 | $8,421 | $11,433 | $1,740 | $9,268 | $6,800 |
| 2018 | $844 | $8,459 | $11,704 | $1,763 | $9,413 | $7,034 |
| 2019 | $872 | $8,660 | $11,916 | $1,869 | $9,793 | $7,364 |
| 2020 | $903 | $8,768 | $12,090 | $1,920 | $10,124 | $7,554 |
| 2021 | $1,517 | $8,818 | $12,110 | $2,761 | $10,071 | $7,444 |
Note: Poverty status is determined by a district’s poverty status in 2000. Revenue estimates are in real 2024 dollars.
Source: EPI analysis of National Center for Education Statistics, Common Core of Data and U.S. Census Bureau, Small Area Income and Poverty Estimates data.
Republican-dominated states invest the least in public education
Between 2007 and the onset of the COVID-19 pandemic, there was extreme pressure on all sources of educational funding. The large decline in home prices in the years after 2007 led local property tax revenue to decline significantly. The American Recovery and Reinvestment Act (ARRA) of 2009 provided significant federal fiscal aid to state governments until the end of 2010. While this aid was not specifically dedicated to education, it was largely fungible and should have allowed states that wished to maintain resources to education help offset the property tax declines.
ARRA aid to states, however, ran out by the end of 2010. Further, the 2010 election cycle saw a large increase in the share of state governments dominated by Republican trifectas. These Republican trifectas passed extremely austere state budgets, with large cuts to education. This move toward austerity was mirrored at the federal level, with Republican control of Congress after 2010 leading to the Budget Control Act, which forced steep cuts across many areas of spending. These various funding pressures become extremely visible in the data starting in 2011.
Figure J shows overall per-pupil spending from 1995–2021, categorized by whether states did or did not have a Republican trifecta in 2011. States with a Republican trifecta in 2011 (Arizona, Florida, Georgia, Indiana, Idaho, Kansas, Louisiana, Maine, Mississippi, North Dakota, Ohio, Oklahoma, Pennsylvania, South Carolina, South Dakota, Tennessee, Texas, Utah, Wisconsin, and Wyoming) spent less than states without a Republican trifecta both before and after 2011, but the trend of spending between the two groups was identical leading up to the Great Recession. Between 1995 and 2008, the average gap in per-pupil spending was 13% (and was essentially the same in each year). In the aftermath of the Great Recession, and particularly following the election cycles of 2010, many states significantly reduced education budgets, but this move was much more pronounced in Republican trifectas: The gap in spending grew to an average of 18% between 2011 and 2021.
States with no Republican trifecta in 2011 outspend states with Republican trifecta on education: Total per-pupil expenditures on education, grouped by whether the state had a Republican trifecta in 2011
| Year | No republican trifecta | Republican trifecta |
|---|---|---|
| 1995 | 11,025 | 9,749 |
| 1996 | 11,180 | 9,794 |
| 1997 | 11,421 | 9,981 |
| 1998 | 11,713 | 10,341 |
| 1999 | 12,059 | 10,704 |
| 2000 | 12,397 | 10,942 |
| 2001 | 12,967 | 11,494 |
| 2002 | 13,413 | 12,043 |
| 2003 | 13,760 | 12,351 |
| 2004 | 14,036 | 12,510 |
| 2005 | 14,446 | 12,796 |
| 2006 | 14,861 | 13,117 |
| 2007 | 15,400 | 13,490 |
| 2008 | 15,718 | 13,672 |
| 2009 | 16,149 | 14,150 |
| 2010 | 16,089 | 14,217 |
| 2011 | 15,853 | 14,027 |
| 2012 | 15,853 | 13,649 |
| 2013 | 15,842 | 13,498 |
| 2014 | 16,206 | 13,714 |
| 2015 | 16,585 | 14,097 |
| 2016 | 16,765 | 14,190 |
| 2017 | 16,947 | 14,405 |
| 2018 | 17,186 | 14,538 |
| 2019 | 17,698 | 14,751 |
| 2020 | 17,968 | 15,032 |
| 2021 | 18,445 | 15,448 |
Note: A Republican trifecta exists when a state’s governor and state houses are all Republican controlled. Expenditures are in real 2024 dollars. Expenditures shown are total current expenditures on elementary and secondary education, excluding capital outlays and interest on debt.
Source: EPI analysis of data from the National Center for Education Statistics, Common Core of Data.
While Figure J illustrates simple averages in per-pupil spending for states with and without Republican trifectas in 2011, the two groups of states may differ in factors like the business cycle, or state- or year-specific factors that might also play a role in educational funding. For instance, all else being equal, education funding is likely to face downward pressure in periods when there is high unemployment.
Using a regression model to account for variation in state-specific unemployment rates can help account for this influence on education spending. Table 2 shows results from standard regression models that estimate per-pupil spending in states with a Republican governance trifecta relative to other states between 2011 and 2021. The table shows the difference in per-pupil spending between states that have and do not have a Republican trifecta, while removing the influence of state-specific unemployment rates. On average, states with a Republican trifecta spend $141 less per pupil than states without a Republican trifecta, controlling for the factors discussed above. For districts in high-poverty neighborhoods, being in a state with a Republican trifecta is associated with $244 less in per-pupil spending, while for districts in low-poverty neighborhoods, Republican trifectas are actually associated with an increase in student spending of $32 (although the estimate is not statistically significant).
Relationship between a state having a Republican trifecta and current spending on elementary and secondary education
| Association with elementary and secondary education spending | |||
|---|---|---|---|
| State has Republican trifecta | All states | Low-poverty states | High-poverty states |
| -141.3*** | 32.00 | -244.3*** | |
| (49.00) | (60.50) | (76.53) | |
Note: Regression controls for state and year fixed effects and annual unemployment rate.
Recent threats to public education
More recently, Republican-led states have introduced voucher and tax credit programs that put even further fiscal pressure on resources available to public school students. Vouchers programs, which funnel public dollars to private schools, have been growing in recent years. While these programs have been around for decades—following the Brown v. Board of Education ruling in 1954, several Southern states used vouchers as a tool to undermine school integration efforts (Ford, Johnson, and Partelow 2017)—more recently, states have enacted voucher programs to attract a wider pool of students (called “universal voucher programs”) allowing any student to use public funds to pay for private education. In 2000, the number of students using vouchers stood at just 11,000, but today the number of students enrolled in voucher programs is over 600,000.
The beneficial effect of vouchers on student outcomes is weak both in theory (Wething and Bivens 2024) and in evidence. In Louisiana, Ohio, and Indiana, test scores for students in voucher programs declined following program enactment (Mills and Wolf 2017; Figlio and Karbownik 2016; Waddington and Berends 2018). Moreover, in places with mature voucher programs like Milwaukee, Wisconsin, nearly 40% of the private schools that took vouchers failed or closed within the program’s first 25 years, displacing students and creating uncertainty for students in need of a quality education and parents looking to send their kids to school. Studies show that students that experience a school closure are more likely to do worse on tests, attend school less, and drop out, relative to students who don’t experience school closure (Kim 2024). For private schools to have such a high closure rate suggests that the schooling alternative to public schools was tenuous and often not well-funded in the first place, and will likely harm students’ education prospects.
Voucher programs directly threaten public-school funding in two main ways. First, they increase the cost to the state for students to attend private schools. If students had never intended to attend public school, these vouchers just pile on new fiscal obligations to the state. Any new fiscal obligation will obviously threaten to put downward pressure on education spending (one of the bigger parts of any state and local government’s budget). This pressure has been shown to be significant. In Arizona, only $33 million was allocated to for the first year of universal eligibility for their Empowerment Scholarship Account voucher program in 2022–2023,1 but it ended up costing $587 million in the first year and upwards of $708 million in fiscal year 2024 (Griffith and Burns 2024).
Second, vouchers also impose under-recognized indirect costs for students left in the traditional public-school system, as schools try to maintain the same level of education amid declining enrollment. This is because public schools—like nearly every other economic entity in the modern economy—require a mix of inputs, some of which are variable and some of which are fixed. Regardless of whether schools lose students due to voucher programs, some costs will have to be paid the same amount (e.g. electricity, heat, building maintenance, payments on debt, capital improvements). Costs that can change with enrollment take on a lion’s share of the downward adjustment when enrollment is reduced due to students leaving public schools for voucher programs. These adjustable costs include vital inputs into effective education like teachers’ salaries and textbooks. We refer to these indirect costs as the fiscal externality (a change in per-pupil spending on variable costs that come from sharp reductions in enrollment) and have created a calculator for districts to model fiscal externality costs in their districts (Wething 2024).
Conclusion
Universal public education supported the U.S. becoming one of the richest countries in the world in the 20th century (Goldin 2001). Getting there required consistent and stable funding to public schools and sufficient levels of spending to provide a strong education. Our research shows that public education funding in the U.S. has stalled out in recent years and, coupled with threats from voucher policies in states and at the national level, will harm future citizens by robbing them of the basic education and support they need to be capable citizens. Moreover, this policy decision, which was mostly in response to austerity measures by Republicans during the Great Recession, is not binding and could change with policies to fully fund public education. New evidence shows that money in education can make a huge difference in students’ educational attainment, such as improved test scores and their likelihood of finishing college, and their earnings well into their adulthood.
Notes
1. Ariz. H.R., HB 2853 (2022) Fiscal Note (June 16, 2022), https://www.azleg.gov/legtext/55leg/2R/fiscal/HB2853.DOCX.pdf
References
Allegretto, Sylvia. 2024. Teacher Pay Rises in 2023—but Not Enough to Shrink Pay Gap With Other College Graduates. Economic Policy Institute and Center for Economic and Policy Research, September 2024.
Baker, Bruce D., Matthew Di Carlo, and Mark Weber. 2024. The Adequacy and Fairness of State School Finance Systems. School Finance Indicators Database, January 2024.
Biasi, Barbara. 2019. “School Finance Equalization Increases Intergenerational Mobility: Evidence from a Simulated-Instruments.” Journal of Labor Economics 41, no. 1.
Biasi, Barbara, Lafortune, Julian, and David Schönholzer. 2025. “What Works and for Whom? Effectiveness and Efficiency of School Capital Investments Across the U.S.” The Quarterly Journal of Economics. https://doi.org/10.1093/qje/qjaf013.
Bureau of Economic Analysis. Various years. “Real Gross Domestic Product per Capita.” Public data series accessed through the Federal Reserve Economic Database. Accessed March 2025.
Bureau of Economic Analysis, National Income and Product Accounts. Various years. “Nominal Potential Gross Domestic Product.” Public data series accessed through the Federal Reserve Economic Database. Accessed March 2025.
Candelaria, Christopher A., and Kenneth A. Shores. 2019. “Court-Ordered Finance Reforms in the Adequacy Era: Heterogeneous Causal Effects and Sensitivity.” Education Finance and Policy 14, no. 1: 31–60. https://doi.org/10.1162/edfp_a_00236.
Cellini, Stephanie Riegg, Fernando Ferreira, and Jesse Rothstein. 2010. “The Value of School Facility Investments: Evidence from a Dynamic Regression Discontinuity Design.” Quarterly Journal of Economics 125, no. 1 (February 2010): 215–261. https://doi.org/10.1162/qjec.2010.125.1.215.
Davis, Carl. 2025. “Megabill Takes Cap Off Unprecedented Private School Voucher Tax Credit, Potentially Raising Cost by Tens of Billions Relative to Earlier Version.” Institute of Taxation and Economic Policy blog, July 2, 2025.
Dewey, Daniel C., Erin Fahle, Thomas J. Kane, Sean F. Reardon, and Douglas O. Staiger. 2025. Pivoting from Pandemic Recovery to Long-Term Reform: A District-Level Analysis. Center for Education Policy Research, February 2025.
Elbaum, Jack. 2023. “Test Scores Have Barely Risen Since 1970 Despite 245% Spending Increase.” Washington Examiner, June 22, 2023.
Ford, Chris, Stephenie Johnson, and Lisette Partelow. 2017. The Racist Origins of Private School Vouchers. Center for American Progress, July 2017.
Figlio, David, and Krzysztof Karbownik. 2016. Evaluation of Ohio’s EdChoice Scholarship Program: Selection, Competition, and Performance Effects. Thomas B. Fordham Institute, July 2016.
Goldin, Claudia. 2001. “The Human-Capital Century and American Leadership: Virtues of the Past.” Journal of Economic History 61, no: 2 (June): 263–292.
Griffith, Michael, and Dion Burns. 2024. Understanding the Cost of Universal School Vouchers: An Analysis of Arizona’s Empowerment Scholarship Account Program. Learning Policy Institute, February 2024.
Hanushek, Eric A. 2006. “School Resources.” Handbook of the Economics of Education 2: 865–908, http://dx.doi.org/10.1016/S1574-0692(06)02014-9.
Hyman, Joshua. 2017. “Does Money Matter in the Long Run? Effects of School Spending on Educational Attainment” American Economic Journal: Economic Policy 9, no. 4 (November 2017): 256–280.
Jackson, C. Kirabo, Rucker C. Johnson, and Claudia Persico. 2015. “The Effects of School Spending on Educational and Economic Outcomes: Evidence from School Finance Reforms.” Quarterly Journal of Economics 131, no. 1: 157–218. https://doi:10.1093/qje/qjv036.
Jackson, C. Kirabo, and Claire L. Mackevicius. 2024. “What Impacts Can We Expect from School Spending Policy? Evidence from Evaluations in the United States.” American Economic Journal: Applied Economics 16, no. 1 (January 2024): 412–446. https://doi.org/10.1257/app.20220279.
Kim, Jeonghyeok. 2024. “The Long Shadow of School Closures: Impacts on Students’ Educational and Labor Market Outcomes.” EdWorkingPaper no. 24-963 (Annenberg Institute at Brown University), May 2024. https://doi.org/10.26300/ax4m-3z14.
Kraft, Matthew A., and Melissa Arnold Lyon. 2024. “The Rise and Fall of the Teaching Profession: Prestige, Interest, Preparation, and Satisfaction over the Last Half Century.” EdWorkingPaper no. 22-679 (Annenberg Institute at Brown University), April 2024. https://doi.org/10.26300/7b1a-vk92.
Lafortune, Julien, Jesse Rothstein, and Diane Whitmore Schanzenbach. 2018. “School Finance Reform and the Distribution of Student Achievement.” American Economic Journal: Applied Economics 10, no. 2: 1–26. https://doi.org/10.1257/app.20160567.
Lafortune, Julien, and David Schönholzer. 2022. “The Impact of School Facility Investments on Students and Homeowners: Evidence from Los Angeles.” American Economic Journal: Applied Economics 14, no. 3 (July 2022): 254–289. https://doi.org/10.1257/app.20200467.
Lieberman, Mark. 2024. “How Much Does Special Education Truly Cost? Finally, an Answer Is on the Horizon.” Education Week, August 26, 2024.
Mills, Jonathan N., and Patrick J. Wolf. 2017. “Vouchers in the Bayou: The Effects of the Louisiana Scholarship Program on Student Achievement After 2 Years.” Education Evaluation and Policy Analysis 39, no. 3: 464–484. https://doi.org/10.3102/0162373717693108.
Mueller, Chris. 2024. “No, US Student Ranks Didn’t Plummet After Department of Education Creation.” USA Today, November 22, 2024.
National Center for Education Statistics. 2025a. “Table 236.60. Total and Current Expenditures Per Pupil in Fall Enrollment in Public Elementary and Secondary Schools, by Function and Subfunction: Selected School Years, 1990–1991 Through 2020–2021,” Digest of Education Statistics. Accessed February 2025.
National Center for Education Statistics. 2025b. “Table 236.55 Total and Current Expenditures per Pupil in Public Elementary and Secondary Schools: Selected School Years, 1919–1920 Through 2020–2021”, Digest of Education Statistics. Accessed February 2025.
National Center for Education Statistics, Common Core of Data. Various years. School District Finance Survey (F-33). Accessed March 2025.
National Center for Education Statistics, National Teacher and Principal Survey. Various years. “Public School Teacher and Private School Teacher Data Files.” Accessed March 2025.
Organisation for Economic Co-operation and Development. Various years. Indicators of Education Systems Programme. Accessed March 2025.
Rothstein, Jesse, and Diane Whitmore Schanzenbach. 2022. “Does Money Still Matter? Attainment and Earnings Effects of Post-1990 School Finance Reforms.” Journal of Labor Economics 40, no. 51.
Rothstein, Richard. 1997. Where’s the Money Going? Changes in the Level and Composition of Education Spending, 1991-96. Washington, D.C.: Economic Policy Institute.
Rothstein, Richard. 2024. “The Soft Bigotry of High Expectations.” Working Economics Blog (Economic Policy Institute), January 30, 2024.
Rothstein, Richard, and Karen Hawley. 1995. Where’s the Money Gone? Changes in the Level and Composition of Education Spending. Washington, D.C.: Economic Policy Institute.
U.S. Census Bureau, Small Area Income and Poverty Program Estimates. Various years. “School District Estimates for 2000.” Accessed March 2025.
U.S. Department of Agriculture (USDA). 2025.Child Nutrition Tables: National Level Monthly Data. Accessed May 2025.
Waddington, R. Joseph, and Mark Berends. 2018. “Impact of the Indiana Choice Scholarship Program: Achievement Effects for Students in Upper Elementary and Middle School.” Journal of Policy Analysis and Management 37, no. 4: 783–808. https://doi.org/10.1002/pam.22086.
Wething, Hilary. 2024. How Vouchers Harm Public Schools: Calculating the Cost of Voucher Programs to Public School Districts. Economic Policy Institute, December 2024.
Wething, Hilary, and Josh Bivens. 2024 “Vouchers Undermine Efforts to Provide an Excellent Public Education for All.” Working Economics Blog (Economic Policy Institute), May 15, 2024.