
Full Report
Introduction
H-2B is one of many U.S. temporary work visa programs.1 The Immigration and Nationality Act of 1952 created some of the existing temporary work visas, including the H-2 visas for foreign nationals “coming temporarily to the United States to perform other temporary services or labor, if unemployed persons capable of performing such service or labor cannot be found in this country.”2 In 1986, the Immigration Reform and Control Act (IRCA) split the H-2 visa into two separate visas: the H-2A for temporary workers employed in agricultural occupations and H-2B for temporary workers in occupations outside of agriculture.3 More specifically, the purpose of the H-2B program is for circumstances when nonagricultural employers cannot find sufficient U.S. workers in seasonal or temporary jobs and can prove to the U.S. Department of Labor that their need for an H-2B worker is legitimate. In practice, the most common H-2B occupations are in landscaping, construction, forestry, seafood and meat processing, traveling carnivals, restaurants, and hospitality. Legislation enacted subsequently to IRCA, the Immigration Act of 1990, established an annual numerical limit of H-2B visas that could be issued, of 66,000 visas, to take effect in fiscal year (FY) 1992.4 This annual numerical limit of 66,000 visas is often referred to as the H-2B annual “cap.”
As presently constructed, the H-2B visa program is deeply flawed. Like other temporary work visa programs, it is rife with abuse and in desperate need of reform. It fails to ensure that migrant workers are paid fairly and treated with dignity, and it fails to prevent harm to workers who already reside in the United States. It is of great concern that the current structure does not prevent employers with track records of labor, and wage and hour violations from hiring through the H-2B program. Current rules also make it easy for employers to game the system to bypass available U.S. workers who may be seeking seasonal jobs, and to then underpay migrant workers recruited through the H-2B program. Employers control the immigration status of their H-2B employees, leaving workers with little bargaining power or even the ability to leave a lawbreaking employer without losing their ability to earn back the significant investments migrant workers make to participate in the H-2B program. In addition, the families of H-2B workers, in practice, are not able to join workers in the United States, and H-2B workers have no path to permanent residence and U.S. citizenship, which prevents them from fully participating and integrating into American society, and reduces their potential contributions to the U.S. economy. Together, these flaws call into question the credibility of the program.
This is relevant today because employer demand for more H-2B visas continues to escalate, and successive presidential administrations have repeatedly used authority ceded by Congress to increase the size of the H-2B program since FY 2016. In light of the second Trump administration’s policies and actions to carry out “mass deportations,” employers are lobbying furiously for more H-2B visas to fill jobs left vacant by workers who have been deported or have left voluntarily, or who lost their work authorization as a result of the Trump administration’s canceling of temporary immigration protections like parole and Temporary Protected Status.5 The recent funding allocated for immigration enforcement via H.R.1 (the Republican-led budget bill that was passed by Republican lawmakers and signed into law by President Trump in July 20256) will turbocharge both deportations and employer pressure for more workers employed with temporary visas like H-2B. Meanwhile, neither the Biden administration nor the first or second Trump administrations has taken any actions to implement much-needed reforms that would protect migrant workers and U.S. workers as the H-2B program expands.
This report also assesses one industry, meatpacking, as a case study of an industry in which employers are currently not heavy users of the H-2B program but have been lobbying furiously to do so and may find a sympathetic Congress and administration, given Republican control of all three branches of government. Meat and poultry processing jobs are not all temporary jobs; in fact, most are year-round, permanent jobs, and current law requires that H-2B jobs be temporary, meaning 9 months or less (with some exceptions). This report considers the impact of expanding the H-2B program to year-round jobs in the meatpacking industry compared with providing green cards to currently unauthorized workers and hiring new permanent immigrant workers with green cards, who would have a path to a citizenship.
Arguably the United States needs pathways that allow more migrants to come to the United States—especially given demographic realities7 and the fact that nearly all prime-age workforce growth in the past 30 years has come from immigration.8 But the H-2B program is not a model for a fair and safe pathway because of flaws that leave workers vulnerable to wage theft, forced labor, and other forms of employer and labor recruiter lawbreaking, including human trafficking.9 In addition, as this report discusses, the available data on labor standards enforcement show that many employers have engaged in mass lawbreaking by stealing billions in wages from workers in major H-2B industries over the past 25 years.
In light of the abuses taking place in those industries, Congress and the executive branch expanding a flawed work visa program that channels vulnerable workers into those same problematic industries—rather than using the legal authority they have to improve the program so that both migrant and U.S. workers are adequately protected—is misguided. Rather than expand H-2B, the Trump administration should work with Congress to implement reforms that would protect all workers in H-2B industries and provide green cards for workers instead of temporary visas.
Background on the H-2B visa program size and appropriations riders
A previous report published in 2022 provides a fuller explanation of the background of the size of the H-2B program and a history of the legislative riders in appropriations bills that have been used to expand the size of the H-2B program.10 Nevertheless, a brief recap here is warranted. First, in fiscal year 2016, Congress authorized a “returning worker” exemption, through appropriations legislation to fund the operation of the U.S. government. The legislation included language (known as a “rider”) exempting H-2B workers from the cap in fiscal year 2016 if they were previously in H-2B status in any of the preceding three fiscal years. There was no cap on the number of returning H-2B workers under the exemption.11
In each year since FY 2017, Congress has, through appropriations riders, given the executive branch the discretionary legal authority to roughly double the number of H-2B visas available. The Democrats and Republicans in the congressional appropriations committees who included and supported the language to expand H-2B failed to specify the level of increase they wanted for the H-2B program—passing the buck instead to the executive branch by directing DHS, in consultation with DOL, to determine how many additional H-2B visas are appropriate, if any. DHS has interpreted the statute as allowing them to issue up to 64,716 supplemental visas in the corresponding fiscal year.12 In total, it has been 10 years (FY 2016–2025) since Congress first permitted increases to the size of the H-2B program through an appropriations rider, and appropriations legislators have proposed rider language that would allow for additional visas beyond 64,716 for fiscal year 2026.13
These additional visas above the cap set by Congress are generally referred to as “supplemental” visas. The Biden administration added 55,000 supplemental visas in 2022, setting the total H-2B cap for that year at 121,000. In the following three fiscal years (2023, 2024, and 2025), DHS under the Biden administration used the full authority granted to it in the legislative riders allowing the agency to issue 64,716 supplemental visas, raising the total H-2B annual limit to 130,716. While the first Trump administration used the authority granted to it by Congress to increase the size of the H-2B program with supplemental visas, representatives from the second administration have yet to state publicly any opinions on the size of the program and whether they would take action to expand it if granted the authority by Congress.
The true size of the H-2B program has reached 170,000
In 2021, USCIS began providing data, through the H-2B Employer Data Hub, on individual H-2B petitions that USCIS has adjudicated. H-2B petitions data are categorized under either new or continuing employment, including how many petitions for H-2B workers were approved or denied, and whether each approval was counted under the original annual cap of 66,000 or the supplemental cap for the corresponding fiscal year, or whether the H-2B job was exempt from the caps. In 2024, USCIS updated these data to provide additional clarity on the types of petitions filed on H-2B within those categories. The data now specify which petitions were for continuation of an H-2B petition with the same employer (in other words, H-2B workers who had their visas extended), how many petitions were for H-2B workers who changed employers, and how many were for H-2B workers who amended their conditions of employment. (H-2B visas that are approved for extensions, changing employers, and amending conditions of employment are not counted against the annual cap.) The newly released data date back to fiscal year 2015 and allow us to have a more complete picture of the true size of the H-2B program, even compared with the estimates published in 2022.14
Figure A shows that in 2015, while the statutory cap of 66,000 was still in place, the total number of H-2B workers was higher at 75,122, of which 69,684 were H-2B workers with newly issued visas from the State Department, and 1,572 were H-2B workers who had their employment extended with the same employer. An additional 3,866 were H-2B workers who changed employers.15
By 2024, when 64,716 supplemental H-2B visas were added to the statutory cap of 66,000, for a total cap of 130,716, there were a total of 169,177 H-2B workers, a total that is more than 2.5 times the size of the original H-2B annual cap. Of those nearly 170,000 H-2B workers, 139,541 were H-2B workers with newly issued visas from the State Department, and 4,580 were H-2B workers who had their employment extended with the same employer. An additional 25,056 were H-2B workers who changed employers.
The H-2B visa program grew to 170,000 in 2024—a record high and more than 2.5 times the size of the original annual cap: Estimated numbers of H-2B workers employed in the United States, fiscal years 2015–2024, and the H-2B annual and supplemental caps
| Year | Total H-2B workers | New H-2B visas | H-2B extensions with same employer | H-2B change of employer | H-2B statutory cap | H-2B cap + supplemental cap | H-2B cap + supplemental cap |
|---|---|---|---|---|---|---|---|
| 2015 | 75,122 | 69,684 | 1,572 | 3,866 | 66,000 | ||
| 2016 | 89,221 | 84,627 | 604 | 3,990 | 66,000 | ||
| 2017 | 90,169 | 83,600 | 891 | 5,678 | 66,000 | 81,000 | |
| 2018 | 92,798 | 83,774 | 1,777 | 7,247 | 66,000 | 81,000 | |
| 2019 | 104,192 | 97,623 | 891 | 5,678 | 66,000 | 96,000 | |
| 2020 | 74,285 | 61,865 | 2,942 | 9,478 | 66,000 | ||
| 2021 | 111,116 | 95,053 | 5,042 | 11,021 | 66,000 | 88,000 | |
| 2022 | 147,612 | 124,644 | 4,727 | 18,241 | 66,000 | 121,000 | |
| 2023 | 159,929 | 131,704 | 4,740 | 23,485 | 66,000 | 130,716 | |
| 2024 | 169,177 | 139,541 | 4,580 | 25,056 | 66,000 | 130,716 |

Notes: “Total H-2B workers” represents the author’s estimate based on the number of new visas issued by the U.S. State Department, plus the number of H-2B workers approved for continuing employment with the same employer (i.e., visa extensions or extensions of status), plus the number of H-2B workers with approved petitions to change employers, as reported in the USCIS H-2B Employer Data Hub. It is possible that some H-2B workers may have an approved petition for new employment in the same fiscal year as an approved petition for changing employers, which would lead to those workers being counted twice in the data.
Source: EPI analysis of data from U.S. Citizenship and Immigration Services, H-2B Employer Data Hub, U.S. Department of Homeland Security [data files for fiscal years 2015–2024]; and U.S. Department of State, “Nonimmigrant Visa Statistics” (PDF files for tables listed under “Nonimmigrant Visas by Individual Class of Admission” for fiscal years 2015–2023, and “Nonimmigrant Worldwide Issuance and Refusal Data by Visa Category” for fiscal year 2024).
H-2B workers are in a small number of industries and occupations for an average of 7.6 months
As discussed above, the data clearly show that the H-2B program is growing to unprecedented levels. However, H-2B workers are not spread across a wide range of industries and occupations but are highly concentrated in just a few.
Table 1 lists the top H-2B occupations by number of approvals in the USCIS H-2B Employer Data Hub, including approvals for initial employment (representing new H-2B jobs), continuing employment with the same employer (workers who have their H-2B job and status extended), and H-2B workers with approved petitions for changing employers.16 The data provided by USCIS for H-2B occupations are for broad occupational categories, which are reflected in Table 1. (Data on certified H-2B positions that are provided by DOL, on the other hand, categorize H-2B occupations under narrower titles distinguished by specific Standard Occupational Classification (SOC) codes, which fall under the broad categories provided by USCIS. DOL occupational data are discussed and analyzed later in this report.)
By far the top broad occupational category according to USCIS petition data is building and grounds cleaning and maintenance operations, accounting for 45.9% of all H-2B petitions counted, which corresponds to landscaping, maids and housekeepers, and janitors. The second largest occupation is food preparation and serving-related occupations, accounting for 14.1%, which correspond to jobs like restaurant cooks, food servers, and persons employed in fast food restaurants. The third largest is construction and extraction occupations, accounting for 7.7%, which correspond to construction laborers and other construction jobs like cement masons and concrete finishers.
As Table 1 shows, the top-10 occupations by number of approvals in the USCIS H-2B Employer Data Hub accounted for 98.8% of all H-2B approvals in 2024. If we exclude occupation number 7, “N/A”—which represents data observations in which the occupation field was missing—the remaining nine occupations still account for 94.5% of all H-2B approvals in 2024.
Nearly all H-2B workers are employed in a small number of occupations: Top-10 H-2B occupations by number of USCIS-approved petitions, fiscal year 2024
| H-2B Rank | Major group SOC code | Occupation | Initial approval | Continuing approval | Change of employer approval | Total approvals | Share of total H-2B approvals |
|---|---|---|---|---|---|---|---|
| 1 | 37 | Building and grounds cleaning and maintenance occupations | 84,067 | 740 | 8,542 | 93,349 | 45.86% |
| 2 | 35 | Food preparation and serving related occupations | 18,988 | 79 | 9,679 | 28,746 | 14.12% |
| 3 | 47 | Construction and extraction occupations | 14,808 | 141 | 2,373 | 15,684 | 7.70% |
| 4 | 51 | Production occupations | 13,910 | 250 | 527 | 15,476 | 7.60% |
| 5 | 45 | Farming, fishing, and forestry occupations | 13,028 | 283 | 509 | 14,669 | 7.21% |
| 6 | 39 | Personal care and services occupations | 11,225 | 39 | 1,861 | 13,125 | 6.45% |
| 7 | N/A | N/A | 5,593 | 2,986 | 178 | 8,757 | 4.30% |
| 8 | 53 | Transportation and material moving operations | 6,129 | 42 | 454 | 6,625 | 3.25% |
| 9 | 49 | Installation, maintenance, and repair occupations | 3,004 | 8 | 529 | 3,541 | 1.74% |
| 10 | 41 | Sales and related occupations | 1,107 | – | 66 | 1,173 | 0.58% |
| Totals for the top 10 | 171,859 | 4,568 | 24,718 | 201,145 | 98.8% | ||
| Totals for top-10 occupations excluding N/A | 166,266 | 1,582 | 24,540 | 192,388 | 94.5% | ||
| Total H-2B approvals, all occupations | 173,921 | 4,580 | 25,056 | 203,557 | 100.0% | ||
Note: SOC stands for Standard Occupational Classification, which is a system of job classification created by the U.S. Department of Labor, see https://www.bls.gov/oes/current/oes_stru.htm. N/A stands for not available; these were individual records in the H-2B Employer Data Hub that had blank fields for the column listing the occupation in an H-2B petition. Approved H-2B petitions for an employment change with the same employer, new concurrent approvals, and amended approvals, were excluded from the calculation.
Source: EPI analysis of fiscal year 2024 data file from U.S. Citizenship and Immigration Services, H-2B Employer Data Hub, U.S. Department of Homeland Security.
The average duration of H-2B jobs can be found by analyzing data from DOL’s Office of Foreign Labor Certification. The 243,798 certified jobs in fiscal year 2024 were approved for jobs with a duration of 232 days, or 7.6 months,17 with 86% of the jobs having been certified for 6 months or more, 75% certified for 7 months or more, 53% certified for 8 months or more, and 28% certified for 9 months or more.
A high-road employment strategy prioritizing green cards: Meatpacking as a case study
Despite the rapid increase in the size of the H-2B program, H-2B workers are concentrated in a small number of industries and occupations. By law, an employer’s need for an H-2B worker must be temporary or seasonal, but employers have been lobbying to expand H-2B into year-round, permanent jobs. Especially given the Trump administration’s determination to undertake a campaign of mass deportation and the massive influx of funding it has received through the Republican-led budget bill that was signed into law in July 2025, employers in many low-wage industries are looking for alternative employment strategies. One notable industry in which this push from employers for year-round H-2B workers is occurring is meatpacking—which we define as meat and poultry processing.
In this section, we consider some of the impacts on the industry, workers, and local economies if meatpacking employers were able to significantly increase their hiring of H-2B workers compared with a scenario in which workers have a permanent immigration status instead. In other words, if current unauthorized immigrant workers were provided with a path to a green card and citizenship, and/or if newly recruited immigrant workers were hired with a green card in hand.
Meatpacking is an industry with a clear history of employers weaponizing immigration trends and policies to hamstring the power of workers to demand higher job quality.18 In the early 20th century, meatpacking was arduous and unsafe work done overwhelmingly by foreign-born workers for extremely low pay. However, from the 1940s until the early 1980s, unionization rates in the sector were higher than in the manufacturing average, and this labor market power showed up as wages in the meatpacking sector actually exceeding the average of even the rest of the relatively high-wage manufacturing sector.
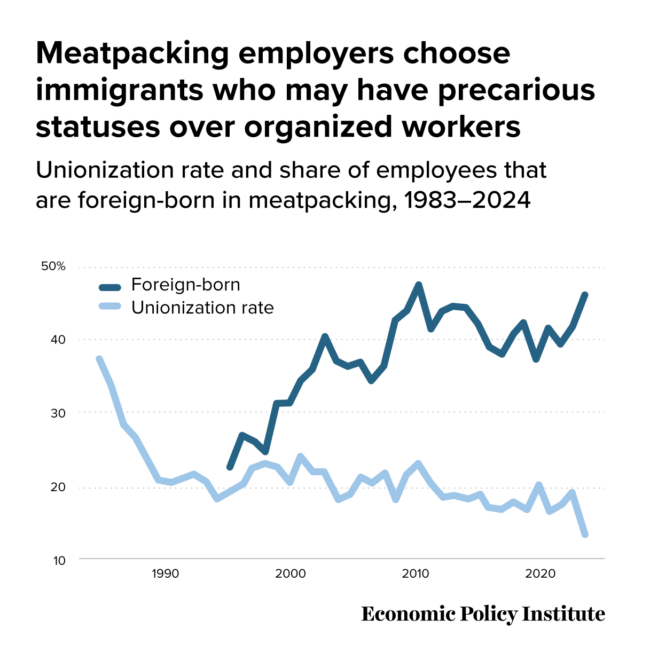
In the 1980s, however, unionization rates in the “animal slaughtering and processing” sector declined sharply, falling from 37.4% in 1983 to 20.5% in 1989.19 (This sector includes both meatpacking and poultry processing.) Historical research indicates that unionization trends (both the post-World War II increase and the subsequent fall) in this sector were largely driven by meatpacking.20 Unionization rates in this larger sector stayed roughly steady through the 1990s and 2000s, standing at 21.7% in 2007, right before the Great Recession. Since 2007 there has been a shallow (if uneven) decline, with unionization rates averaging under 19% since 2007. The year 2024 saw a very sharp one-year drop in the rate to 13.5%; it is unclear if this is a statistical blip or instead represents sustained downward pressure on unionization rates. Unionization rates in the animal processing sector remain about twice as high as the private-sector average (13.5% versus 6.7%) but far below rates prevailing in the early 1980s. 21
This decline in unionization rates corresponds with a rise in the share of the workforce that is foreign-born (shown in Figure B). This swapping out of unionized workers for many nonunionized immigrant workers was an intentional strategy of meatpacking employers who undertook aggressive recruitment campaigns in immigrant communities to find nonunion labor, including from beyond the borders of the United States. (Nevertheless, unions can and do unionize some foreign-born workers, despite the added difficulties caused by their immigration status, which makes them more vulnerable to exploitation and retaliation. However, data on their immigration statuses are not readily available (i.e., whether they are naturalized citizens, green card holders, or lack status)).
Meatpacking employers choose immigrants who may have precarious statuses over organized workers: Unionization rate and share of employees that are foreign-born in meatpacking, 1983–2024
| Date | Unionization rate | Foreign-born |
|---|---|---|
| 1983 | 37.4% | |
| 1984 | 33.4% | |
| 1985 | 28.3% | |
| 1986 | 26.6% | |
| 1987 | 23.9% | |
| 1988 | 20.9% | |
| 1989 | 20.5% | |
| 1990 | 21.1% | |
| 1991 | 21.6% | |
| 1992 | 20.4% | |
| 1993 | 18.2% | |
| 1994 | 19.3% | 22.4% |
| 1995 | 20.2% | 27.0% |
| 1996 | 22.4% | 26.1% |
| 1997 | 23.0% | 24.7% |
| 1998 | 22.5% | 31.1% |
| 1999 | 20.5% | 31.2% |
| 2000 | 24.0% | 34.3% |
| 2001 | 21.8% | 35.8% |
| 2002 | 21.8% | 40.1% |
| 2003 | 18.0% | 36.9% |
| 2004 | 18.7% | 36.4% |
| 2005 | 20.9% | 36.8% |
| 2006 | 20.4% | 34.2% |
| 2007 | 21.8% | 36.2% |
| 2008 | 18.0% | 42.6% |
| 2009 | 21.4% | 43.8% |
| 2010 | 23.0% | 47.4% |
| 2011 | 20.4% | 41.3% |
| 2012 | 18.3% | 43.8% |
| 2013 | 18.8% | 44.5% |
| 2014 | 18.2% | 44.3% |
| 2015 | 18.7% | 42.0% |
| 2016 | 16.9% | 38.6% |
| 2017 | 16.8% | 37.8% |
| 2018 | 17.8% | 40.8% |
| 2019 | 16.7% | 42.3% |
| 2020 | 20.3% | 37.2% |
| 2021 | 16.5% | 41.4% |
| 2022 | 17.3% | 39.2% |
| 2023 | 19.1% | 41.3% |
| 2024 | 13.5% | 46.1% |
Notes: Between 1983 and 2002 we use the “animal products industry” from non-durable manufacturing. After 2003 we use the “animal slaughtering and processing industry.” Other data (mentioned below) confirm that meatpacking constitutes a significant majority of the workers in this larger sector.
Source: EPI analysis of the Current Population Survey Outgoing Rotation Group microdata, EPI Current Population Survey Extracts, Version 2025.6.11, https://microdata.epi.org.
The precarity of much of the immigrant workforce in the meatpacking sector keeps wages suppressed—and not just for the foreign-born. In light of newly aggressive immigration enforcement, meatpacking employers may well be thinking about alternative ways to keep their workforce disempowered, especially if the option of large-scale employment of unauthorized workers becomes less viable. An obvious alternative model of immigration-based labor precarity would be to increase hiring through the H-2B visa program, since the program fails to fully protect the rights of migrant workers. At present, relatively few meatpacking employers hire through H-2B because the law only permits temporary jobs to be filled by H-2B workers, whereas meatpacking work is not temporary or seasonal.22 Expanded hiring of H-2B workers in meatpacking would require a statutory change, and reports from industry publications suggest that employers are, in fact, lobbying for that, as well as a change to allow hiring through the H-2A visa program, an uncapped visa program that is currently only permitted for seasonal farm jobs.23
Why a precarious workforce for meatpacking is bad for local economies
A replacement of the existing precarious immigrant workforce with another precarious and temporary migrant workforce would do nothing to spur needed job-quality improvements in meatpacking. If the widespread adoption of H-2B visas went beyond this and began displacing unionized positions, already insufficient job quality would degrade significantly.
The possibility of visa-enabled suppression of workers’ wages and bargaining power would obviously be bad for meatpacking workers themselves, but this would also be bad for the local economies that meatpacking plants often anchor. The meatpacking industry in recent decades has seen pronounced concentration, with more and more meatpacking done by a smaller number of very large firms, but also done in more geographically concentrated plants, usually located far from metropolitan centers.24 The concentration of meatpacking in less urban parts of the United States means that meatpacking workers’ leverage is weaker due to a lack of easily obtainable alternative job options, should they lose their meatpacking jobs.25
This geographic concentration also means that the local meatpacking plant is often a key engine of local economies. Anything that degrades workers’ wages at these plants translates directly into less money flowing into the local economies. The corresponding increase in profits and business income that accompanies successful wage suppression efforts is far less likely to redound to the benefit of these local economies. The owners of today’s meatpacking plants tend to be large corporate conglomerates that distribute profits to the shareholders and managers who overwhelmingly live outside the counties and towns that plants are located in.
Going forward, the choice facing the meatpacking industry seems to be a high-road or low-road workforce strategy, both of which will require changes to current U.S. law. The high-road strategy—converting today’s precarious immigrant pool into a unionized workforce (composed of both foreign-born workers with a permanent immigration status and U.S.-born workers)—will raise wages for meatpacking workers and raise spending and demand for labor in the local economies anchored by these plants. The low-road strategy—converting today’s precarious immigrant labor pool into tomorrow’s precarious temporary migrant labor pool—will do the opposite. Namely, the low-road strategy entails replacing current unauthorized immigrant workers and workers with time-limited protections like Temporary Protected Status and parole, with H-2B workers on temporary visas that fail to provide fundamental labor and workplace protections. That scenario will keep meatpacking wages extremely low and sap demand in local economies.
Wage gains from providing workers with a permanent immigration status would raise demand for goods and services in local economies
The potential stakes in this decision are not trivial. According to the Current Employment Statistics (CES) of the Bureau of Labor Statistics (BLS), the animal slaughtering and processing industry (including poultry processing) employs roughly 560,000 people in the United States. According to data from the Census of Manufacturing, these workers earn a combined payroll of nearly $30 billion.26 There were animal processing facilities in 37 states in 2022, and in 23 of them, its value of shipments (revenue) exceeded 1% of total gross state product (GSP).27 In recent decades, a growing share of meatpacking plants has been concentrating in rural and nonmetropolitan areas, making this one of the few key hubs of economic activity that is growing, rather than shrinking, in these regions.28
In Table 2, we show the 23 states in which revenues of meatpacking constitute an economically significant part of the state’s overall activity—a threshold we define as 1% of GSP. Table 2 shows the total GSP in the 23 states, and then the value of shipments (revenue), payroll, value-added, and value of shipments as a percentage of GSP for animal slaughtering and processing, including poultry processing.
Meat and poultry processing is a key part of several state economies: Gross State Product, value of shipments (revenues), payroll, and value-added in meat and poultry processing in 2022, in millions of dollars, top-23 states
| Total ($millions) | Meat and poultry processing ($millions) | ||||
|---|---|---|---|---|---|
| State | Gross State Product | Value of shipments | Payroll | Value-added | Value of shipments as % of GSP |
| Nebraska | 167,480 | 27,990 | 1,784 | 8,334 | 16.7% |
| Kansas | 212,612 | 24,270 | 1,127 | 7,733 | 11.4% |
| Iowa | 242,753 | 19,863 | 1,798 | 4,948 | 8.2% |
| Arkansas | 168,606 | 11,568 | 1,325 | 4,004 | 6.9% |
| Mississippi | 142,762 | 6,319 | 711 | 2,308 | 4.4% |
| Delaware | 92,558 | 3,589 | 329 | 1,854 | 3.9% |
| South Dakota | 69,069 | 2,640 | 353 | 497 | 3.8% |
| Alabama | 284,949 | 9,818 | 1,089 | 3,793 | 3.4% |
| Wisconsin | 400,621 | 10,732 | 984 | 3,534 | 2.7% |
| Minnesota | 454,993 | 10,246 | 928 | 2,614 | 2.3% |
| North Carolina | 728,499 | 15,168 | 1,430 | 5,290 | 2.1% |
| Missouri | 400,265 | 8,099 | 897 | 2,628 | 2.0% |
| Georgia | 779,684 | 14,831 | 1,684 | 4,977 | 1.9% |
| Oklahoma | 245,976 | 4,670 | 487 | 1,226 | 1.9% |
| Colorado | 494,673 | 8,847 | 512 | 0 | 1.8% |
| Kentucky | 261,541 | 4,449 | 491 | 1,373 | 1.7% |
| Illinois | 1,040,353 | 14,871 | 1,301 | 4,260 | 1.4% |
| Idaho | 112,290 | 1,425 | 131 | 397 | 1.3% |
| South Carolina | 301,945 | 3,983 | 382 | 1,326 | 1.3% |
| Utah | 261,081 | 3,388 | 254 | 1,199 | 1.3% |
| Indiana | 473,493 | 5,834 | 545 | 1,414 | 1.2% |
| Texas | 2,436,925 | 29,163 | 2,289 | 9,466 | 1.2% |
| Pennsylvania | 919,741 | 10,257 | 1,000 | 3,021 | 1.1% |
Note: “Meat and poultry processing” is NAICS code 3116 (“animal slaughtering and processing”) with NAICS code 316615 (“poultry processing”).
Source: EPI analysis of Bureau of Economic Analysis (BEA) Gross State Product and 2022 Economic Census of Manufacturing data.
Table 3 shows total employment in animal processing (which includes both meat and poultry processing), and the shares of workers who are U.S.-born and foreign-born, and the subsets of the foreign-born who are naturalized citizens and noncitizens. Currently, foreign-born workers in the sector constitute over 40% of the workforce, and roughly three-fourths of these workers are not U.S. citizens.29 Noncitizen workers are likely a mix of unauthorized immigrant workers, green card holders including refugees and asylees, migrant workers with temporary visas, asylum seekers, and workers with temporary immigration protections like parole and Temporary Protected Status that provide legal work authorization.30
Table 3 also shows that the implied labor market precarity of this workforce appears in average wages: Wages for U.S.-born workers are more than 25% higher than for foreign-born workers. Further, wages for both U.S.-born workers and foreign-born workers in the sector are significantly higher than wages reported for the 311 total jobs certified by the U.S. Department of Labor for new H-2B workers in the “butchers and meat cutters” and “slaughterers and meat packers” occupations in 2024.
The last two columns in the bottom half of the table show how wages in the meatpacking sector stack up against wages in the overall economy. The second column shows the ratio of average wages in the meatpacking sector to median wages in the overall economy for each group. The last column shows average wages per group in the overall economy, showing that average wages for all workers are significantly higher than for both U.S.-born and foreign-born meatpacking workers. One takeaway from this table is that for U.S.-born workers, the meatpacking sector is notably low wage, with average hourly wages constituting just 83.2% of typical (median) wages for U.S.-born workers across the overall economy. However, for foreign-born workers, average hourly wages in meatpacking exceed the median for foreign-born workers across the wider economy.
Foreign-born employment shares are higher, and wages are lower in meatpacking compared with other industries: Employment and wages in meat and poultry processing vs. the overall economy, pooled 2022–2024 estimates, and H-2B average certified wages, 2024
| Animal processing employment | Animal processing, employment shares | Overall economy, employment | Overall economy, employment shares | |
|---|---|---|---|---|
| Total | 562,600 | 100.0% | 157,960,000 | 100.0% |
| U.S.-born | 325,058 | 57.8% | 129,262,678 | 81.8% |
| Foreign-born | 237,542 | 42.2% | 28,697,322 | 18.2% |
| Naturalized citizen | 69,592 | 12.4% | 13,897,798 | 8.8% |
| Non-citizen | 167,951 | 29.9% | 14,799,523 | 9.4% |
| Animal processing, average hourly wage | Animal processing, % share of national median hourly wage | Overall economy, average hourly wage for all workers | ||
| All workers | $23.88 | 96.0% | $34.30 | – |
| U.S.-born | $26.20 | 83.2% | $34.33 | – |
| Foreign-born | $20.69 | 105.4% | $34.18 | – |
| New H-2B certifications | $16.66 | 83.2% | – | – |
Notes: Animal processing includes poultry. Overall employment numbers for both animal processing and overall economy numbers are from the Current Employment Statistics (CES). Shares of employment accounted for by citizenship status from the Current Population Survey (CPS), then these shares were applied to CES overall numbers to obtain levels. The H-2B average hourly wage for animal processing was calculated by taking the weighted average hourly wage of all 311 jobs certified by the Office of Foreign Labor Certification (OFLC) for new H-2B workers in the “butchers and meat cutters” and “slaughterers and meat packers” occupations in 2024 for fiscal year 2024. For the calculation, the the lowest allowable wage employers were required to pay their H-2B employees was used, as reported in OFLC's data.
Source: EPI analysis of Bureau of Labor Statistics (BLS) Current Employment Statistics (CES) and Current Population Survey (CPS) data, and H-2B disclosure data from the Office of Foreign Labor Certification's Performance Data, U.S. Department of Labor, for fiscal year 2024.
This wage advantage we see here for U.S.-born workers is right in line with many research-based estimates of the wage premium for having a permanent immigration status (a green card or citizenship) relative to either temporary work visas or the lack of an immigration status and work authorization. For example, Gass Kandilov found a 24.7% increase in wages for migrant workers on temporary visas, following the receipt of a green card,31 while Mukhopadhyay and Oxborrow also found a 25.4% increase in wages from transitioning from a temporary visa to a green card.32
Similarly, Edwards and Ortega find that legalization erases 20% of the gap in observed productivity of unauthorized and U.S.-born workers, indicating that legal status alone would raise wages by (at least) 20% for workers receiving permanent status.33
Given these estimates, we can provide a very rough calculation about how much wages would rise if the current foreign-born workforce in meat and poultry processing received a change in immigration status that granted them the same labor market rights and power as U.S.-born workers. These wage gains would translate essentially dollar-for-dollar into increased demand for goods and services in the local economies in which they work.
A 20% wage gain due to being granted permanent status (the midpoint of these estimates) would raise the overall payroll in meat and poultry processing—and hence, the demand flowing through the local economies surrounding meatpacking plants—by roughly 3.75%.34 In dollar terms, this would generate $1.1 billion additional dollars for the local economies surrounding meatpacking plants.35
Importantly, Apgar finds that unauthorized workers and those in temporary work visa programs face essentially identical wage penalties relative to immigrants with long-term permanent status.36 She finds raw wage penalties of roughly 25% and regression-based wage penalties of 10–15%, and no significant difference in these between visa holders and unauthorized workers. This means that an employer strategy that instead sought to replace today’s unauthorized foreign-born workers in meatpacking with workers on temporary visas would not generate these wage gains and, hence, would fail to provide any boost to the local economies where these workers live.
Permanent immigrants will invest more in local economies because they send fewer remittances abroad than temporary migrants do
Besides the additional boost to local economies stemming from higher wages induced by granting permanent status to currently precarious workers, there are other potential benefits that would accrue from a program of granting permanent status and full workplace rights to today’s foreign-born meatpacking workforce. For one, evidence indicates that permanent immigrants spend more of their income in their country of residence than do temporary migrants. Temporary migrants tend to direct more consumption spending in their country of origin (often by taking more frequent trips there), and they also tend to remit a higher share of their income than permanent immigrants do.
The magnitude of these effects could be considerable. William Olney, for example, found that immigrants residing in Germany remitted 11% of their income abroad.37 This looks in line with what data from the United States would suggest: In 2024 remittances from the United States were roughly $230 billion based on the aggregate labor income of foreign-born workers of roughly $2.1 trillion in 2023.38
Findings from two studies (one by Dustmann and Mestres39 and another by Pinger40) indicate that remittance rates among “temporary” migrants are 30% higher than rates for “permanent” immigrants. While it seems clear that workers on temporary visas in the United States are “temporary” and workers with permanent lawful status are “permanent,” it is not entirely clear how unauthorized immigrants currently living in the United States fit into these categories. However, if the Trump administration’s sharp increase in deportations and cancellations of status protections like TPS and parole continue, and it results in a large chunk of the current meatpacking workforce being replaced, the choice facing the meatpacking industry in terms of whether to take the low- or the high-road in constructing this future workforce maps near perfectly onto this “temporary” versus “permanent” distinction. Either the industry pushes for a system that allows employers to hire temporary workers on visas or a system in which long-term immigrants who are permanent residents can be recruited and will work in unionized jobs. The difference between the low- and high-road will have nontrivial effects on remittances—and by extension, the amount of income that meatpacking workers will spend in local economies.
If we take the foreign-born noncitizen share of the meatpacking workforce shown in Table 3 (29.9%) and assume that 5% of those workers have a permanent status via green cards, that means roughly 25% of workers in meatpacking are foreign-born and lack permanent status. Assume this workforce is converted to one with temporary work visas. In this case, those workers would likely remit 13.5% of their earnings (the average for foreign-born workers without permanent status). Conversely, a permanent regularization of status that saw their wages rise by 20% would also see their remittance rate drop to 10.5%.41 This, in turn, implies that remittances would drop by $220 million, and this money would flow to local economies. 42
While this likely overstates the number of “temporary” immigrants (because some share of the unauthorized population has resided in the United States for many years), it does give a sense of how important the temporary versus permanent distinction is for remittance behavior and how big an economic effect would be triggered by changes in the temporary or permanent classification. The obvious implication is that any move in either meatpacking or the wider economy to increase the share of the overall workforce on temporary work visas will see a rise in remittances that will come at the expense of demand for goods and services in local economies.
Family unity through green cards brings additional economic benefits
The remittances flow to the places where workers’ families live, which highlights another potential benefit from granting permanent status: Temporary migrants are far less likely to bring their families to the United States, including their spouses. This is especially true for workers on H-2A and H-2B visas. While H-2B workers are legally allowed to apply to have their spouses accompany them through H-4 visas, those spouses are not allowed to obtain work permits. Given that H-2A and H-2B workers earn very low wages, it does not make economic sense for them to apply for H-4 spousal visas, since the couple would have to survive in the United States—a higher-wage country than the countries of origin of most H-2A and H-2B workers—on just one low-wage salary. Also, as others have observed, there are additional reasons that contribute to very few spouses of H-2A and H-2B workers obtaining H-4 visas.43 If workers in the United States doing low-wage work on temporary work visas have spouses who remained in their country of origin, it seems obvious that workers on temporary work visas will remit a higher share of their income to support their families. If spouses are allowed to accompany workers to the United States, the remittances that previously went to spousal support abroad will instead spur demand for local economic output.
Additionally, spouses of working immigrants are themselves potential workers. If workers who would be employed in the United States on temporary work visas were instead granted permanent status—and hence, were able to bring working spouses to the United States—it would increase the labor supply and the rate of new business formation in local communities.
Consider two scenarios. In the first, the 25% of workers in the meatpacking industry who are foreign-born but not naturalized U.S. citizens or permanent residents, then become H-2B visa holders, and hence, are almost universally unable to have working spouses accompany them. In the second, these workers are instead granted permanent immigrant status via green cards. Assume that half of workers with permanent status bring working spouses to the United States and that two-thirds of the spouses work at a wage that is two-thirds as high as the spouses in meatpacking.44 This would generate an additional $1.3 billion in labor income for local economies surrounding meatpacking plants.
A high-road employment strategy for meatpacking with green cards would result in an additional $2.62 billion flowing to local economies surrounding meatpacking plants
In sum, the high-road employment scenario discussed here would lead to significant economic benefits for local economies surrounding meatpacking plants. First, there would be an additional $1.1 billion based on the likely wage gain due to workers having permanent status through green cards. There would be an additional $220 million resulting from the drop in remittances from workers having a green card compared with them being temporary workers. And an additional $1.3 billion in labor income would result from meatpacking workers with green cards who are able to keep their families together and have spouses who are permitted to work in the United States. Thus, the full economic impact of a high-road labor and immigration policy strategy for the meatpacking industry sums to about $2.62 billion in additional money flowing to local economies surrounding meatpacking plants. In the 23 states we identified previously that account for 80% of meatpacking activity, the average boost to state economies would be roughly $85 million per state.
Wages are still too low in H-2B occupations and undercut U.S. wage standards
Another important element of the H-2B program, and one that has been ripe for reform for many years, is the H-2B wage methodology, which sets out the minimum wages that employers must pay their H-2B workers. In most cases, since 2015, the DOL’s H-2B wage methodology has required that employers advertise most H-2B jobs to U.S. workers at the local average wage for the specific occupation and pay their H-2B employees that wage—according to data from the DOL’s Occupational Employment and Wage Statistics (OEWS) survey.45 While at first glance, this appears to be a reasonable wage rule, in practice, the available evidence makes clear that the H-2B wage rule is undercutting wage standards at the national level in H-2B occupations and is, therefore, not consistent with the law establishing the H-2B program.
To illustrate, see Table 4, which shows the top-15 H-2B occupations in fiscal year 2024 by Standard Occupational Classification code, according to the number of H-2B jobs certified by DOL. (These are narrower occupations that fall within the broader occupational codes used in Table 1 and by USCIS.) For context, as Table 4 shows, the top-15 H-2B occupations accounted for 82% of all certified H-2B jobs in 2024. The column to the right of the number of certified jobs is the nationwide average hourly wage for all certified H-2B workers in each of the occupations, according to our analysis of DOL disclosure data.46
To the right of the H-2B average hourly wage column are the 2024 average hourly wage rates for all workers in the occupation nationwide, according to DOL’s OEWS survey, which is the same data set used to set H-2B wage rates, making it an apples-to-apples comparison. The final two columns show the difference between the average hourly certified wage for all H-2B workers nationwide in the occupation and the average hourly OEWS wage for all workers in the entire country—the dollar amount and in percentage terms. In other words, these numbers reveal the amounts by which certified H-2B wages are undercutting national-level wage standards in H-2B occupations. Table 4 clearly shows that the H-2B program is allowing employers to legally undercut U.S. wage standards, which harms all workers, regardless of whether they are U.S.-born citizens or foreign-born.
While, as noted above, H-2B wages are set at the local level according to each job, we must instead look at the impact of the H-2B program on the average wages of H-2B occupations at the national level because the H-2B statute sets a national standard for the protection of U.S. labor standards. The H-2B statute clearly states that H-2B workers can be hired only “if unemployed persons capable of performing such service or labor cannot be found in this country.”47 In order to determine whether there are “unemployed persons” in the United States capable of doing a job before an employer can hire an H-2B worker, employers should be required to offer at least the local, state, or national average wage for the occupation (whichever is highest), recruit U.S. workers nationwide, and offer to pay for housing and transportation for both U.S. and H-2B workers. But under the H-2B recruitment and wage regulations, that’s never been the case.
Average certified wages for H-2B jobs are lower than U.S. wage standards: National average certified H-2B wage by occupation, average OEWS wage, and dollar amount and percent below OEWS wage, top-15 H-2B occupations by number of jobs certified
| H-2B Rank | SOC Code | Occupation | H-2B jobs certified | H-2B average hourly wage | OEWS national average hourly wage | Amount below national average hourly wage | Percent below national average hourly wage |
|---|---|---|---|---|---|---|---|
| 1 | 37-3011 | Landscaping and groundskeeping workers | 90,109 | $17.55 | $19.66 | $2.11 | 10.7% |
| 2 | 37-2012
|
Maids and housekeeping cleaners | 19,138 | $15.81 | $17.39 | $1.58 | 9.1% |
| 3 | 45-4011 | Forest and conservation workers | 14,934 | $15.51 | $20.59 | $5.08 | 24.7% |
| 4 | 39-3091 | Amusement and recreation attendants | 12,398 | $12.48 | $15.07 | $2.59 | 17.2% |
| 5 | 35-2014 | Cooks, restaurant | 11,515 | $17.74 | $18.14 | $0.40 | 2.2% |
| 6 | 47-2061 | Construction laborers | 9,210 | $20.85 | $24.64 | $3.79 | 15.4% |
| 7 | 51-3022 | Meat, poultry, and fish cutters and trimmers | 9,116 | $14.45 | $18.58 | $4.13 | 22.2% |
| 8 | 35-3031 | Waiters and waitresses | 7,294 | $17.52 | $18.44 | $0.92 | 5.0% |
| 9 | 35-3023 | Fast food and counter workers | 6,693 | $12.68 | $15.07 | $2.39 | 15.8% |
| 10 | 37-2011 | Janitors and cleaners, except maids and housekeeping cleaners | 4,621 | $16.94 | $18.01 | $1.07 | 6.0% |
| 11 | 39-2021 | Animal caretakers | 3,298 | $15.72 | $16.71 | $0.99 | 5.9% |
| 12 | 53-7062 | Laborers and freight, stock, and material movers, hand | 3,002 | $18.02 | $19.91 | $1.89 | 9.5% |
| 13 | 49-9098 | Helpers–installation, maintenance, and repair workers | 2,710 | $17.58 | $19.59 | $2.01 | 10.3% |
| 14 | 47-2051 | Cement masons and concrete finishers | 2,484 | $23.66 | $28.54 | $4.88 | 17.1% |
| 15 | 53-7064 | Packers and packagers, hand | 2,410 | $14.85 | $17.59 | $2.74 | 15.6% |
| Total jobs certified in top-15 H-2B occupations | 198,932 | ||||||
| Total H-2B jobs certified in all occupations | 243,798 | ||||||
| Top-15 share of all H-2B jobs certified | 82% | ||||||
Note: SOC stands for Standard Occupational Classification, which is a system of job classification created by the U.S. Department of Labor, see https://www.bls.gov/oes/current/oes_stru.htm. The H-2B average hourly wage is calculated by taking the weighted average hourly wage of all jobs certified by the Office of Foreign Labor Certification (OFLC) for new H-2B workers for each of the corresponding occupations, for fiscal year 2024. For the calculation, the lowest allowable wage employers were required to pay their H-2B employees was used, as reported in OFLC's data.
Source: EPI analysis of the Bureau of Labor Statistics’ 2024 Occupational Employment and Wage Statistics data, and of H-2B disclosure data from the Office of Foreign Labor Certification's Performance Data, U.S. Department of Labor, for fiscal year 2024.
Table 4 shows that in all of the top-15 H-2B occupations in fiscal year 2024, the average hourly wage certified nationwide for H-2B workers was lower than the OEWS average hourly wage for all workers in the occupation. The biggest wage differential was found in the forest and conservation workers occupation: The national average hourly wage was $5.08 higher than the average wage certified for H-2B workers. The next biggest difference was for cement masons and concrete finishers, where the national average wage was $4.88 higher than the average wage certified for H-2B workers. If, for example, an employer hired an H-2B cement mason to work for 40 hours per week for the average duration of an H-2B job (approximately 33 weeks) at $4.88 per hour less than the national average wage—due to local wage variations, as the H-2B wage rule allows—the employer would save, and an H-2B worker would be underpaid by $6,442.
In the top occupations of landscaping and groundskeeping workers—which accounted for 37% of all H-2B certified jobs in 2024—the average H-2B wage was $2.11 lower per hour than the national average wage, almost 11% less. The construction laborers’ occupation, which is consistently one of the top H-2B occupations every year, had an average H-2B wage that was $3.79 less than the national average wage for the occupation, over 15% less. Employers in the seafood industry, who every year are some of the loudest voices calling for an increase in the H-2B cap, collectively paid their H-2B workers $4.13 less per hour than the national average wage in the meat, poultry, and fish cutters and trimmers occupation, over 22% less.
An easy way to fix this so that the H-2B wage rule no longer undercuts existing U.S. wage standards and so that it is consistent with the statute that establishes the program would be to require that employers pay at least the highest of the local, state, or national average wage for the occupation according to DOL’s OEWS data. DOL could even require a higher wage—for example, the 75th-percentile wage instead of the average—in order to incentivize additional recruitment of U.S. workers. DOL has the legal authority to make these changes via regulation—and given the popularity of the H-2B program among employers and employer pressure to increase the size of the program, the Trump administration should consider implementing such a rule in order to protect wage standards in H-2B occupations and ensure that migrant workers in H-2B are not exploited and underpaid relative to U.S. wage standards.
There’s an additional element of the current H-2B wage rule that allows employers to undercut wage standards in H-2B: employer-provided private wage surveys. Employers have the ability, under the current rules, to cherry-pick the data source they like in order to establish the legal minimum wage rates for their H-2B employees through non-governmental wage surveys that DOL approves. One can rightly assume that employers never go through the trouble of using one of these private wage surveys to increase the minimum wage they’ll pay their H-2B workers—they only use them to lower it. Seafood employers are fond of this loophole, and examples exist showing they are able to pay their workers much less than what the local and state average wage for the occupation would have required.48
Wage theft is a massive problem in major H-2B industries: Employers have stolen over $2.2 billion from workers since 2000
As discussed in this report, H-2B workers are concentrated in a small number of industries and occupations. Data on labor standards enforcement paint a picture of rampant wage theft and lawbreaking by employers in those few industries that employ most H-2B workers, revealing that workers are being recruited into industries where they will be vulnerable. This is cause for concern, but especially so now given the rapid growth in the H-2B program and employer pressure to change the law to allow them to hire through H-2B for year-round jobs.
DOL’s Wage and Hour Division (WHD) publishes and annually updates tables with summary data on the outcomes of WHD enforcement actions in what it calls “industries with high prevalence of H-2B workers.” The seven industries WHD lists in these data tables include landscaping services, janitorial services, hotels and motels, forestry, food services, construction, and amusement. Data on the top H-2B occupations (from the USCIS H-2B Employer Data Hub and DOL labor certifications cited in Tables 1 and 4) show that the vast majority of H-2B jobs that are certified by DOL and approved by USCIS are within these broad industries.49
The published WHD enforcement data include tables for individual fiscal years in four different categories, for fiscal years 2014–2024.50 WHD previously published data going back to 2000, but they are no longer available online (but have been preserved by the author and used for this analysis).51 The first set of tables, “Compliance Action Summary,” includes data on violations of all wage and hour laws enforced by WHD in the listed industries. The second set of tables, “H-2B Violations Only,” summarizes employer violations of H-2B program laws and regulations. The third set, “FLSA Violations Only,” summarizes employer violations of the Fair Labor Standards Act. The final set, “All Other Violations,” summarizes violations of all laws that WHD enforces, except for violations of FLSA or H-2B laws and regulations.
It is important to note that the violations and back wages owed that are detailed in these tables from WHD do not represent enforcement actions that involve only H-2B workers; they represent violations and back wages owed to any worker in the seven selected H-2B industries. These may include U.S. citizens, lawful permanent residents (i.e., green card holders), H-2B workers, or workers of any other immigration status, including unauthorized immigrant workers.
Table 5 sums the total numbers of listed compliance actions and employees involved, along with the total amounts of back wages owed and civil money penalties (CMPs) across all 25 fiscal years, 2000–2024, adjusting WHD’s data on back wages owed and CMPs assessed to constant 2024 dollars. The average back wages owed per employee were calculated from WHD’s data and are also included.
Employers have stolen more than $2.2 billion in wages over the last 25 years from workers in industries that employ H-2B workers: Back wages and civil money penalties assessed for wage and hour violations in industries with a high prevalence of H-2B workers, by industry, fiscal years 2000–2024
| Industry | Compliance Actions | Employees involved in violation | Employees owed back wages | Back wages assessed (2024$) | Average back wages owed per employee (2024$) | Civil money penalties assessed (2024$) |
|---|---|---|---|---|---|---|
| All seven industries | 247,180 | 2,021,557 | 1,822,164 | $2,238,327,967 | $1,228 | $167,554,391 |
| Amusement | 8,138 | 74,216 | 67,019 | $40,037,461 | $597 | $11,641,069 |
| Construction | 74,380 | 653,135 | 595,140 | $1,052,484,332 | $1,768 | $28,961,835 |
| Food services | 120,006 | 932,696 | 828,393 | $829,555,849 | $1,001 | $96,121,840 |
| Forestry | 1,524 | 14,336 | 12,052 | $14,056,849 | $1,166 | $5,621,595 |
| Hotels and motels | 24,039 | 159,773 | 148,921 | $105,638,105 | $709 | $11,197,257 |
| Janitorial services | 12,732 | 116,200 | 106,252 | $119,191,774 | $1,122 | $6,113,121 |
| Landscaping services | 6,361 | 71,201 | 64,387 | $77,363,583 | $1,202 | $7,897,691 |
Notes: Tables include all violations of laws enforced in the selected industries by the Wage and Hour Division of the U.S. Department of Labor. The violations and back wages owed do not represent enforcement actions by the Wage and Hour Division that involve only H-2B workers; they represent violations and back wages owed to any worker in the seven selected H-2B industries. These may include U.S. citizens, lawful permanent residents (i.e., green card holders), H-2B workers, or workers of any other immigration status, including unauthorized immigrant workers. Dollar amounts reported in this table have been adjusted for inflation to constant 2024 dollars using the C-CPI-U. As a result, the dollar amounts presented here may differ from the amounts reported in the source data. Totals may not sum due to rounding.
Source: EPI analysis of Wage and Hour Division, “Industries with High Prevalence of H-2B Workers," U.S. Department of Labor [data tables for fiscal years 2014–2024 are available online as of June 25, 2025, and data for fiscal years 2000–2021 are on file with the author].
Table 5 shows that across the 2000–2024 period, there were 247,180 compliance actions by WHD, and over 2 million workers were involved—i.e., were potential wage theft victims—in the cases that detected violations. Over 1.8 million of those workers were assessed by WHD to have actually been victims of wage theft—that is, their employers had failed to pay them the full wages to which they were entitled by law.
For those 1.8 million employees, WHD assessed a total of over $2.2 billion in back wages that were owed to them by their employers during the 25 fiscal years from 2000 through 2024. That’s an average of $89.5 million stolen per year from low-wage workers in the main industries that employ H-2B workers. Such a large dollar amount of stolen wages is particularly shocking when considering that most of the jobs in the seven major H-2B industries are associated with very low wages, as shown in Table 4.
It’s also important to remember that $2.2 billion represents only the extent of wage theft detected in the cases WHD investigated. There is no way to know the actual amounts of wages stolen in these industries. We do know that workers, especially low-wage workers—regardless of whether they are U.S.-born or foreign-born—often hesitate to report wage and hour and labor violations for fear of retaliation.52 We also know that WHD has limited investigative capacity, with annual funding that is flat53 and record-low numbers of WHD investigators on the job, with only 611 policing a labor market of 170 million workers as of May 2025.54 For these reasons, the actual extent of wage theft is likely higher—perhaps significantly higher—than $2.2 billion.
Table 5 also shows that on average, each worker who was assessed back wages was owed $1,228 by their employer. Back wages owed to workers were highest in construction with an average of $1,768 per worker. The second-highest amounts of back wages owed per worker were in landscaping—the industry that every year accounts for roughly 40% of all H-2B jobs—at $1,202 per worker.
In terms of civil money penalties, the total amount assessed during 2000–2024 was nearly $167.6 million. The largest share, $96.1 million (representing 57.3% of the total penalties), was assessed in food services. Construction accounted for 17.2% of the CMPs assessed at nearly $29 million.
The best solution: Major structural reforms to H-2B that provide a path to permanence for workers
As this report has shown, H-2B workers are underpaid and can only make temporary minor contributions to local economies under the status quo. Meanwhile, employer groups are lobbying furiously to expand the H-2B program by changing the law to allow employers to hire H-2B workers for year-round jobs—despite the rampant wage theft and employer lawbreaking occurring in major H-2B industries.
However, if members of Congress and the Trump administration believe in improving wages and working conditions for all workers, they should send a message to the business community that rather than expanding the deeply flawed H-2B program, a major reform is long overdue and needs to move forward. President Trump and congressional leaders should revamp the H-2B program by providing migrant workers with new protections, fairer wages, and a path to permanent resident status and citizenship. They should also implement reforms that would improve the integrity of the program, for example, by revamping the DOL system for recruitment to ensure that employers make adequate and genuine attempts to recruit and hire U.S. workers for open temporary and seasonal jobs. The administration and Congress should also prohibit lawbreaking employers from being allowed to recruit and hire through the H-2B program.55
In general, legislation should be avoided that proposes to allow employers to hire more temporary H-2B workers or to hire through H-2B for permanent year-round jobs in industries like meatpacking. Instead, any proposed legislation should shift away from the use of temporary workers and create green cards—allowing migrant workers to stay in the United States permanently, increasing their economic contributions and participation in social and political life. That could contribute to stabilizing the workforce for employers and improving wages and working conditions for all workers, regardless of immigration status.56
In terms of federal rulemaking, President Trump already has the legal authority to direct the leadership at the U.S. Department of Homeland Security and the U.S. Department of Labor to implement the many needed reforms through new or updated joint regulations and agency guidance. As of yet, there is no evidence showing that the Trump administration acknowledges the flaws in the H-2B program and that it will make an attempt through the regulatory process to protect U.S. workers employed in H-2B industries or migrant H-2B workers. If the Trump administration decides to propose regulations that would improve labor standards in H-2B industries, they should include, at a minimum:
- the creation of a new registration system at DOL to screen and prohibit employers with a record of violating labor, wage and hour, civil rights, and anti-discrimination laws from hiring through the H-2B program57
- new regulations on wages and worker protections that require employers to pay the highest of the local, state, or national average wage for the specific job, and that end the use of employer-provided wage surveys to set H-2B wage rates
- improvement of the January 2025 final rule that provides H-2B workers with limited portability to change jobs and employers, by increasing transparency for H-2B workers and making it easier for them to leave an abusive employment situation
These executive reforms would ensure that H-2B workers are paid fairly, would help prevent employers with records of violating labor and employment laws from hiring through the H-2B program, and would make it easier for workers to leave an abusive employment situation without losing the ability to earn money for the rest of their authorized employment period in the United States.
Together, congressional and executive reforms could transform a program that brings a temporary, exploitable, and underpaid workforce into one that brings permanent workers with full and equal rights to the United States. These workers would make long-term contributions and investments in local economies across the country, including in rural areas that desperately need them.
Notes
1. Daniel Costa, Temporary Work Visa Programs and the Need for Reform: A Briefing on Program Frameworks, Policy Issues and Fixes, and the Impact of COVID-19, Economic Policy Institute, February 2021.
2. Immigration and Nationality Act of 1952, Section 101(a)(15)(h)(ii).
3. Immigration Reform and Control Act, Section 301(a).
4. Immigration Act of 1990, Section 205(g)(1)(B).
5. See for example, Daniel Costa, “Trump Attacks on Temporary Immigration Protections Like TPS Hurt the Economy and Strip Millions of Their Workplace Rights,” Working Economics Blog (Economic Policy Institute), May 12, 2025.
6. See H.R. 1, 119th Congress (2025–2026); 139 Stat. 72, Pub. L. No. 119-21 (07/04/2025).
7. See for example, Figure 8 and discussion in William H. Frey, Immigration Drives the Nation’s Healthy Post-Pandemic Population Growth, New Census Data Show, The Brookings Institution, January 2025.
8. See Question 6 in Daniel Costa, Josh Bivens, Ben Zipperer, Ismael Cid-Martinez, and Daniel Perez, FAQ: Immigrants and the Economy, Economic Policy Institute, April 15, 2025.
9. Numerous reports, investigations, and government audits have shown this over the years. See for example, Michelle Chen, “These Guestworkers Just Won $20 Million Back from the Company That Trafficked Them,” Nation, October 2, 2015; Jessica Garrison, Ken Bensinger, and Jeremy Singer-Vine, “The New American Slavery: Invited to the U.S., Foreign Workers Find a Nightmare,” BuzzFeed News, July 24, 2015; U.S. Government Accountability Office, H-2A and H-2B Visa Programs: Increased Protections Needed for Foreign Workers, GAO-15-154, reissued May 30, 2017; and Colleen Owens et al., Understanding the Organization, Operation, and Victimization Process of Labor Trafficking in the United States, The Urban Institute, October 2014.
10. Daniel Costa, As the H-2B Visa Program Grows, the Need for Reforms That Protect Workers Is Greater Than Ever: Employers Stole $1.8 Billion from Workers in the Industries That Employed Most H-2B Workers over the Past Two Decades, Economic Policy Institute, August 2022.
11. For a more detailed explanation, see Andorra Bruno, The H-2B Visa and the Statutory Cap (Congressional Research Service, R44306, updated February 28, 2020), 6.
12. Andorra Bruno states that: “DHS determined that 64,716 was the most appropriate maximum number of additional H-2B visas authorized under the special FY2017 provision, this being ‘the number of beneficiaries covered by H-2B returning worker petitions that were approved for FY 2007.’” The H-2B Visa and the Statutory Cap, Congressional Research Service, R44306, updated February 28, 2020.
13. See Amendment 1, an amendment to the fiscal year 2026 House Homeland Security appropriations bill, offered by Reps. Andy Harris, Dan Newhouse, Chuck Edwards, and Henry Cuellar. See discussion in Jennifer Scholtes, “House Appropriators Unite Around Major Visa Changes to Grow H-2A, H-2B Workforce,” PoliticoPro, June 24, 2025.
14. Daniel Costa, As the H-2B Visa Program Grows, the Need for Reforms That Protect Workers Is Greater Than Ever: Employers Stole $1.8 Billion from Workers in the Industries That Employed Most H-2B Workers over the Past Two Decades, Economic Policy Institute, August 2022.
15. If an H-2B worker had an approved petition for a change of employer in the following fiscal year after having an approved petition for new employment, then they should be counted as an individual H-2B worker. However, it is possible that some H-2B workers may have an approved petition for new employment in the same fiscal year as an approved petition for changing employers, which would lead to those workers being counted twice in the data.
16. Approved H-2B petitions for an employment change with the same employer, new concurrent approvals, and amended approvals were excluded from the calculation and totaled 8,444.
17. Authors’ analysis of Office of Foreign Labor Certification, Performance Data, H-2B data file for fiscal year 2024, U.S. Department of Labor.
18. This paragraph largely rests on the work of Calamuci. See David Calamuci, “Return to the Jungle: The Rise and Fall of Meatpacking Work,” New Labor Forum17, no. 1 (Spring 2008): 66–77.
19. Unionization rates cited in this paragraph are authors’ analysis of Current Population Survey Outgoing Rotation Group microdata, EPI Current Population Survey Extracts, Version 2025.6.11, https://microdata.epi.org.
20. David Calamuci, “Return to the Jungle: The Rise and Fall of Meatpacking Work,” New Labor Forum 17, no. 1 (Spring 2008): 66–77.
21. Industry definition changes between 1983 and 2024 make it impossible to match unionization rates exactly over this entire period, but the “meat products” manufacturing sector of 1983 corresponds tightly to the “animal slaughtering and processing” that is measured post-2003.
22. H-2B jobs are sometimes denied certification by the U.S. Department of Labor for that reason. See for example, Rachel Oatman, “Judge Says Smithfield Lacks Documentation for H-2B Certification,” Meat + Poultry, December 7, 2023.
23. See for example, C.J. Miller, “Meat and Poultry Processors Ask Lawmakers to be Included in H-2A Farm Labor Reform,” Hooiser Ag Today, June 1, 2025; Donnelle Eller and Stephen Gruber-Miller, “Iowa’s Largest Pork Producer Urges Year-Round Visas for Foreign Workers to Meet Labor Shortage,” Des Moines Register, July 21, 2021.
24. Tina L. Saitone, K. Aleks Schaefer, Daniel Scheitrum, Shawn Arita, Vince Breneman, Rebecca Nemec Boehm, and Josh G. Maples, “Consolidation and Concentration in U.S. Meat Processing: Updated Measures Using Plant-Level Data,” Review of Industrial Organization 64 (October 2023): 35–56.
25. See Azar, Ionescu, and Steinbaum for evidence that labor market concentration harms workers’ bargaining position, as well as evidence that concentration is much more pronounced in rural areas of the United States. José Azar, Ioana Marinescu, and Marshall Steinbaum, “Labor Market Concentration,” Journal of Human Resources 57, no. S (1 April 2022): 167–199.
26. Authors’ analysis of Current Employment Statistics, Bureau of Labor Statistics, U.S. Department of Labor. The series code for employment in the “animal slaughtering and processing” industry is CES3231160001.
27. Authors’ analysis of data obtained from the U.S. Census data page (data.census.gov), using NAICS code 3116. Estimates of gross state product (GSP) are from the Bureau of Economic Analysis GDP-by-State data program.
28. Tina L. Saitone, K. Aleks Schaefer, Daniel Scheitrum, Shawn Arita, Vince Breneman, Rebecca Nemec Boehm, and Josh G. Maples, “Consolidation and Concentration in U.S. Meat Processing: Updated Measures Using Plant-Level Data,” Review of Industrial Organization 64 (October 2023): 35–56.
29. EPI analysis of Current Population Survey microdata, EPI Current Population Survey Extracts, Version 2025.6.11, https://microdata.epi.org.
30. The foreign-born share of the workforce in meatpacking is likely to be significantly higher, as Angela Stuesse and Nathan Dollar have argued, in part because of the inability of population surveys to adequately reflect what researchers have observed in ethnographic research. See Angela Stuesse and Nathan T. Dollar, “Who Are America’s Meat and Poultry Workers?” Working Economics Blog (Economic Policy Institute), September 24, 2020.
31. Amy Melissa Gass Kandilov, “The Value of a Green Card: Immigrant Wage Increases Following Adjustment to U.S. Permanent Residence,” Unpublished paper, University of Michigan, 2007.
32. Sankar Mukhopadhyay and David Oxborrow, “The Value of an Employment-Based Green Card,” Demography 49 (February 2012): 219–237.
33. Ryan Edwards and Francesc Ortega, “The Economic Contribution of Unauthorized Workers: An Industry Analysis,” National Bureau of Economic Research, Working Paper 22834, November 2016.
34. To calculate this, we first need an estimate of the workforce that would see a clear wage gain from normalization of immigration status. 30% of the animal processing workforce is foreign-born and lacks citizenship. This number is likely higher in meatpacking than poultry processing, but for now we will use it to be conservative. If we assume (also likely conservatively, given qualitative research on this subject) that 5% of the noncitizen workforce in the sector has a green card, this leaves 25% of meatpacking workers who would see a 20% wage increase due to normalization of status. If we multiply the 25% of the workforce that this wage gain would apply to by the 20% increase and then by 75% (which is the share of industry-average wages they earn), this yields the 3.75% stated here.
35. This is calculated by multiplying 3.75% by the estimated 2024 payroll of $30 billion in the industry.
36. Lauren A. Apgar, Authorized Status, Limited Returns: The Labor Market Outcomes of Temporary Mexican Workers, Economic Policy Institute, May 2015.
37. William W. Olney, “Remittances and the Wage Impact of Immigration,” Working Paper, Williams College, 2014.
38. On remittances from the United States, see Ng and Serrano, “A Remittance Tax Would Be Unfair, Regressive, and Contrary to International Commitments, but Would Have Limited Effects and No Significant Impact on the Balance of Payments ,” BBVA Research Note, May 2025. On the overall labor earnings of immigrants in the United States, see Daniel Costa, Josh Bivens, and Ben Zipperer, “Immigration FAQ,” Economic Policy Institute, April 2025.
39. Christian Dustmann and Josep Mestres, “Remittances and Temporary Migration,” Journal of Development Economics 92, no. 1 (May 2010): 62–70.
40. Pia Pinger, “Come Back or Stay? Spend Here or There? Return and Remittances: The Case of Moldova,” International Migration 48, no. 5 (October 2010): 142–173.
41. The overall remittance rate for the United States is roughly 11% ($230 billion in remittances on an immigrant wage bill of $2.1 trillion). Say that half of the foreign-born, noncitizen population of immigrants in the United States can be considered temporary and that this group makes 75% what foreign-born citizens make. This would imply that temporary immigrants account for 10% of the entire immigrant wage bill. Given this information and the fact that temporary immigrants’ remittance rates are 30% higher, we can calculate the remittance rate for permanent immigrants by dividing the overall remittance rate of 11% by the sum of 0.9 and (1.3*0.1), giving a permanent remittance rate of 10.7%. Multiplying by 1.3 gives a temporary remittance rate of 13.9%.
42. This calculation is based on the fact that the current payroll of meatpacking is $30 billion. Because foreign-born workers without permanent legal status constitute 25% of the workforce but make just 75% what other workers do, this implies their share of the overall wage bill is just under 19% (or $5.7 billion). If normalizing status reduces their remittance rate by 3.2% (the difference between the temporary remittance rate of 13.9% and the permanent remittance rate of 10.7% from the previous note), multiplying this by $5.7 billion and then by 1.2 to account for the wage boost from normalization implies $220 million in lower remittances and greater demand for local output.
43. See for example, David J. Bier, “The Facts About H-4 Visas for Spouses of H-1B Workers,” Cato At Liberty Blog (Cato Institute), June 16, 2020.
44. The assumptions on employment rates and wage rates of spouses are likely highly conservative. The employment rate of prime-age immigrants in the United States is closer to 80%, and even assuming all “spouses” of immigrants are female, the gender wage gap for low- to middle-wage workers is well under a third.
45. U.S. Department of Homeland Security and Employment and Training Administration, U.S. Department of Labor, Wage Methodology for the Temporary Non-Agricultural Employment H-2B Program, Final Rule, 80 Fed. Reg. 24146 (April 29, 2015).
46. The amounts in the DOL data used to calculate these average wage rates are based on the lowest hourly wage that employers have been allowed to pay the workers who will fill the H-2B jobs that DOL has certified as demonstrating a legitimate need to hire an H-2B worker.
47. 8 U.S.C. § 1101(a)(15)(H)(ii)(b).
48. See for example, Daniel Costa, “H-2B Crabpickers Are So Important to the Maryland Seafood Industry That They Get Paid $3 Less per Hour Than the State or Local Average Wage,” Working Economics Blog (Economic Policy Institute), May 26, 2017.
49. Authors’ analysis of Office of Foreign Labor Certification, “H-2B Temporary Non-Agricultural Program – Selected Statistics, Fiscal Year (FY) 2024,” Employment and Training Administration, U.S. Department of Labor; and USCIS, “H-2B Employer Data Hub,” U.S. Department of Homeland Security.
50. Wage and Hour Division, “Industries with High Prevalence of H-2B Workers” [data tables for fiscal years 2014–2024], U.S. Department of Labor.
51. Data on file with authors.
52. See, for example, Laura Huizar, Exposing Wage Theft Without Fear: States Must Protect Workers from Retaliation, National Employment Law Project, June 2019; and Susan Ferriss and Joe Yerardi, “As Guest Workers Increase, So Do Concerns About Wage Cheating,” The Center for Public Integrity, March 2, 2022.
53. See for example, Daniel Costa, Josh Bivens, Ben Zipperer, and Monique Morrissey, The U.S. Benefits from Immigration but Policy Reforms Needed to Maximize Gains: Recommendations and a Review of Key Issues to Ensure Fair Wages and Labor Standards for All Workers, Economic Policy Institute, October 2024.
54. Jake Barnes, Janice Fine, Daniel J. Galvin, Jenn Round, and Hana Shepherd, “To Help U.S. Workers, We Need Labor Standards Enforcement, Not Mass Deportations,” Data Brief, Workplace Justice Lab, Rutgers University, May 2025.
55. There are numerous investigative reports detailing examples of employers who have committed egregious violations of the law—breaking labor, employment, and anti-discrimination laws—whom federal agencies have allowed to continue hiring through the H visa programs. See for example, Sam Tabachnik, “Wage Theft, Abuse and Control: How Colorado Farms Take Advantage of Migrant Workers,” Denver Post, September 5, 2024; Teresa Cotsirilos, “The Dark Side of America’s Sheep Industry: Sheepherders Face Wage Theft, Isolation, Hunger and Alleged Abuse.” High Country News, October 2, 2023; Ken Bensinger, Jessica Garrison, and Jeremy Singer-Vine, “Employers Abuse Foreign Workers. U.S. Says, By All Means, Hire More.” BuzzFeed News, May 12, 2016; Ken Bensinger, Jessica Garrison, and Jeremy Singer-Vine, “The Pied Piper Of North Carolina,” BuzzFeed News, December 29, 2015.
56. See for example, Daniel Costa, Josh Bivens, Ben Zipperer, and Monique Morrissey, The U.S. Benefits from Immigration but Policy Reforms Needed to Maximize Gains: Recommendations and a Review of Key Issues to Ensure Fair Wages and Labor Standards for All Workers, Economic Policy Institute, October 2024.
57. See additional discussion in Daniel Costa, As the H-2B Visa Program Grows, the Need for Reforms That Protect Workers Is Greater Than Ever: Employers Stole $1.8 Billion from Workers in the Industries That Employed Most H-2B Workers over the Past Two Decades, Economic Policy Institute, August 2022.