Full Report
South Carolina is experiencing an economic boom with jobs growing rapidly across the state. This boom is substantially being fueled by massive federal investments in the Bipartisan Infrastructure Law (BIL), the Inflation Reduction Act (IRA), and the CHIPS and Science bill (CHIPS) designed to drive job creation, while addressing challenges such as supply chain disruptions and climate change. The White House (2024) announced that as of June 2024, $5.4 billion in public investments and $17.3 billion of private-sector commitments had been made in South Carolina for infrastructure, clean energy, and manufacturing. This includes $2.7 billion for roads and bridges and $234.9 million for public transportation under the BIL. These investments are creating jobs across industries and sectors including manufacturing, clean energy, transportation, and construction.
The data in this report show that over the last several years, job growth across South Carolina has outpaced job growth at the national level. The state also boasts a low unemployment rate. But when we look beyond the headline numbers, we see that many workers across the state are being paid very low wages and family incomes are falling short of what is needed for a modest yet adequate lifestyle. South Carolina’s levels of inequality and poverty rates are high; in 2023, 13.9% of the state’s population fell below the poverty line, compared with a national poverty rate of 12.5%. Workers across the state also lack access to basic resources like paid sick leave and public transportation. Access to these resources would help many would-be workers participate in the labor market more easily.
These outcomes for workers and families reflect, at least in part, the long shadow of worker exploitation that started with the state’s horrific embrace of slavery and what continued to closely resemble slavery after it was outlawed. Today, South Carolina is one of just five states that has no state minimum wage and its workers have some of the lowest typical wages in the country. It is one of two dozen states with so-called right-to-work (RTW) laws that undermine workers’ ability to form unions and contribute to the lowest unionization rate in the country. These and other laws in South Carolina are designed to disempower workers, ensuring that wealthy corporations can continue to exploit their labor.
The state is now being presented with an opportunity to shift its strategy from labor exploitation to worker- and family-centered policies that would strengthen the economy for all South Carolinians. Pro-worker policies that allow more South Carolinians to participate in the labor market, be more productive, and share in the wealth they create are, in fact, pro-business policies that can help sustain the state’s economic growth. The federal funding bills mentioned above include pro-worker policy levers that state policymakers can use to ensure that the jobs being created in South Carolina are good jobs that truly serve workers and families, instead of reinforcing the inequities that have left so many across the state economically insecure.
Disempowered workers, poor job quality, dire poverty, and entrenched racial inequity—historically and today—reflect South Carolina’s historical exploitation of Black workers and families
South Carolina’s economic development strategy is deeply intertwined—perhaps more than any other U.S. state—in the history of slavery. This strategy directly reflects efforts of the wealthy and powerful to continue to extract the labor of freed Black men and women at the lowest cost possible when slavery ended. The result is an economic development model that leaves large swaths of the state’s citizens in poverty and without adequate resources to fully participate in the social and economic life of the state. That history has enduring outcomes for South Carolinians today.
In the colonial era, South Carolina was home to the largest transatlantic slave trade port and the forced labor of enslaved Africans made it the wealthiest colony in the Americas. Kidnapped and enslaved Africans were brought to South Carolina as early as the 16th century. Charleston, SC, was North America’s largest transatlantic slave trade port of entry. Enslaved Africans brought to the colonies were forced to perform treacherous and deadly work on rice, indigo, and cotton plantations, where they were routinely subject to brutal violence, torture, starvation, and lethal diseases.
By 1708, South Carolina was the first British North American colony to have a Black majority (Agbor-Taylor 2022). In 1739, South Carolina was the site of the largest rebellion in the British colonies when the enslaved Black population began marching toward Spanish Florida and fought off an armed militia. They were ultimately defeated by the South Carolina militia. As a result of the Stono Rebellion, South Carolina passed the Negro Act of 1740, which made it illegal for the enslaved Black population to assemble, grow their own food, earn money, or learn to write; the law served as a model for other states. By the time of the Revolutionary War in 1775, enslaved Africans’ knowledge and skilled labor made South Carolina the wealthiest colony in the Americas, and one of the wealthiest regions worldwide (EJI n.d.a; 2022).
By 1860, South Carolina was the only state where enslaved people made up most of the population (Littlefield 2022). That same year, Abraham Lincoln was elected to the presidency on a platform of anti-slavery, and South Carolina became the first state to secede from the union and the site of the first battle of the Civil War. Slavery made South Carolina extremely wealthy—but at an unimaginable cost. Given a majority Black population determined to get free threatened white enslavers’ power, it’s no surprise that the state’s white elite tried desperately—through odious laws, then secession and war—to preserve the institution that had made them rich.
During the post-Civil War era of Reconstruction, Black people made up more than 60% of the voting population in South Carolina. They elected a Black majority to the state legislature and these legislators passed more laws to support freedmen than in any other state. The 1868 Constitution in South Carolina extended voting rights to freed slaves; provided for free public education; abolished debtors’ prisons; established more progressive taxation: and implemented fines for violations of anti-segregation laws (Zinn Education Project n.d.). The reaction of the South Carolina white population to a Black-led state legislature expanding civil, political, and economic rights was swift, violent, and enduring. White supremacist terrorist groups like the Red Shirts, the Ku Klux Klan, and other groups intimidated voters, attacked and murdered freedmen, and orchestrated election fraud on a massive scale to overturn democratically elected officials and restore white rule in South Carolina (Rubin 2016). The white power structure illegitimately elected Wade Hampton III, one of the largest enslavers in the Southeast, as governor and one of South Carolina’s counties bears his name to this day.
States across the South enacted black codes—laws that restricted the rights of freed Black men and women and reinstated significant components of the antebellum slavery system. These laws perpetuated the complete subjugation of Black people and the exploitation of their labor. While these laws were passed in many states across the South, South Carolina’s black codes were among the first and most harsh. As in other Southern states, Black people in South Carolina were prohibited from owning property, attending school, and serving on juries. Under vagrancy laws, those without formal employment could be fined, imprisoned, or subject to forced labor (Zuczek 2016). In South Carolina, additional black codes prohibited Black people from holding any occupation other than farmer or servant without paying a large fee (EJI n.d.b).
In the 1880s, white lawmakers in South Carolina passed some of the nation’s harshest Jim Crow laws, which reinstated segregation; disenfranchised Black voters through poll taxes and other methods; and severely limited the Black population’s access to education, economic opportunity and mobility. As a result of disenfranchisement, poor economic and political conditions, and white supremacist terrorism, hundreds of thousands of Black South Carolinians began fleeing South Carolina (and other Southern states). By 1970, less than one-third of the population of South Carolina was Black (Scott and Rutkoff 2016).
For Black people who remained in or moved to South Carolina, Jim Crow laws maintained their legalized exclusion and subjugation over the next century. For example, during World War I (half a century after Emancipation) the Greenville, SC, city council proposed a vagrancy law requiring Black women to carry proof of employment under threat of imprisonment in response to “complaints” that Black women receiving federal assistance as soldiers’ wives were able to decline employment as domestic workers in white homes (Floyd and Wikle 2024).
As a consequence of such injustice, South Carolinians unwittingly played a fundamental, if sometimes overlooked, role in the Civil Rights Movement’s successful efforts to desegregate public buses, airports, libraries, schools, and other public accommodations (see 1960 New Year’s Day March, the Greenville Eight, Peterson v. City of Greenville, and Briggs v. Elliott). Over a year before Rosa Parks refused to give up her seat on a bus in Montgomery, AL, in December of 1955, Sarah Mae Flemming did the same in Columbia, SC, and was physically assaulted for doing so. The case went all the way to the U.S. Court of Appeals, which struck down segregation on city buses. Though the ruling was widely ignored, it was cited in the much better-publicized Rosa Parks case, which finally marked the end of bus segregation (SC AAHC n.d.).
The exploitation of and complete reliance on the forced labor, skills, and knowledge of Black people; the use of white terror and disenfranchisement to limit Black civil and political power; and the passage of public policies specifically designed to subjugate or exclude Black people—all legacies of slavery—are patterns of racial, economic, and social control that continue to shape the lives of South Carolinians today. The current political and economic system in South Carolina—born from this exploitative system—leaves many South Carolinians with low incomes, high rates of poverty, and limited access to basic necessities, such as housing and transportation that would enhance their security and opportunity.
South Carolina’s economy has diversified over time, but overall output is weak
The health of the economy nationally and in states are impacted by a myriad of factors. State policymakers have little to no control over some of these factors such as federal macroeconomic policy, natural disasters, foreign supply chain disruptions, or global pandemics. Their responses to these events, however, determine how well and how quickly the economy recovers. Below we examine South Carolina’s economy with a special focus on the post-pandemic period and how workers are faring in that economy.
South Carolina’s industrial mix from the antebellum period until today
The industrial composition of South Carolina’s economy has shifted substantially over time, but it continues to be shaped by its history of slavery and the relentless pursuit of free or exploitable labor. This is best exemplified by the state’s textile manufacturing industry, which began to flourish in the mid-1800s. Enslaved Africans were forced to farm the raw materials—namely cotton—on which textile manufacturing depended. South Carolina’s manufacturers were able to siphon off business from manufacturers in New England with the promise of low labor costs and weak labor standards. Wages were as much as 50% lower in South Carolina than in New England, mills were kept running 60 hours or more every week, and 30% of mill workers were children (Carlton 2016). By the mid-1950s, South Carolina’s mills produced more than half the clothing worn in the United States. As exploitative as mill work was, poor white South Carolinians viewed it as preferable to farm work, which was even more difficult and lower-paid.
Through the 1900s, the mills asserted near-complete control over economic and social life for a large share of white South Carolinians. Mills not only housed workers, but they also ran local schools, stores, religious institutions, and recreational activities—in part to “keep their workers close” and quell organized resistance to labor exploitation and dangerous working conditions (WYFF News 4 2022). The economic opportunity and generational wealth building provided by jobs in the mills were largely out of reach for Black South Carolinians. Under state law, Black people were legally excluded from all but the most menial jobs in the textile industry until civil rights lawsuits mandated integration during the mid-1960s (Bainbridge 2018). The textile industry was quicker to integrate than other industries, leading Black employment in the industry to grow significantly through the 1980s. However, Black advancement was curtailed by the passage of the North American Free Trade Agreement in 1992, which facilitated the pursuit of even lower cost labor outside the U.S. over the 1990s and 2000s and ushered in the collapse of South Carolina’s dominance in the industry.
Figure A shows a rapid decline in the number of workers employed in textile mills by the end of the 2000s. It also shows that this rapid decline in the textile industry was followed by rapid growth in another industry: the transportation equipment manufacturing industry, beginning around 2011. Today, what’s left of the textile industry in the state primarily supplies the U.S. military and the automative industry—South Carolina’s new primary manufacturing industry (Holdman 2024).
Transportation equipment manufacturing is growing rapidly across South Carolina while textile manufacturing has fallen: Change in textile and transportation equipment manufacturing in South Carolina, 2001 through 2023
| Year | Textile mills | Textile product mills | Apparel manufacturing | Transportation equipment manufacturing |
|---|---|---|---|---|
| 2001 | 52,226 | 12,334 | 7,999 | 30,847 |
| 2002 | 45,066 | 10,910 | 6,257 | 30,578 |
| 2003 | 40,216 | 9,728 | 5,335 | 31,054 |
| 2004 | 36,106 | 8,764 | 4,565 | 31,963 |
| 2005 | 32,491 | 7,266 | 3,474 | 31,587 |
| 2006 | 27,936 | 6,254 | 3,180 | 31,552 |
| 2007 | 23,127 | 5,497 | 2,942 | 32,537 |
| 2008 | 20,264 | 4,716 | 2,756 | 31,098 |
| 2009 | 15,996 | 3,757 | 1,860 | 25,990 |
| 2010 | 15,069 | 3,855 | 1,451 | 25,387 |
| 2011 | 15,303 | 3,792 | 1,429 | 28,637 |
| 2012 | 14,882 | 3,818 | 1,385 | 32,266 |
| 2013 | 14,525 | 3,815 | 1,347 | 34,529 |
| 2014 | 14,605 | 3,808 | 1,399 | 36,897 |
| 2015 | 14,866 | 3,929 | 1,366 | 39,037 |
| 2016 | 14,926 | 3,988 | 1,007 | 41,259 |
| 2017 | 14,862 | 3,802 | 984 | 43,864 |
| 2018 | 14,881 | 3,418 | 859 | 47,990 |
| 2019 | 14,755 | 3,211 | 854 | 51,452 |
| 2020 | 12,677 | 2,861 | 793 | 47,958 |
| 2021 | 12,715 | 2,939 | 712 | 48,364 |
| 2022 | 12,524 | 2,994 | 740 | 49,462 |
| 2023 | 11,569 | 2,973 | 747 | 51,650 |

Source: EPI tabulation of Bureau of Labor Statistics Quarterly Census of Employment and Wages (BLS-QCEW).
South Carolina’s industrial mix has become much more diverse. Yet, as we show below, it continues to be characterized by the exploitation of workers, strong opposition to worker organizing, subsidies to wealthy corporations, and lax regulation of businesses (Childers 2024a). South Carolina also continues to use this low-road economic development model to lure businesses from other states and countries, contributing to growth across several industries—especially auto, steel, tire, and aircraft manufacturing—as well as the expansion of warehousing, transportation, and logistics, among other sectors (AFL-CIO 2019; Childers 2024b; SCDC 2024a).
Figure B shows job growth across industries in the U.S. and in South Carolina between June 2010 and June 2019, when the state experienced significant job growth. These data reveal that job growth in South Carolina exceeded job growth nationally across almost all industries during this period. Professional and business services experienced the greatest growth at 38.2%, followed by the construction industry (33.3%), leisure and hospitality (30.9%), and manufacturing (25.6%). The growth in manufacturing in the state stands out when compared with an increase of just 11.1% nationally over this period.
Professional business services, construction, and 'leisure and hospitality' grew by more than 30% between 2010 and 2019: Industry growth in South Carolina, 2010–2019
| South Carolina | United States | |
|---|---|---|
| Professional business services | 38.2% | 27.2% |
| Construction | 33.3% | 36.0% |
| Leisure and hospitality | 30.9% | 26.7% |
| Manufacturing | 25.6% | 11.1% |
| Education and health | 22.5% | 21.0% |
| Total nonfarm | 20.8% | 15.6% |
| Trade, transportation, and utilities | 18.5% | 12.8% |
| Financial | 13.9% | 13.8% |
| State and local government | 5.2% | 1.1% |
Source: EPI analysis of Bureau of Labor Statistics State Job Openings and Labor Turnover Survey (JOLTS) data.
South Carolina saw the least growth in state and local government, which grew by just 5.2% from 2010 to 2019, despite a population growth of 10.7% (America Counts 2021). According to the South Carolina Department of Employment and Workforce (SCDEW 2023a, 19), most state and local public-sector workers work at the local level (233,400 in local government compared with 110,000 in state government). These local government workers are public school teachers and staff, police and firefighters, public health care staff, and other municipal employees. A significant number of both state and local government workers are employed in state (50,700 workers) and local educational services (112,400).
Job growth since the COVID-19 pandemic
South Carolina has had strong job growth as the state recovered from the COVID-19 pandemic. Figure C shows the percentage change in jobs for South Carolina and the nation between January 2020 and December 2023. These data show that South Carolina’s job losses during the pandemic were somewhat less than national losses. The data also show that since the recovery got underway, South Carolina and the Southern region had stronger job growth than the nation as a whole. This is not surprising given that across this period, South Carolina was one of the states experiencing the fastest population growth (U.S. Census Bureau 2023; U.S. Census Bureau 2024b).
South Carolina showed stronger job growth than the nation as a whole: Job growth for South Carolina and the United States, 2020 through 2023
| South Carolina | South | United States | |
|---|---|---|---|
| Feb-2020 | 0.4% | 0.5% | 0.4% |
| Mar-2020 | 0.3% | 0.1% | -0.1% |
| Apr-2020 | -12.3% | -11.6% | -13.6% |
| May-2020 | -8.7% | -9.4% | -11.2% |
| Jun-2020 | -5.3% | -7.2% | -8.3% |
| Jul-2020 | -5.6% | -7.4% | -8.2% |
| Aug-2020 | -4.0% | -5.9% | -6.9% |
| Sep-2020 | -3.6% | -5.2% | -5.8% |
| Oct-2020 | -2.2% | -3.7% | -4.4% |
| Nov-2020 | -1.6% | -2.9% | -4.0% |
| Dec-2020 | -1.4% | -2.7% | -4.2% |
| Jan-2021 | -3.3% | -4.2% | -6.0% |
| Feb-2021 | -2.6% | -3.8% | -5.3% |
| Mar-2021 | -2.0% | -3.0% | -4.5% |
| Apr-2021 | -1.4% | -2.3% | -3.5% |
| May-2021 | -0.6% | -1.7% | -2.6% |
| Jun-2021 | -0.4% | -1.6% | -2.1% |
| Jul-2021 | -0.7% | -1.7% | -2.3% |
| Aug-2021 | -0.1% | -0.9% | -1.9% |
| Sep-2021 | -0.2% | -0.7% | -1.5% |
| Oct-2021 | 1.1% | 1.0% | 0.1% |
| Nov-2021 | 1.8% | 1.8% | 0.7% |
| Dec-2021 | 2.1% | 2.1% | 0.8% |
| Jan-2022 | 0.6% | 0.3% | -1.1% |
| Feb-2022 | 1.9% | 1.5% | -0.1% |
| Mar-2022 | 2.1% | 1.8% | 0.4% |
| Apr-2022 | 3.2% | 2.7% | 1.4% |
| May-2022 | 3.8% | 3.1% | 2.0% |
| Jun-2022 | 3.9% | 2.9% | 2.3% |
| Jul-2022 | 3.4% | 2.7% | 1.8% |
| Aug-2022 | 4.4% | 3.7% | 2.4% |
| Sep-2022 | 4.5% | 4.2% | 2.9% |
| Oct-2022 | 4.9% | 4.8% | 3.4% |
| Nov-2022 | 5.4% | 5.5% | 3.8% |
| Dec-2022 | 5.5% | 5.5% | 3.6% |
| Jan-2023 | 4.3% | 4.3% | 2.0% |
| Feb-2023 | 4.8% | 5.0% | 2.6% |
| Mar-2023 | 5.5% | 5.3% | 2.9% |
| Apr-2023 | 5.8% | 5.8% | 3.5% |
| May-2023 | 6.5% | 6.2% | 4.3% |
| Jun-2023 | 6.9% | 6.2% | 4.9% |
| Jul-2023 | 6.2% | 5.0% | 3.5% |
| Aug-2023 | 7.1% | 6.0% | 4.1% |
| Sep-2023 | 7.2% | 6.5% | 4.6% |
| Oct-2023 | 7.8% | 7.1% | 5.0% |
| Nov-2023 | 8.3% | 7.7% | 5.3% |
| Dec-2023 | 8.3% | 7.8% | 5.3% |
Source: EPI tabulation of Bureau of Labor Statistics Quarterly Census of Employment and Wages (BLS-QCEW).
Figure D shows that South Carolina has outperformed on job growth since the pandemic across a range of industries. These data show that the greatest growth since 2019 has been in the financial sector, which includes not just finance but also insurance, real estate, and rental and leasing, reflecting in part the growth in population across the state. Education and health (15.9%) and trade, transportation, and utilities (10.1%) both experienced greater than 10% growth. The industries with the least growth over this period were manufacturing (4.3%) and state and local governments (1.3%).
The fastest growing industries post-pandemic far outpaced national growth in these industries: Industry growth in South Carolina and the U.S., 2019–2024
| South Carolina | United States | |
|---|---|---|
| Financial | 18.9% | 5.7% |
| Education and health | 15.9% | 9.2% |
| Trade, transportation, and utilities | 10.1% | 5.0% |
| Professional business services | 9.2% | 7.4% |
| Total nonfarm | 8.6% | 5.2% |
| Construction | 8.1% | 9.9% |
| Leisure and hospitality | 7.8% | 2.4% |
| Manufacturing | 4.3% | 1.0% |
| State and local government | 1.3% | 3.0% |
Source: EPI analysis of Bureau of Labor Statistics Current Employment Statistics Establishment Survey (BLS-CES).
In many ways, South Carolina’s strong growth across industries in recent years served to diversify South Carolina’s economy and bring its industry mix more in line with the national economy. Figure E shows the share of South Carolina workers employed in each industry across the state in 2024. The single largest sector is trade, transportation, and utilities, which employs 18.9% of the workforce—almost one in five workers. This is just slightly more than the national average (18.3%). The largest individual subsector of the trade, transportation, and utilities industry in South Carolina is transportation and warehousing, which made up 20.6% of the industry as of December 2023 (SCDEW 2023a, 19). In addition to transportation and warehouse jobs, this industry further includes utilities, wholesale trade, and retail trade (including motor vehicle and parts dealers, food and beverage stores, clothing and clothing accessories stores, and general merchandise stores).
Almost one in five nonfarm jobs in South Carolina are in the trade, transportation, and utilities sector: South Carolina employment by industry, 2024
| South Carolina | United States | |
|---|---|---|
| Trade, transportation, and utilities | 18.9% | 18.3% |
| Professional business services | 13.6% | 14.5% |
| Education and health | 12.5% | 16.6% |
| Leisure hospitality | 12.2% | 10.7% |
| Manufacturing | 11.3% | 8.2% |
| Financial | 5.2% | 5.8% |
| Construction | 4.9% | 5.2% |
| State and local government | 14.4% | 12.8% |
Source: EPI analysis of Bureau of Labor Statistics Current Employment Statistics Establishment Survey (BLS-CES).
While state and local government experienced little growth since 2010, the public sector makes up the second largest sector of the state’s economy. The public sector includes workers who perform a range of important tasks for South Carolinians. Many of these workers are critical to maintaining public order, safety, and providing key services as teachers, police officers, firefighters, garbage collectors, bus drivers, and many other critical roles.
Despite strong job growth, the financial and the construction industries respectively make up just 5.2% and 4.9% of South Carolina’s economy. Their share of the state’s economy closely resembles their share of the total U.S. economy—5.8% and 5.2%, respectively.
Notably, despite strong growth in education and health, these industries account for a far smaller share of jobs in the state than the national average: 12.5% and 16.6% respectively. This may be indicative of the fact that South Carolina is one of only 10 states that has failed to adopt the Medicaid expansion under the Affordable Care Act, depriving the state’s health care industry of billions of dollars of federal funds and its residents of a key resource for health care (KFF 2024).1 It is also likely a reason the state is ranked 39th in education quality and 46th in health outcomes for children in the Annie E. Casey Foundation’s 2024 Kids Count Databook. As described in fuller detail later, a large swath of 17 mostly poor, rural counties in South Carolina have been dubbed the state’s “Corridor of Shame” because they have failed to provide students in those counties with even a “minimally adequate” education (Click and Hinshaw 2015; Temoney and Ullrich 2018).
Finally, while the data in Figure E are for nonfarm workers, the South Carolina Farm Bureau (n.d.) reports that agribusiness is actually South Carolina’s largest economic sector, contributing just under $42 billion to the economy and employing more than 200,000 workers. That means agribusiness is about 9% of all employment in the state.2 The largest industry sector within agriculture is poultry processing, production, and other poultry-related products (Von Nessen 2022). Non-poultry meat and beef production are also among the top agricultural sectors .
Black and brown South Carolinians make up a large segment of these workers. Black South Carolinians, for example, make up 26% of the population in the state but are 37.1% of all food production workers and 63.5% of animal slaughter workers. Hispanic workers are just 7.5% of the population but are 11.7% of all food production workers (U.S. Census Bureau 2024a).3
Finally, immigrant workers, including those who are undocumented, make up 11.7% of the food production workforce. In 2023, South Carolina was one of the top five states for H-2A visas—visas that allow migrant workers to come into the U.S. on a temporary basis, often to fill jobs Americans don’t want to do. These workers constitute a pool of labor with few protections, making them easy to exploit (Atkinson 2024).
Low-wage service and retail workers
Some of South Carolina’s lowest-wage workers work in food services, retail, and hospitality. With low rates of unionization and very low minimum wages for both tipped and non-tipped workers, these workers often lack the bargaining power to demand better pay and working conditions. As a result, service and retail workers regularly deal with low wages, limited benefits, and serious safety concerns in the workplace.
The median hourly wage of food industry workers in 2023 was $12.95. The lowest paid positions were bartenders and waiters/waitresses, whose median 2023 hourly wages were $8.95 and $8.98 respectively. This number includes tips. Because South Carolina has no state minimum wage for tipped or non-tipped workers, the federal minimum wage applies. Thus, for these workers who receive tips, employers only have to pay the federal minimum subminimum wage of $2.13, forcing these workers to rely on tips from customers for the majority of their income.
But even with tips, many workers are unable to afford basic goods and services. Figure F shows the median annual earnings for full-time workers in each of the occupations in the figure. These data show that a full-time waiter or waitress making $8.98 an hour earns just $18,680 annually. To provide context for these wages, we used EPI’s Family Budget Calculator to estimate the amount of income it would take for a single adult with no children to afford a modest yet adequate standard of living in each of the four largest metro areas in South Carolina. These data show that none of these occupations pay workers enough to reach even this low standard.
Service and retail works paid too little for a modest standard of living across South Carolina: Median annual wage compared with estimated cost of living in selected major metro areas, 2023
| Occupation/Metro area | Wage or Salary |
|---|---|
| Food service, general | $26,930 |
| Bartenders | $18,610 |
| Waiters and waitresses | $18,680 |
| Hotel housekeeping staff | $28,660 |
| Hotel desk clerks | $28,610 |
| Retail salespersons | $28,900 |
| Greenville-Mauldin-Easley | $45,267 |
| Myrtle Beach-Conway | $46,117 |
| Columbia | $46,916 |
| Charleston-North Charleston | $54,929 |
Note: Annual estimated cost of living for each metro area are for a single adult with no children. Myrtle Beach-Conway includes North Myrtle Beach. Title shortened to fit graph.
Source: Author’s analysis of May 2023 Bureau of Labor Statistics Occupational Employment and Wage Statistics (BLS-OEWS) and the EPI Family Budget Calculator.
Figure F also shows the median annual earnings of some key hospitality occupations. Tourism is a key industry in South Carolina, as shown in Figure E. The South Carolina Department of Parks, Recreation, and Tourism says one in 10 South Carolinians work in hospitality, supporting over 200,000 jobs. In places like Myrtle Beach, tourism is the largest sector of the economy (Perez 2024). Many of those who work in hospitality, however, don’t make enough to live in these communities. The median wage for hotel desk clerk is just $28,610 a year. The estimated cost of living to have modest economic security in Myrtle Beach for a single adult with no children, however, is $46,117. For those workers trying to support families, the economic strain is even greater.
Finally, Figure F shows that retail salespersons are also paid very low wages. These workers are paid a median wage of just $13.89 or $28,900 per year. Like many service and hospitality workers, retail workers face employers who show little regard for their safety and health (Sainato 2023; Vasquez 2023). Dollar General, for example, has the largest number of retail stores of any retail chain in the nation with over 18,000 stores in 47 states (Sainato 2023). MacGillis (2020) reports high rates of violence and deaths at Dollar General stores and Dollar Stores more generally. While there are multiple factors contributing to this, understaffing and disarray within and outside the store are noted as key factors making these stores targets for robberies and other crimes. In 2022, the federal Occupational Safety and Health Administration (OSHA) proposed adding $3.4 million in fines to the over $21 million in fines that had been proposed since 2017 after inspecting nine Dollar General locations in four states. These fines were for blocked emergency exits, fire extinguishers, and electrical panels. Boxes and materials were stacked unsafely, causing fire and crushing hazards and blocking the ability of employees to exit in emergencies. In one store, OSHA reported at least six employees had been exposed to toxic vapors with three seeking medical treatment. OSHA found that Dollar General had not provided workers with adequate respiratory protection or personal protective equipment, and they failed to train workers how to safely handle hazardous chemicals and how to properly clean them up (DOL OSHA 2023).
In many of these cases, federal OSHA officials can step in, as noted above. South Carolina, however, is one of 22 states in the country where state government is responsible for enforcing OSHA standards, rather than falling directly under the enforcement authority of federal OSHA. South Carolina has been approved to run its own operations and oversight as long as it is “at least as effective as OSHA in protecting workers and in preventing work-related injuries, illnesses and deaths” (DOL OSHA n.d.). There is some concern that South Carolina is not meeting this standard. The Service Employees International Union (SEIU) reported that in 2022, South Carolina’s Department of Labor, Licensing & Regulation had an OSHA inspection rate less than one-third that of neighboring states—where South Carolina conducted an average of 1.9 inspections per 1,000 establishments, North Carolina, Tennessee, and Virginia’s rates were respectively 6.2, 7.8, and 6.2 inspections per 1,000 establishments. These states also have state plans (DOL OSHA n.d.).
Additionally, South Carolina refuses to enforce sufficient consequences for businesses who violate OSHA standards. The state’s OSHA office levied an average penalty of $2,019 for violations across the private sector, a number significantly below the national average of $3,259 for serious violations (SEIU 2023). Fewer inspections and weaker fines mean employers feel empowered to commit more violations and continue to exploit vulnerable workers with impunity.
Yet despite the imbalance of power between workers and employers, workers at a Dollar General in Irmo, SC, went on strike in January 2023. They cited many of the safety concerns reported in media and that federal OSHA officials found in Dollar General stores in other states: mold, extreme heat, dangerous exposure to improperly stored chemicals, and unpaid wages (Martinez 2023). This strike was led by workers under the newly formed Union of Southern Service Workers.
Job growth was industrially diverse, but geographically concentrated
Although spread across a range of industries, South Carolina’s job growth was highly concentrated in major metropolitan areas. Table 1 shows that of the 174,264 jobs created between January 2020 and December 2023, 89.4% (or more than 155,000) were located in eight metropolitan areas of the state. Most of these jobs were located in just four metro areas: Charleston-North Charleston (45,750), Greenville-Anderson-Greer (38,795), Myrtle Beach-Conway-North Myrtle Beach (25,870), and Columbia (24,961), four of the state’s largest metro areas. The remaining four metro areas received less than 5% of all jobs.
Number and share of new jobs and population in the state and in major metro areas
| 2020 to 2023 change in # of jobs | Percent of all jobs | Total # of jobs | 2023 total population | |
|---|---|---|---|---|
| South Carolina | 174,264 | 100.0% | 2,279,240 | 5,373,555 |
| Jobs to major metro areas | 155,742 | 89.4% | 1,734,146 | — |
| Charleston-North Charleston | 45,750 | 26.3% | 377,505 | 849,417 |
| Greenville-Anderson-Greer | 38,795 | 22.3% | 422,681 | 975,480 |
| Myrtle Beach-Conway-North Myrtle Beach | 25,870 | 14.8% | 180,703 | 397,478 |
| Columbia | 24,961 | 14.3% | 387,818 | 856,889 |
| Spartanburg | 7,918 | 4.5% | 159,832 | 383,327 |
| Hilton Head Island-Bluffton-Port Royal | 7,408 | 4.3% | 81,814 | 232,523 |
| Florence | 5,103 | 2.9% | 88,217 | 199,630 |
| Sumter | -63 | 0.0% | 35,576 | 104,165 |
| Percent of population outside these metro areas | — | — | — | 1,374,646
(25.6%) |
| Percent of population outside metro areas receiving more than 5% of all new jobs | — | — | — | 2,294,291
(42.7%) |
Note: New jobs are for January 2020 through December 2023.
Source: Job numbers are from EPI analysis of Bureau of Labor Statistics Quarterly Census of Employment and Wages (BLS-QCEW), Annual Average. Population based on author's analysis of Census Bureau's American Community Survey table DP05.
When we consider the distribution of the population, the geographic concentration of this job growth becomes even more stark—and potentially more problematic. More than four in 10 (42.7%) South Carolinians live outside of the top four metro areas that have collectively received more than 77% of all new jobs. More than one in four (25.6%) live outside the eight metro areas shown in Table 1. The uneven distribution of new jobs means that South Carolinians in other areas and those in more rural parts of the state will have less opportunity to benefit from this job growth. One reason is that those outside the major metropolitan areas may not have the same access to information about available new jobs, computers or broadband commonly needed to apply for many jobs, or transportation to reach these jobs. They will also incur greater costs in terms of transportation and commuting time if they are able to fill these jobs.
While South Carolina has experienced strong job growth and the state’s industrial composition has diversified, the state’s per capita gross domestic product (GDP) remains among the lowest in the nation. The GDP per capita is the total value of goods and services produced by the state’s economy, divided by the number of people. GDP grows primarily when the demand for goods and services increases and when government and businesses invest in the state. These might be investments in machinery, technology, or public infrastructure, all of which make workers and businesses more productive. Or they could be investments in workers’ education, training, and compensation, improving workers’ skills and ensuring that they have the resources to afford their basic needs and the ability to balance work and family demands.
Figure G shows the GDP for the U.S. and the 10 states with the lowest per capita GDPs in the nation. Only four states—Alabama, Arkansas, West Virginia, and Mississippi—have a lower GDP than South Carolina.
Just four states have a lower per capita GDP than South Carolina: Per capita GDP for the U.S. and 10 states with the lowest GDP, 2023
| 2023 per capita GDP | |
|---|---|
| United States | $81,624 |
| Oklahoma | $62,690 |
| Montana | $62,287 |
| New Mexico | $61,580 |
| Kentucky | $61,365 |
| Idaho | $60,462 |
| South Carolina | $59,971 |
| Alabama | $58,756 |
| Arkansas | $57,450 |
| West Virginia | $56,219 |
| Mississippi | $49,802 |
Source: EPI analysis of the Bureau of Economic Analysis (BEA) national and state GDP data.
Workers’ engagement with the labor market across the Palmetto state
The data above show that South Carolina has had strong job growth across industries that have diversified rapidly over the last decade and a half. The state’s low per capita GDP, however, may be an indicator of weakness in the labor market. Below, we examine workers’ engagement with South Carolina’s labor market.
Unemployment
The first indicator we examine is the unemployment rate. The unemployment rate is the share of people in the labor market without a job who are actively looking for work. In 2020, the COVID-19 pandemic swept across the nation and many “non-essential” businesses closed their doors as people isolated in their homes. This led to the COVID-19-induced recession with a dramatic rise in unemployment. Figure H shows that while unemployment rose considerably nationally and in South Carolina, both peaked in April 2020 at 14.8% and 11.8% respectively. These data also show the unemployment rate in South Carolina consistently remained below the national average. As of June 2024, South Carolina had an unemployment rate of 3.6%, up slightly from the 3.2% in April.
South Carolina's unemployment rate is consistently below the national rate: Unemployment rate for South Carolina and the nation, 2020–2024
| South Carolina | United States | |
|---|---|---|
| Jan-2020 | 2.8% | 3.6% |
| Feb-2020 | 2.9% | 3.5% |
| Mar-2020 | 3.1% | 4.4% |
| Apr-2020 | 11.8% | 14.8% |
| May-2020 | 9.2% | 13.2% |
| Jun-2020 | 7.8% | 11.0% |
| Jul-2020 | 7.0% | 10.2% |
| Aug-2020 | 6.1% | 8.4% |
| Sep-2020 | 5.8% | 7.8% |
| Oct-2020 | 5.3% | 6.8% |
| Nov-2020 | 5.0% | 6.7% |
| Dec-2020 | 4.8% | 6.7% |
| Jan-2021 | 4.6% | 6.4% |
| Feb-2021 | 4.4% | 6.2% |
| Mar-2021 | 4.3% | 6.1% |
| Apr-2021 | 4.2% | 6.1% |
| May-2021 | 4.1% | 5.8% |
| Jun-2021 | 4.1% | 5.9% |
| Jul-2021 | 3.9% | 5.4% |
| Aug-2021 | 3.8% | 5.1% |
| Sep-2021 | 3.7% | 4.7% |
| Oct-2021 | 3.5% | 4.5% |
| Nov-2021 | 3.4% | 4.1% |
| Dec-2021 | 3.3% | 3.9% |
| Jan-2022 | 3.3% | 4.0% |
| Feb-2022 | 3.2% | 3.8% |
| Mar-2022 | 3.2% | 3.6% |
| Apr-2022 | 3.2% | 3.7% |
| May-2022 | 3.2% | 3.6% |
| Jun-2022 | 3.2% | 3.6% |
| Jul-2022 | 3.2% | 3.5% |
| Aug-2022 | 3.2% | 3.6% |
| Sep-2022 | 3.3% | 3.5% |
| Oct-2022 | 3.2% | 3.6% |
| Nov-2022 | 3.2% | 3.6% |
| Dec-2022 | 3.1% | 3.5% |
| Jan-2023 | 3.1% | 3.4% |
| Feb-2023 | 3.0% | 3.6% |
| Mar-2023 | 3.0% | 3.5% |
| Apr-2023 | 2.9% | 3.4% |
| May-2023 | 2.9% | 3.7% |
| Jun-2023 | 2.8% | 3.6% |
| Jul-2023 | 2.8% | 3.5% |
| Aug-2023 | 2.9% | 3.8% |
| Sep-2023 | 3.0% | 3.8% |
| Oct-2023 | 3.0% | 3.8% |
| Nov-2023 | 3.0% | 3.7% |
| Dec-2023 | 3.0% | 3.7% |
| Jan-2024 | 3.0% | 3.7% |
| Feb-2024 | 3.1% | 3.9% |
| Mar-2024 | 3.1% | 3.8% |
| Apr-2024 | 3.2% | 3.9% |
| May-2024 | 3.4% | 4.0% |
| Jun-2024 | 3.6% | 4.1% |
Source: EPI compilation of the Bureau of Labor Statistics’ Local Area Unemployment Statistics (BLS-LAUS).
The benefits of low unemployment did not extend to all South Carolinians equally. Figure I shows annual unemployment rates for Black and white workers nationally and in the state of South Carolina from 2019 through 2023. Black and white workers in South Carolina have lower rates of unemployment than nationally and the disparities between them are smaller. The unemployment rate for white workers in South Carolina fell below the pre-recession rate by 2023, while Black workers’ unemployment rate was still above pre-recession levels in 2023.
Unemployment rates for Black South Carolinians have not reached pre-recession levels: Unemployment rates by race, 2019, 2020, and 2023
| 2019 | 2020 | 2023 | ||
|---|---|---|---|---|
| South Carolina | White | 2.4% | 5.1% | 2.3% |
| Black | 3.9% | 9.2% | 4.8% | |
| United States | White | 3.0% | 6.5% | 2.9% |
| Black | 6.1% | 11.5% | 5.7% |
Note: Sample sizes too small to calculate unemployment rates for other racial or ethnic groups.
Source: EPI analysis of the Current Population Survey (CPS) microdata from the U.S. Census Bureau.
While the annualized data in Figure I show Black unemployment had not dropped below the pre-recession level in 2023, more recent data show that both Black and white unemployment may be increasing—with a much larger increase for Black workers. Figure J shows the unemployment rate for Black, Hispanic, and white workers over the last two quarters of 2023 and the first two quarters of 2024. These data show a slight increase of 0.2 percentage points in unemployment for white workers between the first and second quarter of 2024. Black (0.9 percentage points) and Hispanic (0.5 percentage points) South Carolinians have had larger increases.
Unemployment rates are rising across South Carolina: Unemployment rates by race and ethnicity, 2023–2024
| White | Black | Hispanic | |
|---|---|---|---|
| 2023 Q3 | 2.1% | 5.2% | 3.7% |
| 2023 Q4 | 2.2% | 4.6% | 3.8% |
| 2024 Q1 | 2.2% | 4.7% | 3.8% |
| 2024 Q2 | 2.4% | 5.6% | 4.3% |
Source: Moore 2024, unemployment by race and ethnicity.
As of mid-2024, overall unemployment was lower in South Carolina than in the nation as a whole and racial disparities were smaller but substantial. Still, unemployment for Black workers in South Carolina was still above its pre-recession rate, while unemployment for white workers was lower than before the pandemic.
Employment as a share of the population
Rapid job growth across the state and low levels of unemployment may indicate that South Carolina’s economy is strong, but data on employment rates challenge this notion. Figure K shows the employment-to-population ratio (EPOP) for prime-age workers (ages 25–54) in both 2019 and 2023. We exclude workers younger than 25 and older than 54 because many of these younger workers may be out of the labor force completing their education or gaining additional skills and some workers 55 and older may have retired early.
South Carolina lags the South and the U.S. in prime-age employment: Prime-age EPOP for South Carolina, the South, and the U.S., 2019 and 2023
| 2019 | 2023 | |
|---|---|---|
| South Carolina | 78.8% | 78.7% |
| South | 79.0% | 79.8% |
| United States | 80.0% | 80.7% |
Source: EPI analysis of Current Population Survey (CPS) microdata from the U.S. Census Bureau.
These data show that in 2019, before the pandemic, there was little difference in the EPOPs for South Carolina and the South more broadly at 78.8% and 79.0% respectively. The EPOP nationally was higher at 80%. From 2019 to 2023, the employment rate among prime-age workers rose from 80.0% to 80.7% nationally and from 79.0% to 79.8% in the South. In South Carolina, however, it remained essentially flat falling from 78.8% to 78.7%, widening the gap with the broader region and the nation. In 2019, South Carolina’s prime-age employment rate was 39th out of 50 states plus D.C.; by 2023, it had fallen to 42nd.
When we examine prime-age EPOPs by race and ethnicity, the data show significant disparities. Figure L shows prime-age EPOPs by race, ethnicity, and gender for South Carolina and the nation. These data show that across racial and ethnic groups, women are less likely to be employed—with the lowest employment rate among Hispanic women (61.1%), followed by Black women (73.9%). White women have the highest employment among South Carolina’s women (76.7%) but still lag behind women nationally.
White men and Black and Hispanic women have lower EPOPs in South Carolina than nationally: Prime-age EPOPs by race, ethnicity, gender, and geography, 2023
| South Carolina | United States | ||
|---|---|---|---|
| White | Female | 76.7% | 77.6% |
| Male | 84.3% | 87.5% | |
| Black | Female | 73.9% | 75.8% |
| Male | 80.5% | 79.8% | |
| Hispanic | Female | 61.1% | 68.7% |
| Male | 86.9% | 86.7% |
Source: EPI analysis of the Current Population Survey (CPS) microdata from the U.S. Census Bureau.
These data also show that most groups of workers in South Carolina—white men, white women, Black women, and Hispanic women in particular—are less likely to be employed than their counterparts nationally.4 In contrast, Black and Hispanic men in the state are just slightly more likely to be employed compared with their counterparts nationally.
These data in the context of strong job growth and low unemployment rates in the state suggest that many South Carolinians experience significant barriers to employment. The Bureau of Labor Statistics (2024) tracks the number of unemployed people—those looking for a job—compared with the number of job openings in their Job Openings and Labor Turnover survey (JOLTS). This ratio in South Carolina was 0.5 in May 2024. This means that there were twice as many job openings as there were people looking for a job. In the following sections, we discuss some of the likely barriers keeping would-be workers out of the labor market.
Despite job growth exceeding national rates, a lack of worker power means the strong labor market fails to translate into wage growth for workers
Wages and economic insecurity
One likely reason that many jobless South Carolinians are not actively looking for work is poor job quality (Millan Chicago LLC 2022). In other words, the available jobs do not provide adequate wages for workers to support themselves and their families and lack basic benefits, such as paid sick leave or paid family and medical leave. As discussed above, poor job quality has long been a fixture of South Carolina’s economy.
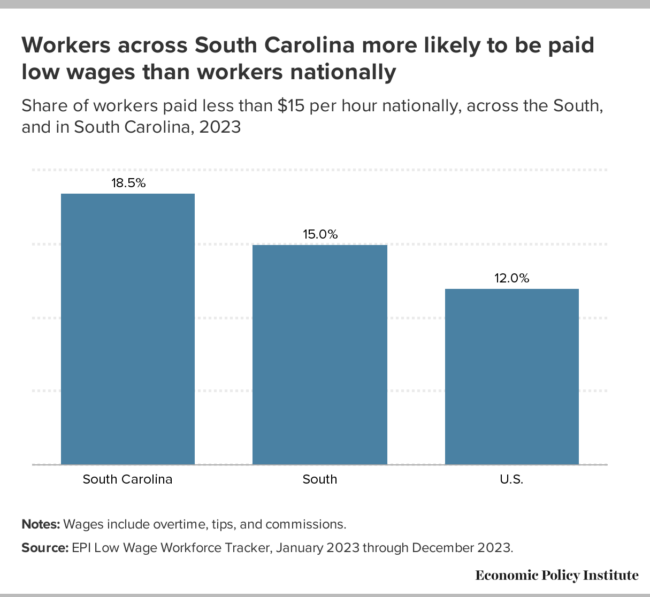
First, many working South Carolinians are paid exceptionally low wages. Figure M shows the share of workers that are paid less than $15 per hour nationally, across the South and in South Carolina. These data show that 18.5% of South Carolinians (almost one in five) are paid less than $15 per hour compared with 15% across the South and 12% nationally.
Workers across South Carolina more likely to be paid low wages than workers nationally: Share of workers paid less than $15 per hour nationally, across the South, and in South Carolina, 2023
| Low wage share | |
|---|---|
| South Carolina | 18.5% |
| South | 15.0% |
| U.S. | 12.0% |
Notes: Wages include overtime, tips, and commissions.
Source: EPI Low Wage Workforce Tracker, January 2023 through December 2023.
Figure N shows the median wage—i.e., the wage of a worker paid more than 50% of all other workers in the economy and less than the other half—for workers nationally, across the South, and for South Carolina in 2019 and 2023 (in constant 2023 dollars). While the South generally has lower wages than other regions of the country, these data show that in 2023, middle-class workers in South Carolina were paid even less than their peers in the region—$22.46 per hour compared with $22.57. When compared with workers’ wages nationally, the typical (median) South Carolina worker was paid considerably less—$1.52 less per hour.
Workers in South Carolina paid less than workers across the South and workers nationally: Median hourly wages for South Carolina, the South, and the U.S., 2023
| 2019 | 2023 | |
|---|---|---|
| South Carolina | $22.29 | $22.46 |
| South | $22.18 | $22.57 |
| United States | $23.11 | $23.98 |
Source: EPI analysis of Current Population Survey microdata.
These data also show that while wages have risen for workers across each geography since 2019, workers in South Carolina saw the smallest increase. The typical worker in South Carolina saw their wages rise by just $0.17 (0.8%) per hour over the four-year period, despite exceptionally strong job growth and many employers reporting they were unable to find enough workers (Bivens 2024; Green 2023). Workers across the South saw a larger increase of $0.39 (1.8%), but workers nationally saw an increase more than five times greater than in South Carolina at $0.87 (3.8%) per hour.
It is particularly remarkable that even as South Carolina’s job growth outpaced the rest of the region and the country, overall wage growth in the state remained tepid. This underscores how unbalanced South Carolina labor market is, and how policies have stacked the deck against the state’s workers.
Raising wages would strengthen the state’s economy and bring workers back into the labor market. A key reason that wages are lower in South Carolina is that it does not have a state minimum wage. This means that for most workers in South Carolina (and the other four states without a minimum wage5) the federal minimum of $7.25 applies.6 And those not covered by the federal minimum wage can be paid even less. The lack of a suitable floor on wages means that workers in the state can have some of the lowest wages in the country, holding down wages for workers higher up the wage scale. An analysis by the Economic Policy Institute showed that raising the minimum wage to $17 would lift the wages of 584,000 workers in South Carolina alone, including 220,000 workers who would be earning above the minimum (Zipperer 2023).7
Voters and lawmakers in most states have recognized that a $7.25 minimum wage is too low for workers to support themselves and their families, which is why more than half of all states have set their minimum wage above the federal minimum. The failure to make any effort to raise the lowest wages in South Carolina reflects state lawmakers embracing the Southern economic development model that relies heavily on low wages for workers (Childers 2024a).
Auto manufacturing jobs are growing in South Carolina, but their wages are falling
A substantial contributor to South Carolina’s strong job growth in recent years is the rapidly growing auto and auto parts manufacturing sector. The state boasts a range of auto manufacturing, auto suppliers, and auto parts manufacturing companies moving into the state or expanding their operations. These companies include BMW, Michelin, Giti Tire, Mercedes-Benz, Honda, and Volvo (SCDC 2024a; SCDEW 2023b, 4). The South Carolina Department of Employment and Workforce (SCDEW 2023b, 5) reports South Carolina ranks third overall in exports across their auto manufacturing industry with over $12 billion in sales in 2022. The state is also number one in exports of tires (Carroll 2024; SCDC 2021).
Figure O shows the number of auto manufacturing jobs has grown more than 63% over the past decade in South Carolina, increasing from 23,207 jobs in 2013 to 37,838 in 2023. While auto manufacturing jobs fell from 2019 to 2020 during the COVID-19 pandemic and related recession, these data show a steady increase in auto manufacturing jobs in each subsequent year.
Auto manufacturing jobs in South Carolina show steady growth: Auto manufacturing jobs, 2013–2023
| Total Auto Manufacturing | |
|---|---|
| 2013 | 23,207 |
| 2014 | 25,240 |
| 2015 | 26,883 |
| 2016 | 28,253 |
| 2017 | 30,775 |
| 2018 | 34,996 |
| 2019 | 38,182 |
| 2020 | 35,587 |
| 2021 | 36,732 |
| 2022 | 37,201 |
| 2023 | 37,838 |
Source: EPI analysis of the Bureau of Labor Statistics Quarterly Census of Employment and Wages (BLS-QCEW) for NAICS 3361, 3362, and 3363.
These numbers only include jobs in the actual manufacturing of autos and auto parts; they do not include the many other jobs required in these sectors or the jobs that are created up and down the supply chain. For example, BMW’s Spartanburg plant employs more than 11,000 people, including many who may not directly work in auto parts production (Carroll 2024; SCDEW 2023b).
There are multiple reasons auto manufacturing jobs are increasingly locating in the South generally, and in South Carolina, in particular (see Childers 2024b for trends in job growth by region). First, the Inflation Reduction Act (IRA) incentivizes automobile and parts manufacturers to make their cars, batteries, and electric vehicles in the U.S., as opposed to in a foreign country. Since the passage of the IRA, nationally there has been $110 billion in capital investments announced for electric vehicle manufacturing alone (Carroll 2024).
Within the U.S., there are several reasons corporations specifically choose South Carolina. The state provides auto and auto parts manufacturers with massive subsidies to locate in the state. Volkswagen’s Scout Motors, for example, received $1.29 billion in state incentives and up to $180 million in job development tax credits to build their plant in the state (Shepardson 2023; Udavant 2023). The subsidies provided to automakers can include subsidies for infrastructure such as the construction of facilities and transportation systems. They can also provide state funding for employee training and even for employees’ wages (AFL-CIO 2019).
Because the massive subsidies provided to auto and auto parts manufacturing companies have not been coupled with requirements that workers and local communities also benefit from the new projects and facilities, these economic development projects may bring jobs, but they also could bring real harm to workers and communities. In the simplest sense, these subsidies divert funds away from the provision of public goods and services (such as public schools, roads, and health care) and instead give those dollars to large, multinational corporations and their shareholders. For example, South Carolina’s public schools report the highest total tax abatement revenue losses of any state in the country (Wen 2022). In fiscal year 2021, for example, $534 million that would have gone to South Carolina public schools, a school system already facing a major K-12 funding crisis, was lost to tax abatements. Further, public school losses to abatements have been increasing each year and some of the largest increases are in poor districts and districts with larger numbers of students of color including Chester, Dillon, Lee, and Richland (Wen 2022).
South Carolina also has corporation-friendly tax policies that further allow large national and international corporations to maximize their profits at the expense of workers and local communities. The South Carolina Department of Commerce (SCDC 2024b) notes the state’s 5% corporate tax rate is the lowest in the Southeast. It also reports ways for corporations to further lower their tax rate including a job tax credit, which eliminates up to 50% of their tax liability over multiple years.
Finally, South Carolina has the lowest union coverage rate of any state. According to Carroll (2024), 85% of the $110 billion in capital investments into EVs went to so-called right-to-work states where union coverage rates are lower (Sherer and Gould 2024). Data show that lower union coverage rates are associated with lower wages for workers (Banerjee et al. 2021). While auto manufacturing jobs in South Carolina pay more than many other jobs in the state, they are paid considerably less than their counterparts in Midwestern states (Childers 2024b).
Table 2 shows the median hourly wage for the three industries that make up auto manufacturing in the ten largest auto manufacturing states. These data show that auto manufacturing workers in South Carolina don’t have the lowest wages of the top ten states, but they are lower than in many of the states in the Midwest and West, especially Michigan, Illinois, and California. Motor vehicle body and trailer manufacturing workers, however, face a substantially lower wage than their counterparts across all other states except Tennessee.
Median wages for auto manufacturing wages by industry sector, 2023
| Motor vehicle manufacturing | Motor vehicle body and trailer manufacturing | Motor vehicle parts manufacturing | |||
|---|---|---|---|---|---|
| Tennessee | $26.00 | Tennessee | $19.35 | Alabama | $19.73 |
| Alabama | $27.87 | South Carolina | $19.70 | Texas | $20.63 |
| Kentucky | $29.07 | Alabama | $20.33 | Tennessee | $20.97 |
| Ohio | $30.57 | Kentucky | $21.59 | Kentucky | $21.93 |
| South Carolina | $31.07 | Texas | $22.19 | Indiana | $22.48 |
| Illinois | $31.38 | Michigan | $22.60 | South Carolina | $22.70 |
| Texas | $31.58 | Ohio | $22.76 | California | $23.04 |
| Indiana | $31.59 | Indiana | $22.82 | Illinois | $23.11 |
| Michigan | $32.30 | California | $24.60 | Ohio | $23.24 |
| California | $38.54 | Illinois | $30.05 | Michigan | $23.31 |
Source: Author’s analysis of Bureau of Labor Statistics Occupational Employment and Wage Statistics (BLS-OEWS).
Not only are they lower, however, the real value of auto manufacturing wages in South Carolina are falling. Table 3 shows the hourly wages for auto and auto parts manufacturing workers for 2012 and 2023, both in 2023 dollars. The real value of median wages for all three groups of auto workers have fallen since 2012. This is a remarkable trend—that a fast-growing industry with many employers needing to rapidly staff new facilities would face so little pressure to raise pay (such that that typical wages for workers in this industry would not even keep up with inflation) exemplifies just how little bargaining power workers in South Carolina have.
Median hourly earnings for auto manufacturing workers in South Carolina, 2012 and 2023
| Occupation | 2012 | 2023 |
|---|---|---|
| Motor vehicle body and trailer manufacturing | $31.28 | $19.70 |
| Motor vehicle manufacturing | $35.44 | $31.07 |
| Motor vehicle parts manufacturing | $24.79 | $22.70 |
Note: Wages are adjusted for inflation and displayed in 2023 dollars.
Source: Author’s analysis of Bureau of Labor Statistics Occupational Employment and Wage Statistics.
The decline in the purchasing power of auto worker’s wages is substantial. The decline is largest for motor vehicle and trailer manufacturing workers, whose wages fell by $11.58 per hour. That amounts to a decline of $463.37 for a 40-hour work week. Motor vehicle manufacturing (-$4.37) and motor vehicle parts manufacturing (-$2.09) workers saw smaller, yet substantial, declines that would amount to a loss of $175.00 and $83.60 respectively, for each 40-hour work week.
As more auto and auto parts manufacturing companies move into or expand in the state and the region, they are investing billions of dollars building up plants, facilities, infrastructure, and supplier networks. For example, Scout Motors, mentioned above, has broken ground on their new $2 billion plant that will span about 1,600 acres in Blythewood, SC. (Santaella 2024). Redwood Materials, a battery recycling company, has broken ground on a $3.5 billion battery plant in Charleston (Visconti 2024). Envision AESC, a battery supplier for BMW, has announced an $810 million battery cell production plant in the state (SCDC 2022). There are nearly 500 auto-related companies in the state (SCDC 2021). South Carolina also provides one of the few deep-water ports on the east coast (Udavant 2023).
These factors along with massive state and federal subsidies and access to established supply networks provide auto workers in South Carolina with a key source of leverage to demand better pay and greater investments in their communities. Unionization has been crucial to other workers as a way to achieve these goals, especially long term.
The largest occupations in the state pay low wages, particularly to Black workers
As noted above, many states outside the South where wages are considerably higher have raised their state’s minimum wage. In South Carolina, not only has the state not raised its minimum wage, but state lawmakers have enacted abusive preemption laws that prevent localities within the state from doing so (EPI 2024a). Below we examine what this means for workers in some of the most common occupations in the state.
Table 4 shows the 15 largest occupations in the state, the number of workers in the occupation, and earnings of workers at the 25th percentile and the median. The workers in just these 15 occupations make up 31% of all workers in the state. They fill crucial roles in the state’s economy, including caring for the sick and elderly; ensuring the fast-growing trade, transportation, and utilities sector continues to be strong; and making sure the hospitality industry (so crucial to South Carolina’s economy) is thriving.
The 15 largest occupations in South Carolina, total employment, and earnings at the 25th and 50th percentiles
| Total employment | Hourly earnings at 25th percentile | Median hourly earnings | Median annual earnings | |
|---|---|---|---|---|
| All occupations | 2,222,950 | $14.80 | $20.30 | $42,220 |
| Retail salespersons | 69,050 | $11.15 | $13.89 | $28,900 |
| Fast food and counter workers | 60,800 | $10.71 | $12.40 | $25,790 |
| Customer service representatives | 56,350 | $14.59 | $17.41 | $36,220 |
| Cashiers | 55,560 | $10.71 | $12.69 | $26,400 |
| Laborers and freight, stock, and material movers, hand | 54,000 | $14.77 | $17.45 | $36,290 |
| Registered nurses | 48,790 | $32.43 | $37.68 | $78,380 |
| Stockers and order fillers | 46,550 | $14.28 | $16.32 | $33,950 |
| Miscellaneous assemblers and fabricators | 44,970 | $17.08 | $19.02 | $39,570 |
| General and operations managers | 43,390 | $29.82 | $43.42 | $90,310 |
| Waiters and waitresses | 42,470 | $8.55 | $8.98 | $18,680 |
| Office clerks, general | 40,170 | $13.58 | $16.58 | $34,490 |
| Heavy and tractor-trailer truck drivers | 34,560 | $21.38 | $24.10 | $50,130 |
| Secretaries and administrative assistants, except legal, medical, and executive | 33,220 | $15.99 | $18.86 | $39,220 |
| Home health and personal care aides | 31,750 | $11.34 | $13.62 | $28,330 |
| Janitors and cleaners, except maids and housekeeping cleaners | 30,100 | $11.79 | $13.86 | $28,820 |
| Percent of all workers | 31.1% |
Source: Earnings data are from EPI analysis of Bureau of Labor Statistics May 2023 Occupational Employment and Wage data (BLS-OEWS).
At $20.30, the median wage among all workers in South Carolina is too low to provide a full-time, year-round worker with enough income to meet their most basic needs in any metropolitan area in the state for which we have data.8 And most of the workers represented in these top 15 occupations are paid much less. Waiters and waitresses are paid just $8.98, fast-food and counter workers are paid just $12.40, cashiers are paid $12.69, and retail salespersons are paid just $13.89 per hour.
Because the median is often used to represent the typical worker in an occupation, there is a tendency to overlook the even more dire struggles of the half of workers in low-wage jobs that are paid less than the median. These data highlight the need to account for the variation in wages within occupations. For example, the largest occupation in Table 4 is “retail salespersons” who were paid a median wage of $13.89 per hour (or $28,900 annually) for someone working full time, year-round. This would leave a two-parent family with two children and both parents working full time unable to live a modest yet adequate lifestyle (EPI 2024c). Because half of retail salespeople are paid less than the median, they will struggle even more to provide for their families. For example, retail salespeople at the 25th percentile are paid just $11.15 per hour or $23,190 annually—$5,710 less than workers at the median.
Looking at the racial makeup of workers in these occupations also shows that low wages also reinforce racial inequality. Table 5 shows the racial composition of workers across the 15 largest occupations in the state. While workers across racial and ethnic backgrounds are represented in all 15 occupations shown, the jobs that pay the most are filled primarily by white South Carolinians, while Black South Carolinians are overrepresented in lower-wage jobs. Black workers make up almost a quarter of the workforce—24.9% of all workers—but they are seriously overrepresented among home health and personal care aides (57.7%), miscellaneous assemblers and fabricators (52.3%), laborers and freight, stock, and material movers, hand (42.2%), and cashiers (36.5%). They are underrepresented however, among general and operations managers who are 77.3% white workers and registered nurses who are 79.4% white.
Racial and ethnic composition of workers in the 15 largest occupations in South Carolina
| Percent Black | Percent white | Percent another racial/ethnic group | |
|---|---|---|---|
| All occupations | 24.9% | 65.7% | 9.4% |
| Retail salespersons | 25.1% | 69.3% | 5.6% |
| Fast food and counter workers | — | 60.3% | — |
| Customer service representatives | 35.9% | 55.4% | 8.7% |
| Cashiers | 36.5% | 52.8% | 10.7% |
| Laborers and freight, stock, and material movers, hand | 42.2% | 45.0% | 12.8% |
| Registered nurses | 17.5% | 79.4% | 3.1% |
| Stockers and order fillers | 36.4% | 53.2% | 10.4% |
| Miscellaneous assemblers and fabricators | 52.3% | 33.8% | 13.9% |
| General and operations managers | — | 77.3% | — |
| Waiters and waitresses | 19.8% | 72.6% | 7.6% |
| Office clerks, general | 22.6% | 67.6% | 9.8% |
| Heavy and tractor-trailer truck drivers | 64.1% | 27.2% | 8.7% |
| Home health and personal care aides | 57.7% | 37.5% | 4.8% |
| Janitors and cleaners, except maids and housekeeping cleaners | 44.3% | 44.2% | 11.5% |
Note: Due to a change in the way home health care aides and personal care aides are categorized in different years in the Current Population Survey, the data for 2017–2019 includes only personal care aides while the 2021–2023 data includes both home health care aides and personal care aides. Sample sizes for Black and other racial ethnic groups too small to estimate their share of fast-food and counter workers and general and operations managers.
Source: EPI analysis of the 2017–2023 Current Population Survey (CPS).
Now is the time for state lawmakers and employers to reconsider compensation policies and break from historically all-too-common practices that exploit workers. Figure P shows the 20 occupations projected to add the largest numbers of new jobs by 2032. Many of these are low-wage jobs that make up the largest occupations in the state today. Of the 20, less than half have hourly pay rates at or above the $20.30 median for all workers. None of the top five occupations pay at or above this rate despite constituting the vast majority of new jobs—45.5% of the 20 occupations projected to add the largest numbers of new jobs by 2032 and 18.3% of all projected new jobs.
Many of the occupations adding the largest number of new jobs in South Carolina are low-wage jobs: Occupational projections for some of the fastest growing jobs in South Carolina, 2022–2032
| 2022–2032 new jobs | |
|---|---|
| Laborers and freight, stock, and material movers, hand ($17.45) | 12,070 |
| Home health and personal care aides ($13.62) | 10,960 |
| Stockers and order fillers ($16.32) | 8,430 |
| Retail salespersons ($13.89) | 8,300 |
| Cooks, restaurant ($15.32) | 8,120 |
| General and operations managers ($43.42) | 6,690 |
| Fast food and counter workers ($12.40) | 6,690 |
| Misc. assemblers and fabricators ($19.02) | 4,840 |
| Software developers ($53.43) | 4,520 |
| Registered nurses ($37.68) | 4,470 |
| Maintenance and repair workers, general ($21.33) | 3,460 |
| Heavy and tractor-trailer truck drivers ($24.10) | 3,130 |
| Customer service representatives ($17.41) | 3,060 |
| Janitors and cleaners ($13.86) | 3,050 |
| First-line supervisors of food workers ($18.17) | 3,030 |
| Market research analysts and marketing specialists ($28.96) | 2,940 |
| Medical and health services managers ($50.07) | 2,930 |
| Cashiers ($12.69) | 2,930 |
| Industrial truck and tractor operators ($19.43) | 2,780 |
| Medical assistants ($17.99) | 2,750 |
Note: Janitors and cleaners do not include maids and housekeeping cleaners.
Source: Occupational projections are taken from the Projections Managing Partnership (PMP), sponsored by the U.S. Department of Labor. Earnings for each occupation are taken from the Bureau of Labor Statistics Occupational Employment and Wage Statistics (BLS-OEWS).
All workers, independent of race, gender, or other characteristics, should have sufficient earnings to allow them to purchase food, housing, transportation, and all the other items that support a basic standard of living and help fuel the state’s economy. When large segments of the population cannot afford to buy basic necessities, consumer demand is reduced, shrinking the pool of potential customers that businesses need to buy their goods and services. Further, inadequate pay can make it difficult for many people to remain fully attached to the workforce. For instance, if someone cannot afford child care or a car payment, they may opt to stay out of the formal workforce or may be forced to work sporadically or only part time. This only further weakens the state’s long-term growth if large segments of the potential workforce are not fully participating in the labor market.
Jobs in South Carolina lack many basic workplace benefits
Workers across the state not only face low wages but they are also less likely than workers nationally to have access to key workplace benefits, such as paid family leave. In 70% of households with children across the state, all parents are in the labor market (National Partnership 2023b). A lack of paid family leave coverage forces workers to lose income if they take time off to welcome a child into their family, to care for an elder parent, or to receive care themselves for an extended period. In many cases, it can mean losing their jobs or opting to stay out of the workforce. According to data from the National Partnership for Women and Families (2023b), about 1.9 million workers in South Carolina, or 78% of the state workforce, do not have access to paid family and medical leave. They estimate that if women in South Carolina participated in the labor market at the same rate as women in countries that do have paid family leave, there would be an additional 82,000 people working in the state.
Workers across South Carolina are also less likely to have paid sick leave, another key workplace benefit. Paid sick leave ensures workers can take time off from work if they or a family member are sick or injured. Since South Carolina does not have a law requiring paid sick leave, it is up to employers to decide whether to offer this benefit to their workers. Many employers choose not to do so and, predictably, access to paid sick leave in South Carolina is lower than the national average. While nationally almost 78% of workers have paid sick leave, just 67% do in South Carolina (Mehta and Milli 2023). Worse, employers of low-wage workers—the very workers least able to afford to lose any income—are much less likely to have access to paid time off (Gould and Wething 2023). This is not just a hardship for workers and families, it also endangers public health when workers go to work sick or must send their children to school or daycare when they are ill.
Poor job quality is a product of policymakers’ decisions that have disempowered workers
One key reason that job quality is lower in South Carolina and much of the South is the lack of worker power. Employers are only able to retain staff despite low wages and poor job quality when employees lack the bargaining power to demand better working conditions or to find a new job. As noted, lawmakers in South Carolina—and in many other Southern states—have advanced an economic development strategy designed to keep wages low, limit regulations on corporations, and not require worker benefits or supports, such as employer-provided health insurance or paid leave. This allows lawmakers to advertise their state as “business friendly” to lure businesses into the state (Childers 2024a). A key feature of this strategy is to prevent and undermine workers’ ability to join together with their coworkers in unions. Unions are one of the most powerful means for workers to negotiate better wages and benefits. In fact, one of the best indicators of job quality is whether workers are unionized.
Unionized workers have higher wages; are more likely to have employer-provided health care, paid sick leave, paid family and medical leave; and they experience less inequality compared with nonunion workers (Banerjee et al. 2021). Many employers therefore oppose workers’ efforts to form a union, frequently with the help of lawmakers. For instance, South Carolina is one of 25 states in which lawmakers have passed a deceptively named right-to-work law. These laws do not guarantee workers a job; rather, they make it more difficult for workers to form and maintain unions by limiting collective bargaining rights. RTW laws emerged in the 1940s as a means of preventing workers from joining together in solidarity, especially across racial lines.
Given how central slavery and racial division were to South Carolina’s history, the state’s fierce opposition to unions may be viewed as just one more part of that legacy. Figure Q shows that South Carolina has the lowest union coverage rate of any U.S. state—meaning that a smaller share of the state’s workers is covered by a union contract than in any other state in the country.9
South Carolina has the lowest union coverage rates of any state: Union coverage rates by state, 2023
| State | 2023 Union coverage |
|---|---|
| Hawaii | 25.5% |
| New York | 21.5% |
| Washington | 18.1% |
| New Jersey | 17.3% |
| California | 16.9% |
| Connecticut | 16.9% |
| Vermont | 15.4% |
| Alaska | 15.2% |
| Oregon | 15.0% |
| Nevada | 14.5% |
| Pennsylvania | 14.2% |
| Michigan | 14.1% |
| Minnesota | 14.1% |
| Illinois | 13.6% |
| Massachusetts | 13.5% |
| Ohio | 13.5% |
| Rhode Island | 13.3% |
| Montana | 13.0% |
| Maryland | 12.8% |
| Kentucky | 11.2% |
| New Hampshire | 10.9% |
| Maine | 10.8% |
| Kansas | 10.5% |
| District of Columbia | 10.4% |
| Missouri | 10.4% |
| Delaware | 10.1% |
| West Virginia | 10.1% |
| Mississippi | 9.8% |
| Nebraska | 9.4% |
| New Mexico | 9.0% |
| Indiana | 9.0% |
| Iowa | 8.7% |
| Alabama | 8.6% |
| Colorado | 8.6% |
| Utah | 8.4% |
| Wisconsin | 8.4% |
| Oklahoma | 7.8% |
| North Dakota | 7.5% |
| Tennessee | 6.9% |
| Wyoming | 6.6% |
| Florida | 6.1% |
| Arkansas | 5.8% |
| Virginia | 5.6% |
| Texas | 5.4% |
| Georgia | 5.4% |
| Idaho | 5.4% |
| Louisiana | 5.1% |
| Arizona | 4.8% |
| South Dakota | 4.2% |
| North Carolina | 3.3% |
| South Carolina |
3.0% |
Source: EPI analysis of Current Population Survey (CPS).
Another factor in lower rates of unionization is the composition of the jobs across the state. As we show above, many of the largest occupations in the state—retail salesperson, fast-food and counter workers, cashiers, home health and personal care aides—are occupations that have traditionally been more difficult to organize for several reasons, including high turnover rates among workers and workers being spread out across different employment sites. Moreover, some of the largest industries in South Carolina are those in which workers lack collective bargaining rights under federal labor law. Agricultural workers, domestic workers, and state and local public-sector workers are explicitly omitted from federal labor laws, leaving legal protections for these workers up to states. Unlike most states—which have enacted policies extending some form of collective bargaining rights to public employees—South Carolina law explicitly declares collective bargaining illegal for all state and local government workers (CLJE 2024, 10).
Even for those workers who are protected by federal labor law, trying to form a union is an incredibly difficult undertaking. Employers nationwide collectively spend hundreds of millions of dollars each year to dissuade workers from exercising their right to form a union. And many employers willfully violate workers’ rights to organize and form a union knowing they will face minimal, if any, repercussions (McNicholas et al. 2019; Shierholz et al. 2024).
Still, workers across the South are working to overcome these barriers to organize in new ways. For example, the Union of Southern Service Workers (USSW) organizes across workplaces in South Carolina, North Carolina, and Georgia. The federal funding from the BIL, IRA, and the CHIPS Act is leading to rapid growth in industries such as manufacturing, especially auto manufacturing. New public and private investments promise to create good jobs that are providing potential new leverage for organizing. Labor, faith, and community coalitions are forming to try to take advantage of this opportunity to make sure that they and their communities also benefit from these investments and not just wealthy corporations, many of which are foreign companies (AFL-CIO 2019).
Unless wages are raised and workers have stronger leverage to fight for better wages and benefits, current economic and racial inequalities will be reinforced and deepened in the future. Not only will this impact workers directly, but it also has implications for their families, broader communities, and the overall economy.
Low wages, paltry benefits, and a lack of public supports leaves many South Carolinians in poverty
Perhaps the most commonly used measure of economic well-being is the official poverty rate. An individual or family is considered in poverty if their total personal or family income falls below the federal poverty threshold for their family’s size and composition. For example, in 2023, a family with two parents and two children had a poverty threshold of $30,900 (U.S. Census Bureau 2024c). A family with income below this amount would be considered in poverty—a level of income below which most, if not all, families would struggle to meet their families’ basic needs.
In South Carolina, 13.9% of the population falls below the poverty line. This is higher than the poverty rate in the South (13.5%) and the U.S. as a whole (12.5%). South Carolina’s poverty rate in 2023 was the 12th highest in the country. The state also has a substantially higher child poverty rate than the nation at 19.1% compared with 16.0% nationally.10 Its child poverty rate is the 10th highest in the nation.
There is particularly acute racial inequity among those facing poverty in South Carolina. Like the country as a whole, the poverty rate for Black and Hispanic South Carolinians is markedly higher than the poverty rate for white South Carolinians. Table 6 shows that in both South Carolina and nationally, the poverty rate among non-Hispanic white people in 2023 was 9.4%. Nationally, the poverty rate among Black people was more than twice that at 20.8%, while Hispanic poverty was slightly less than double at 16.6%. In South Carolina, however, both the Black and Hispanic poverty rates were markedly higher, at 23.0% and 22.0% respectively. Notably, the Black poverty rate in South Carolina is much higher than both the national rate and the poverty rate for Black people in the South as a whole (which is actually lower than the national rate).
Poverty rates for major demographic groups in the U.S., South, and South Carolina, 2023
| South Carolina | South | United States | |
|---|---|---|---|
| Poverty rate | 13.9% | 13.5% | 12.5% |
| Child poverty rate | 19.1% | 18.0% | 16.0% |
| Men | 12.4% | 12.2% | 11.3% |
| Women | 15.3% | 14.8% | 13.6% |
| Non-Hispanic white | 9.4% | 10.0% | 9.4% |
| Black | 23.0% | 20.4% | 20.8% |
| Hispanic | 22.0% | 17.4% | 16.6% |
Source: EPI analysis of U.S. Census Bureau, American Community Survey (U.S. Census Bureau ACS), 2023 Table S1701, one-year sample.
The ‘Corridor of Shame’
South Carolina’s public schools provide a clear example of inadequate public investment and highlights the way this lack of investment harms workers and families in the state. There is a region in South Carolina known as the “Corridor of Shame”—17 mostly rural counties, that run along Interstate-95 (Bowers 2021).11
The region includes South Carolina’s wealthiest county—Beaufort—but it is largely marked by high poverty and unemployment, low educational attainment, and negative population and income growth rates (Temoney and Ullrich 2018). In four of these counties (Dillon, Lee, Marion, Marlboro), clustered in the northeastern part of the state, over a quarter of people are in poverty, with the highest rate in Dillon County (31.6%). Poverty rates are even higher for Black, Hispanic, and Asian American Pacific Islander residents of these counties (HDPulse 2025). The Corridor of Shame is also home to a large share of the state’s Black population. In 11 of the 17 counties, at least 40% of the population is Black.12
The area got its name from a documentary about the poor quality of underfunded schools in these poor and rural communities (Ferillo 2007). In 1993, more than three dozen school districts—later reduced to eight districts—filed a lawsuit against the state for not ensuring the resources to “provide an equal educational opportunity” for students in these districts (Click and Hinshaw 2015; Temoney and Ullrich 2018).13 In 2005, the court ruled that the state met its obligation to provide a “minimally adequate education,” except for early childhood education. The documentary revealed how poorly these schools were funded and the extent to which students in these schools were failed. According to the documentary, schools in these poor, rural districts were in disrepair, lacked cooling and heating, and had leaking roofs. At least one school had its roof collapse and at least one educator reported raw sewage and bugs backing up into the halls of the school. There were appeals of the court decision and in 2014, 21 years after the original lawsuit, the South Carolina Supreme Court finally ruled 3-2 that the state had failed to provide “minimally adequate” education for the state’s poorest districts (Click and Hinshaw 2015; Temoney and Ullrich 2018).
Figure R shows poverty rates by county across South Carolina with the “Corridor of Shame” counties highlighted.
Today, these schools are still underfunded. Wen (2022) reports that 90% of South Carolina’s districts are underfunded with poorer districts disproportionately suffering from revenue deficits. Among the factors in the underfunding of these districts are the property tax abatements given to corporations. These abatements have increased every year since 2017 and in 2021 amounted to $534 million in revenue that could have otherwise gone to public education. Some of the largest revenue losses for school districts in the Corridor of Shame include Dillon County ($3.8 million), Jasper County ($6 million), and Orangeburg County ($9.5 million; Wen 2022).
With lower earnings and high poverty rates across the state, the average family in South Carolina has a family income that is well below what would be needed to attain an adequate yet modest standard of living. EPI’s (2024c) Family Budget Calculator estimates metro- and county-specific costs for families based on the number of parents (1 or 2) and presence of and number of children (up to 4) for all counties and metro areas in the United States. It includes the cost of housing, transportation, food, health care, child care, and taxes. This provides a more accurate and complete measure of economic security than the federal poverty measure.
Figure S shows the family income a typical two-parent household with two children would need to cover the basics in seven of South Carolina’s major metropolitan areas along with the median family income in those metro areas. The data show that in no metropolitan area for which we have data is the typical family income at a level that meets the needs of families. The metro area where the median family income comes closest is the Charleston-North Charleston Metro, with much larger gaps in other metro areas.
Median family incomes fail to meet basic need levels across metros: Median family income and basic income needed for modest lifestyle by South Carolina metro areas, 2023
| Metro area | Median family income | Basic income needed |
|---|---|---|
| Sumter | $67,811 | $85,822 |
| Myrtle Beach-Conway | $72,285 | $90,733 |
| Florence | $73,657 | $86,986 |
| Spartanburg | $75,197 | $90,796 |
| Columbia | $82,055 | $94,106 |
| Charleston-North Charleston | $97,700 | $102,369 |
Note: Myrtle Beach-Conway includes North Myrtle Beach. Title shortened to fit graph. Data are in 2023 dollars.
Source: EPI Family Budget Calculator.
The prevalence of low incomes in the state means that many South Carolina families struggle to afford basic necessities and likely face considerable hardship caring for themselves and their families; enjoying whatever leisure time they may have; and trying to find and maintain regular employment. For low-income families, any economic shock—such as an unexpected medical bill or car repair—can be all it takes for them to be put into default, be evicted from their home, face repossession on a vehicle, among many other potential challenges that can lead them deeper into economic despair. In the following sections, we examine how housing, transportation, and food insecurity represent additional challenges for many low-income South Carolinians.
Low incomes and inadequate public investment make it hard for families to afford the basics
Housing security
Without housing, everything else falls apart.
– Rev. Jason W. Myers, Director, Chester Worker Empowerment Center
Housing is a basic need that is fundamental to achieving economic security. Reliable, safe, and affordable housing increases the ability of people to participate in the labor market, apply for jobs, and maintain employment once they have a job. When people lack reliable housing, they are less able to focus on finding a job since their attention and energy will often be focused on securing a place to sleep. Further, reliable housing increases the likelihood they will have access to the technology to search for and apply for a job. The process of applying for jobs requires applicants have a fixed address in addition to a current phone number and email address to send and receive communications with potential employers. Finally, having reliable housing further increases the likelihood that workers are ready to work, rested, in appropriate attire, and able to focus on skill development.
Unfortunately, many South Carolinians—especially those who rent—are housing insecure. Compared with the South and the U.S., South Carolina homeowners spend a slightly smaller share of their household income on the monthly costs of homeownership (19.6% of homeowners spend 35% of monthly household income on these costs, compared with 20.8% in the South and 21.3% in the U.S.; U.S. Census Bureau ACS 2022a). However, renters in South Carolina are more likely to be cost burdened.
There are over 150,000 households in South Carolina designated as extremely low income (below the poverty line or 30% of the area’s median income), and nearly three-quarters (73%) of those households are severely cost burdened, meaning they spend more than half of their income on housing. There is a shortage of nearly 90,000 rental homes available and affordable to extremely low-income renters (NLIHC n.d.). Beyond being unaffordable and in short supply, the existing housing stock in many low-income areas is substandard or even dangerous. For example, advocates in Chester County reported that a natural disaster relief organization came to Chester in 2017 and returned in 2018. They stepped in to demolish and rebuild houses that were in severe disrepair. Advocates noted that some families were living in homes with no running water and one family was living in a house that had been knocked off its foundation.14
Transportation access
Lack of transportation is another major barrier for many workers across the state, especially when jobs are not in areas where job seekers are located. Not all counties or all parts of all counties have access to public transportation, according to the South Carolina Department of Transportation annual report (SCDOT 2024). South Carolina ranks 49th in the nation (ahead of only Alabama) for public transit usage in terms of the annual average number of miles per resident traveled via public transit. South Carolina’s largest public transit systems, measured in passenger trips, are the Charleston Area Regional Transportation Authority (2,142,165 trips in 2023) and the Central Midlands Regional Transportation Authority (1,725,176 trips in 2023). All other bus systems in the state provide fewer than 100,000 trips per year (FTA 2024).
Lack of transportation was one of the top reasons given for not having a job in a survey conducted by the South Carolina Department of Employment and Workforce (Millan Chicago LLC 2022). The report indicates that the federal Infrastructure Investment and Jobs Act (IIJA) is providing substantial dollars for public transit. If this results in more low-cost, accessible public transportation that allows workers without private transportation to connect with available jobs, it could not only increase employment and economic security for many South Carolinians, but it will also likely make it easier for businesses to recruit workers.
Lacking adequate public transit options, many South Carolinian workers drive to work and they too face substantial challenges, including long commute times on dangerous and failing roads. According to a 2024 report, 41% of South Carolina’s major roads are in “poor or mediocre condition,” costing drivers $2.8 billion a year in repairs, vehicle depreciation, and increased fuel consumption. Fortunately, the 2021 federal IIJA is expected to provide $5 billion in state funds for highway and bridge improvement in South Carolina. As of mid-2024, federal funds supported over half (56%) of the state’s spending on such improvements (TRIP 2024a).
South Carolina has some of the deadliest roads of any state15 and its roads have gotten more dangerous over time. In 2023, the state’s traffic fatality rate was 1.7 fatalities per million vehicle miles traveled (compared with 1.26 in the U.S.) and 1,028 people were killed, a 34% increase since 2013 (TRIP 2024c). Rural roads are particularly deadly, and South Carolina’s fatality rate on rural roads is also the highest in the nation (TRIP 2024b).
Food insecurity
Over 300,000 households in South Carolina (14.4% of households in the state) are unable to acquire adequate food due to limited resources. South Carolina is one of only seven states where food insecurity is higher than the national average, and it is one of only six states where the prevalence of very low food security is higher than average.16 Very low food security is a severe form of food insecurity in which one or more household members are forced to eat less because of limited resources. South Carolina was the only state in the nation to see statistically significant increases in very low food security from 2013 to 2023, while these rates declined in 18 states (Rabbit et al. 2024).17 South Carolina has the fourth highest share of free lunch-eligible children18—70% of the state’s K-12 students relied on free schools meals during the 2022–2023 school year (ED NCES 2024).
Despite high rates of food insecurity, including among children, South Carolina lawmakers have not invested in policy solutions to address hunger. In fact, two Republicans cosponsored a 2023 federal House bill to expand the already harsh work requirements of the Supplemental Nutrition Assistance Program (SNAP).19 The bill would put SNAP benefits at risk for 30% of households participating in the program, one of the highest state participation rates in the nation (Bolen, Rosenbaum, and Nchako 2023). And Governor McMaster opted out of the 2024 Summer Electronic Benefits Transfer program, which would have given eligible families food vouchers to use during the summer break when students do not receive free lunch (Brams and James 2024). These provide further examples of how lack of public investment makes it more difficult for families to meet their basic needs.
Conclusion
South Carolina has a long history of exploitative labor practices extending back to before it was even a state with the first enslaved African arriving in 1526 (Brockell 2019). The state’s labor policies and practices today are, in many ways, a direct extension of that same strategy to extract labor at the lowest possible cost while keeping workers disempowered. It is this model that has meant that despite South Carolina’s economy experiencing exceptional job growth during and after the recovery from the COVID-19 pandemic with employers struggling to find workers, wages remain low and show less growth than wages across the South or the nation.
Compounding the challenges facing workers in South Carolina, recent job growth has been distributed unequally across the state. Many employers fail to provide workplace benefits, such as paid leave, that might allow or encourage more working parents and caregivers to fully participate in the workforce. Many South Carolinians lack access to safe, reliable, affordable transportation that might give them access to these job centers. For all these reasons, a substantial share of the prime-age South Carolina population is not participating in the labor market at all.
Many South Carolinians, especially children and Black and brown residents, are experiencing high rates of poverty and overall economic insecurity.
Policymakers across the state have the opportunity to shift directions. Instead of continuing to embrace anti-worker policies, they can begin to adopt pro-worker policies that will allow South Carolinians broadly to share in the prosperity their labor creates. This could begin with state lawmakers implementing a minimum wage for the state that is truly a living wage. This would be a first step toward ensuring that all jobs in the state are good jobs.
State lawmakers could also embrace the job quality levers built into the BIL, IRA, and CHIPS bills. For instance, lawmakers could require that workers on federally funded projects are paid prevailing wages—setting a wage floor for workers—and that new infrastructure and manufacturing facilities are built using project labor agreements.
State lawmakers could further ensure that large employers benefiting from federal and state public subsidies enter community benefits agreements (CBAs), legally binding agreements between community coalitions that can include labor organizations, racial justice groups, environmental advocates, government agencies, and developers and contractors (Reimagine Appalachia n.d.). These commitments range from hiring local workers, paying prevailing wages, and ensuring minimum benefits and safety standards for workers. They can also include agreements on land use and contributions to affordable housing and child care. These agreements help ensure that workers, their families, and their communities also benefit from the public tax dollars spent to build up infrastructure, like roads and bridges.
State lawmakers could also ensure workers have access to basic benefits that would allow them to balance work and family demands. Paid family and medical leave, for example, has been shown to have significant benefits for families including increasing their economic security and overall better health outcomes (National Partnership 2023a). But this also benefits employers because access to state paid leave programs have been shown to reduce turnover among workers and it makes participation less expensive for small businesses (Corley 2016; National Partnership 2023a). Thus, this should be a priority for lawmakers concerned about labor force participation and who care about healthy families.
State lawmakers can also respect workers’ right to unionize. As discussed above, workers joining together with their coworkers in a union gives them better bargaining power with their employers and a stronger voice in their workplace. Workers who are unionized have higher wages, smaller wage gaps, and are more likely to have benefits such as health insurance, retirement benefits, and paid leave.
Finally, South Carolina, along with many states across the South, have passed preemption laws at the state level that prevent cities, counties, and other local entities from raising standards for workers and families in their communities. Some of the specific labor standards that have been preempted in South Carolina are raising the minimum wage, establishing a paid family leave program, regulating wages and working conditions for so-called gig workers, and preventing the requirement of project labor agreements when private businesses receive public dollars.
Because local governments are also an important force in economic development, they should use their leverage to encourage things like CBAs where they can (Gerstein and Gong 2024). Where they are preempted, however, their ability to contribute to overall economic development is hindered. State lawmakers should therefore rescind the preemptions, giving local communities the opportunity to pass laws that respond to their needs.
Together, these policies would improve workers lives by raising wages and help ensure their hard work allows them to provide for themselves and their families, to balance the demands of work and family, and give them a voice on their jobs. These policies would give local communities within South Carolina more control and raise standards for families and broader communities across the state.
Notes
1. The Affordable Care Act expanded Medicaid coverage to most adults with incomes up to 138% of the federal poverty level. To date, 40 states and D.C. have adopted the Medicaid expansion. The 10 states that have failed to adopt the Medicaid expansion are Alabama, Florida, Georgia, Kansas, Mississippi, South Carolina, Tennessee, Texas, Wisconsin, and Wyoming (KFF 2024).
2. Dividing 200,000 jobs by the 2,279,240 jobs in the state would produce an estimate of 8.8% of all jobs in the state. The total number of jobs shown in Table 1 assumes that all farm workers are included in the total number of jobs in the state. The QCEW data, however, exclude small farms so it is unclear how many of these jobs are represented in these data. If the 200,000 agribusiness jobs are in addition to the jobs shown in Table 1, the total number of jobs would be 2,479,240.
3. EPI analysis of ACS data.. Share of food production workforce and animal slaughter workers based on EPI analysis of the 2017–2019, 2021–2023 one-year American Community Survey. Sample sizes too small to estimate racial and ethnic composition of other food production occupations such as crop production.
4. The exceptionally large discrepancy between Hispanic women’s employment rate in South Carolina compared with their national employment rate deserves greater attention than is possible in this report and it should be explored in future research.
5. The remaining states without state minimum wage laws are Alabama, Louisiana, Mississippi, and Tennessee. While Georgia and Wyoming have minimum wage laws, their minimum wages are lower than the federal minimum wage, so the federal minimum wage applies.
6. There are exceptions that allow some workers to be paid less than the $7.25 federal minimum wage. Some groups covered by these exceptions include tipped workers, workers with disabilities, some youth workers, and seasonal or agricultural workers. However, when a state law requires a higher minimum wage than federal law, the state law would apply (DOL n.d.).
7. They would get a raise as employers adjust pay scales to reflect the new minimum.
8. Median hourly earnings in Table 4 differ from that in Figure N because they are taken from a different source, which allows us to examine earnings across detailed occupations. Earnings for detailed occupations should be compared only with overall median earnings in Table 4.
9. Union density, the share of South Carolina workers who belong to a union, is even lower at 2.3% (EPI analysis of Current Population Survey.)
10. ACS 2023 one-year estimates.
11. The unofficially defined counties include Bamberg, Beaufort, Calhoun, Clarendon, Colleton, Darlington, Dillon, Dorchester, Florence, Hampton, Jasper, Lee, Marion, Marlboro, Orangeburg, Sumter, and Williamsburg.
12. Bamberg (60.6%), Clarendon (45.6%), Darlington (41%), Dillon (46.4%), Florence (42.8%), Hampton (52.7%), Lee (62.9%), Marion (56.3%), Marlboro (49.4%), Orangeburg (61.5%), Sumter (45.9%), and Williamsburg (63.6%).
13. According to Click and Hinshaw (2015), the high court returned the case to the circuit court in 1999 and reduced the number of plaintiff districts to eight—Allendale, Dillon 4 (previously Dillon 2), Florence 4, Hampton 2, Jasper, Lee, Marion 7 and Orangeburg 3.
14. The source is a discussion with advocates from South Carolina who helped inform this report. These advocates included Rev. Jason W. Myers, Director, Chester Worker Empowerment Center and Leslie Brakefield, among others from the local community.
15. As measured by traffic fatalities per vehicle mile traveled.
16. Statistically significantly higher.
17. Data cover three-year period such that 2013 data include data from 2011–2013 and 2023 data include data from 2021–2023.
18. After Mississippi, Nevada, and New Mexico.
References
AFL-CIO. 2019. The Double Standard at Work: European Corporate Investment and Workers Rights in the American South. October 2019.
Agbor-Taylor, Phylisha. 2022. “South Carolina’s Black Majority (1708-1920).” BlackPast.org, January 23, 2022.
America Counts. 2021. “South Carolina Gained Almost Half a Million People Last Decade” (web page). U.S. Census Bureau, August 25, 2021.
Annie E. Casey Foundation. 2024. “2024 Kids Count Data Book Interactive” (web page). Published June 10, 2024.
Atkinson, Macon. 2024. “Migrant Workers Boost South Carolina Economy, Add to Population in Rural Places.” Post and Courier, April 9, 2024.
Bainbridge, Judy. 2018. “How Black Workers Changed the Textile Industry in South Carolina.” Greenville News, October 29, 2018.
Banerjee, Asha, Margaret Poydock, Celine McNicholas, Ihna Mangundayao, and Ali Sait. 2021. Unions Are Not Only Good for Workers, They’re Good for Communities and for Democracy. Economic Policy Institute, December 2021.
Bivens, Josh. 2024. “Profits and Price Inflation Are Indeed Linked.” Working Economics Blog (Economic Policy Institute), September 5, 2024.
Bolen, Ed, Dottie Rosenbaum, and Catlin Nchako. 2023. Families, Older People in Every State at Risk Under Proposed SNAP Rule That Would Take Food Away for Not Meeting Work Requirements. Center on Budget and Policy Priorities, March 2023.
Bowers, Shelby. 2021. South Carolina’s Corridor of Shame (website). April 19, 2021.
Brams, Sophie, and Dalilah James. 2024. “South Carolina Opted Out of Summer EBT Food Program. Local Groups Are Now Working to Fill the Gap.” WCBD News, May 29, 2024.
Brockell, Gillian. 2019. “Before 1619, There Was 1526: The Mystery of the First Enslaved Africans in What Became the United States.” Washington Post, September 7, 2019.
Bureau of Economic Analysis (BEA). 2024. GDP by State.
Bureau of Labor Statistics (BLS). 2024. Jobs Openings and Labor Turnover Survey (JOLTS).
Bureau of Labor Statistics, Current Employment Statistics (BLS-CES). 2024. State and Metro Area Employment, Hours, and Earnings. Accessed February 26, 2025.
Bureau of Labor Statistics, Local Area Unemployment Statistics (BLS-LAUS). 2024.
Bureau of Labor Statistics, Occupational Employment and Wage Statistics (BLS-OEWS). 2023. Occupational Employment and Wage Statistics: South Carolina. Accessed September 23, 2024.
Bureau of Labor Statistics, Quarterly Census of Employment and Wages (BLS-QCEW). 2024. Public data series accessed through the Quarterly Census of Employment and Wages QCEW databases. Accessed October 31, 2024.
Carlton, David L. 2016. “Textile Industry” (web page). South Carolina Encyclopedia, University of South Carolina, Institute for Southern Studies. Updated August 25, 2022.
Carroll, Ben. 2024. “New ‘Battery Belt’ Opens Organizing in the South.” Labor Notes, July 31, 2024.
Center for Labor and a Just Economy (CLJE). 2024. Building Worker Power in Cities and States: A Toolkit for State and Local Labor Policy Innovation, September 2024.
Childers, Chandra. 2024a. The Evolution of the Southern Economic Development Strategy: Rooted in Racism and Economic Exploitation Part One. Economic Policy Institute, May 2024.
Childers, Chandra. 2024b. Southern Economic Policies Undermine Job Quality for Auto Workers. Economic Policy Institute, September 2024.
Click, Carolyn, and Dawn Hinshaw. 2015. “SC Supreme Court Fines for Poor Districts in 20-Year-Old School Equity Suit.” The State, March 12, 2015.
Collins, Jeffrey. 2017. “S.C. Supreme Court Ends Oversight of Lawmakers in ‘Corridor of Shame’ Case.” ABC News, November 20, 2017.
Corley, Danielle. 2016. Paid Leave Is Good for Small Business. Center for American Progress, October 2016.
Current Population Survey (CPS) Extracts, Version 1.0.60, https://microdata.epi.org.
Department of Labor (DOL). n.d. “Questions and Answers About the Minimum Wage” (web page). Accessed April 29, 2024.
Economic Policy Institute (EPI). 2024a. “Workers’ Rights Preemption in the U.S.: A Map of the Campaign to Suppress Workers’ Rights in the States.” Updated June 2024.
Economic Policy Institute (EPI). 2024b. “Low Wage Workforce Tracker.” January 2025.
Economic Policy Institute (EPI). 2024c. “Family Budget Calculator.” January 2025.
Equal Justice Initiative (EJI). n.d.a. “On This Day—December 19, 1865: South Carolina Enacts Law Requiring Contracts to Refer to White People as ‘Masters’” (web page).
Equal Justice Initiative (EJI). n.d.b. “On This Day—May 10, 1740: South Carolina Passes Negro Act of 1740, Codifying White Supremacy” (web page).
Equal Justice Initiative (EJI). 2022. “The Transatlantic Slave Trade: Charleston, South Carolina” (web page). Published in 2022.
Federal Transit Administration (FTA). 2024. “Calendar Year Unlinked Passenger Trips (UPT)” [Excel file], Raw Monthly Ridership (No Adjustments or Estimates). Accessed November 12, 2024.
Ferillo, Bud. 2007. “Corridor of Shame: The Neglect of South Carolina’s Rural Schools.” YouTube video, 9:31. Published July 17, 2007.
Floyd, Ife, and Suzanne Wikle. 2024. “Work Requirements Are Rooted in the History of Slavery.” Nonprofit Quarterly, February 29, 2024.
Gerstein, Terri, and LiJia Gong. 2024. How Local Government Can Stand Up for Workers When States Try to Stand in Their Way. NYU Wagner Labor Initiative and Local Progress, September 2024.
Good Jobs First. 2024. “Tax Break Tracker” [database]. Accessed November 15, 2024.
Gould, Elise, and Hilary Wething. 2023. Paid Sick Leave Access Expands with Widespread State Action. Economic Policy Institute, November 2023.
Green, Mary. 2023. “S.C. Employers Look to Overcome Worker Shortage.” WRDW, September 19, 2023.
HDPulse. 2025. “An Ecosystem of Minority Health and Health Disparities Resources.” National Institute on Minority Health and Health Disparities. Accessed August 28, 2024.
Holdman, Jessica. 2024. “How SC’s Once-Dominating Textile Industry Has Transformed to Supply New Employers.” South Carolina Daily Gazette, August 7, 2024.
In the Public Interest and Local Progress (ITPI and LP). 2019. Why You Should Be Wary of Privatization.
Kellogg Family Foundation (KFF). 2024. “Status of State Medicaid Expansion Decisions” (web page). Published November 12, 2024.
Littlefield, Daniel C. 2022. “Slavery” (web page). South Carolina Encyclopedia, University of South Carolina, Institute for Southern Studies. Updated August 23, 2022.
MacGillis, Alec. 2020. “How Dollar Stores Became Magnets for Crime and Killing.” Propublica, June 29, 2020.
Martinez, Alexandra. 2023. “South Carolina Dollar General Workers Strike Over Wage Theft and Dangerous Working Conditions.” Prism, February 2, 2023.
McNicholas, Celine, Margaret Poydock, Julia Wolfe, Ben Zipperer, Gordon Lafer, and Lola Loustaunau. 2019. Unlawful: U.S. Employers Are Charged with Violating Federal Law in 41.5% of All Union Election Campaigns. Economic Policy Institute, December 2019.
Mehta, Sapna, and Jessica Milli. 2023. Millions of Working People Still Don’t Have Access to a Single Paid Sick Day. Center on Law and Social Policy, May 2023.
Millan Chicago LLC. 2022. South Carolina Labor Force Participation. South Carolina Department of Employment and Workforce, September 2022.
Moore, Kyle. 2024. State Unemployment by Race and Ethnicity. Economic Policy Institute. Updated February 2025.
Morrissey, Monique, and Jennifer Sherer. 2024. The Public-Sector Pay Gap Is Widening. Unions Help Shrink It. Economic Policy Institute, August 2024.
National Low Income Housing Coalition (NLIHC). n.d. “Housing Needs by State: South Carolina” (web page). Accessed October 20, 2024.
National Partnership for Women and Families (National Partnership). 2023a. Paid Leave Works: Evidence from State Programs (fact sheet). November 2023.
National Partnership for Women and Families (National Partnership). 2023b. Paid Leave Means a Stronger South Carolina, February 2023.
Perez, Sam. 2024. “Tourism Has a $29 Billion Impact on South Carolina. Here’s How It’s Being Celebrated.” WLTX19, May 20, 2024.
Phillips, Anna. 2024. “Untargeted Property Tax Cuts and Limits Shortchange Schools and Local Economies” (blog post). Off The Charts (Center on Budget and Policy Priorities), August 28, 2024.
Projections Managing Partnership (PMP). 2024. State Employment Projections, long-term projections 2022–2032. Projections Central.
Rabbit, Matthew P., Madeline Reed-Jones, Laura J. Jales, and Michael P. Burke. 2024. Household Food Security in the United States in 2023. United States Department of Agriculture Economic Research Service, September 2024.
Reimagine Appalachia. n.d. “Community Benefits” (web page). Accessed 02.26.2025..
Rubin, Hyman S. III. 2016. “Election of 1876” (web page). South Carolina Encyclopedia, University of South Carolina, Institute for Southern Studies. Updated July 26, 2022.
Sainato, Michael. 2023. “‘Codes Being Broken Every Day’: Dollar General Safety Violations Alarm Workers.” The Guardian, May 31, 2023.
Santaella, Tony. 2024. “200,000 Cars a Year: Groundbreaking Held for New Scout Motors Plant in Blythewood.” WLTX19, February 15, 2024.
Scott, William B., and Peter M. Rutkoff. 2016. “Great Migration” (web page). South Carolina Encyclopedia, University of South Carolina, Institute for Southern Studies. Updated August 4, 2022.
Service Employees International Union (SEIU). 2023. OSHA petition, Re: Petition to Revoke South Carolina Occupational and Health Safety Agency for Failure to Maintain an Effective Enforcement Program. December 7, 2023.
Shepardson, David. 2023. “Volkswagen’s Scout Unit Wins $1.3 Billion in Incentives for South Carolina Factory.” Reuters, March 20, 2023.
Sherer, Jennifer, and Elise Gould. 2024. “Data Show Anti-Union ‘Right-to-Work’ Laws Damage State Economies: As Michigan’s Repeal Takes Effect, New Hampshire Should Continue to Reject ‘Right-to-Work’ Legislation.” Working Economics Blog (Economic Policy Institute), February 13, 2024.
Shierholz, Heidi, Celine McNicholas, Margaret Poydock, and Jennifer Sherer. 2024. Workers Want Unions, But the Latest Data Point to Obstacles in Their Path. Economic Policy Institute, January 2024.
South Carolina African American History Calendar (SC AAHC). n.d. “Sarah Mae Flemming” (web page). Accessed February 26, 2025.
South Carolina Department of Commerce (SCDC). 2021. South Carolina’s Automotive Industry is Charging Ahead.
South Carolina Department of Commerce (SCDC). 2022. “$810 Million Investment Will Create 1,170 New Jobs” (news release). December 6, 2022.
South Carolina Department of Commerce (SCDC). 2024a. “From Appliances to Aircraft” (web page). Accessed February 26, 2025.
South Carolina Department of Commerce (SCDC). 2024b. “Corporate Income Tax & Incentives” (web page). Accessed February 10, 2025.
South Carolina Department of Employment and Workforce (SCDEW). 2023a. South Carolina Data Trends. December 2023.
South Carolina Department of Employment and Workforce (SCDEW). 2023b. South Carolina Data Trends. April 2023.
South Carolina Department of Transportation (SCDOT). 2024. Office of Public Transit 2023 Annual Report. January 2023.
South Carolina Farm Bureau (SCFB). n.d. “Food and Farm Facts” (web page). Accessed November 1, 2024.
Temoney, LaRaven, and Laura D. Ullrich. 2018. “All Talk, but No Action: A Reexamination of Education in South Carolina’s Corridor of Shame.” The Winthrop McNair Research Bulletin, 4, no. 10: 64–73.
TRIP. 2024a. Key Facts About South Carolina’s Surface Transportation System (fact sheet). May 2024.
TRIP. 2024b. Moving South Carolina Forward: Providing a Modern, Sustainable Transportation System in the Palmetto State. September 2021.
TRIP. 2024c. “Fatal & Serious Traffic Crashes in South Carolina Resulted in $30.9 Billion in Economic and Quality-of-Life Costs in 2023” (news release). July 2, 2024.
Udavant, Sakshi. 2023. “Why EV Companies Are Flocking to South Carolina.” Manufacturing Dive, April 14, 2023.
Union of Southern Service Workers (USSW). 2024. “Our Demands” (web page). Accessed February 26, 2025.
U.S. Census Bureau. 2024a. “Quick Facts: South Carolina.” Population Estimates Program. Accessed 02.26.2025.
U.S. Census Bureau. 2024b. “Annual and Cumulative Estimates of Resident Population Change for the United States, Regions, States, District of Columbia, and Puerto Rico and Region and State Rankings: April 1, 2020 to July 1, 2023 (NST-EST2023-CHG)” [Excel file], State Population Totals: 2020–2024. Updated November 25, 2024.
U.S. Census Bureau. 2024c. “Poverty Thresholds by Size of Family and Number of Children” [Excel file], Poverty Thresholds. Updated January 23, 2025.
U.S. Census Bureau, American Community Survey (U.S. Census Bureau ACS). 2022a. ACS One-Year Estimates, Table DP04, “Selected Housing Characteristics.” Accessed September 10, 2024.
U.S. Census Bureau, American Community Survey (U.S. Census Bureau ACS). 2022b. ACS Five-Year Estimates, Table S1701, “Poverty Status in the Past 12 Months.” Accessed February 26, 2025.
U.S. Census Bureau, American Community Survey (U.S. Census Bureau ACS). 2023. ACS One-Year Estimates, Table S1701, “Poverty Status in the Past 12 Months.” Accessed February 26, 2025.
U.S. Census Bureau. 2023. “U.S. Population Trends Return to Pre-Pandemic Norms as More States Gain Population” (news release). December 19, 2023.
U.S. Department of Education, National Center for Education Statistics (ED NCES). 2024. “Public Elementary/Secondary School Universe Survey, 2000–01, 2012–13, and 2019–20 through 2022–23” [Excel], Digest of Education. Published January 2024.
U.S. Department of Labor, Occupational Safety and Health Administration (DOL OSHA). n.d. “State Plans” (web page). Accessed January 24, 2025.
U.S. Department of Labor, Occupational Safety and Health Administration (DOL OSHA). 2023. “Nine Inspections in Four States Find Dollar General Exposed Workers to Obstructed Exits, Fire, Electrical Hazards; Carry $3.4M in New Penalties” (news release). May 23, 2023.
Vasquez, Tina. 2023. “‘A Change Is Gonna Come’ in the South.” Prism, August 24, 2023.
Visconti, Zachary. 2024. “Redwood Materials Breaks Ground on $3.5B South Carolina Battery Plant.” Teslarati, January 28, 2024.
Von Nessen, Joseph. 2022. The Economic Impact of Agribusiness in South Carolina. South Carolina Department of Agriculture, November 2022.
Wen, Christine. 2022. The Revenue Impact of Corporate Tax Incentives on South Carolina Public Schools 2017-2021. Good Jobs First, May 2022.
White House. 2024. Investing in America: South Carolina (fact sheet). June 2024. State Fact Sheets.
WYFF News 4. 2022. “Remaking the Mills: A WYFF 4 Special That Explores the History of Textiles in South Carolina.” October 24, 2022.
Zinn Education Project. n.d. “Jan. 14, 1868: South Carolina Constitutional Convention” (web page). Accessed September 27, 2024.
Zipperer, Ben. 2023. The Impact of the Raise the Wage Act of 2023. Economic Policy Institute, July 2023.
Zuczek, Richard. 2016. “Black Codes” (web page). South Carolina Encyclopedia, University of South Carolina, Institute for Southern Studies. Updated July 19, 2022.