Profits and price inflation are indeed linked
Last week, the Bureau of Economic Analysis released data on corporate profits in the second quarter of 2024. Perhaps surprisingly, profit margins still have not started moving meaningfully closer to pre-pandemic norms. Given ongoing debates about the relationship between recent years’ price inflation and corporate profits, this blog post reiterates a few points while incorporating new data.
- A spike in profit margins contributed significantly to inflation in the early part of the pandemic recovery, and likely contributed to even more persistent inflationary pressure by helping spur a countervailing rise in nominal wage growth. For example, rising profits explained well over 40% of the rise in the price level between the end of 2019 and mid-2022, compared with profits normally accounting for about 11-12% of prices.
- The profit spike was overwhelmingly due to pandemic distortions (shifting demand rapidly across sectors) and supply chain snarls (exacerbated by the Russian invasion of Ukraine) that granted many producers temporary monopoly power in key sectors.
- Contrary to many influential economic writers and commentators, it is simply wrong to label the correlation between high profit margins and high inflation as simple evidence of an overheated economy. The overwhelming post-World War II evidence is that profit shares fall, not rise, as economies heat up.
- Corporate power absolutely conditioned how the post-pandemic inflation happened.
- Corporate concentration likely did not increase during the post-pandemic recovery, and concentration over the previous decade was unlikely to by itself explain much of the post-pandemic inflation.
- But the economic and policy context of the post-pandemic recovery saw corporate power dramatically change how it was deployed to maintain and expand profits—instead of suppressing wages, they raised prices. If this episode increases public support for measures that constrain excess corporate power, that would be good even if it has little relevance for inflation in the future.
Corporate profits largely explain the initial rise in inflation
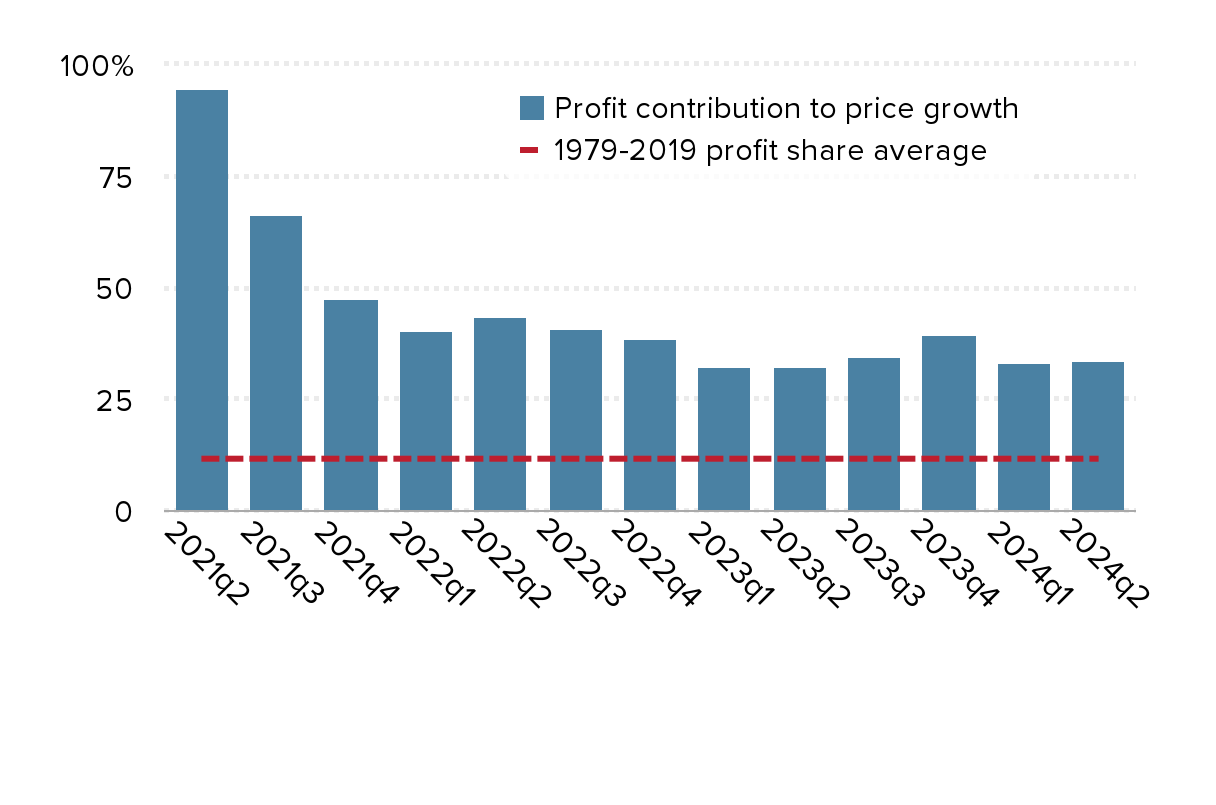
Figure A below shows the share of price increases in the nonfinancial corporate sector that could be accounted for by rising profits, as well as the long-run share of profits in corporate output (a useful benchmark). In each case, the calculation starts from the last quarter of 2019 and moves to the quarter identified in the bar of the chart. This contribution has dropped steadily since 2021 but remains quite high relative to historic norms. Even as of the second quarter in 2024, corporate profits could explain roughly a third of the growth in the price level since the end of 2019, still much higher than the long-run average of just 11.5%.
Corporate profits have contributed disproportionately to price growth since 2019: Share of price growth in the nonfinancial corporate sector accounted for by rising profits since 2019q4
| Year | Profit contribution to price growth | 1979-2019 profit share average |
|---|---|---|
| 2021q2 | 94.5455% | 11.5% |
| 2021q3 | 66.1538% | 11.5% |
| 2021q4 | 47.6744% | 11.5% |
| 2022q1 | 40.3509% | 11.5% |
| 2022q2 | 43.4483% | 11.5% |
| 2022q3 | 40.6452% | 11.5% |
| 2022q4 | 38.6076% | 11.5% |
| 2023q1 | 32.2785% | 11.5% |
| 2023q2 | 32.3353% | 11.5% |
| 2023q3 | 34.6821% | 11.5% |
| 2023q4 | 39.5349% | 11.5% |
| 2024q1 | 33.1395% | 11.5% |
| 2024q2 | 33.5227% | 11.5% |

Note: Author’s analysis of data from Table 1.14 from the National Income and Product Accounts (NIPA) of the Bureau of Economic Analysis (BEA).
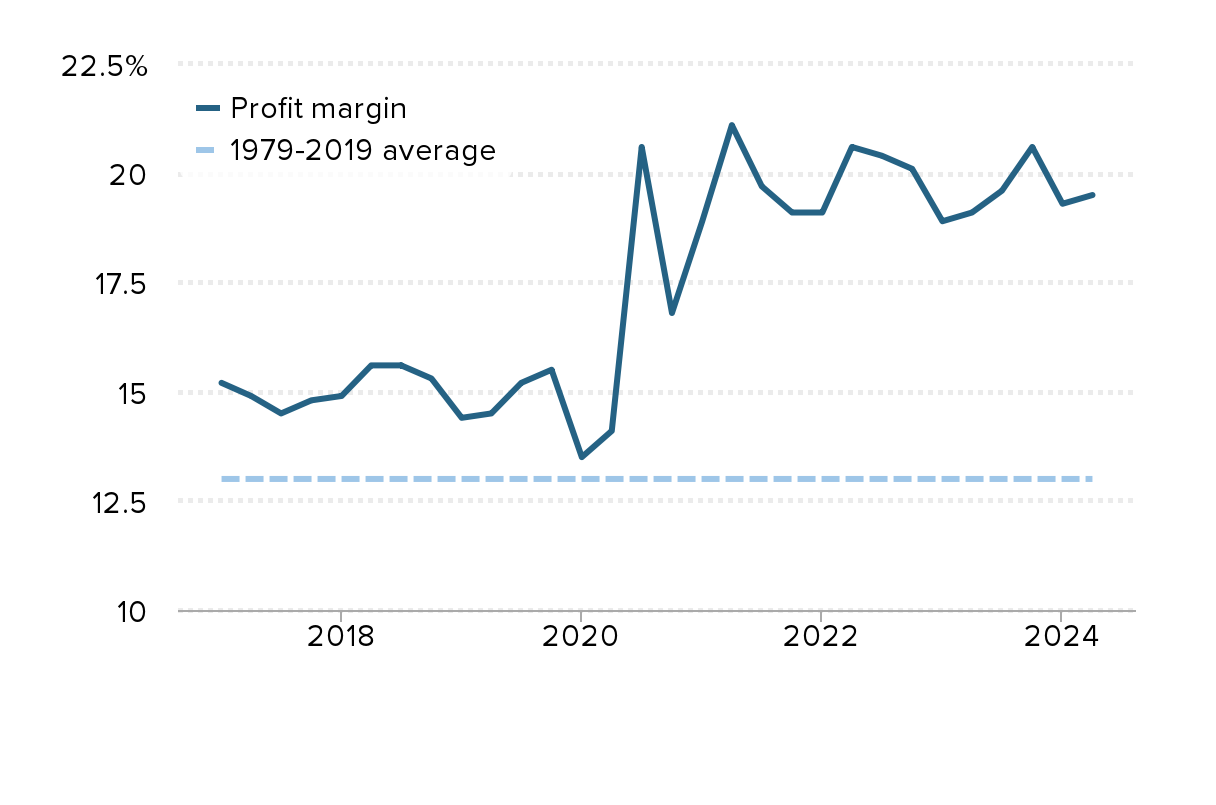
Figure B below highlights how front-loaded the profit spike was in the recovery. It shows a rough measure of profit margins—profits in the nonfinancial corporate sector (NFC) divided by the sum of labor and non-labor costs. This “markup” of profits over other costs rose to historically high levels early in the pandemic recovery. It stopped rising relatively quickly, but still has not retreated all that much from these historic highs. This means that since its peak in mid-2021, profit margins cannot explain much of the subsequent price inflation, but they failed to be a source of disinflationary pressure. If profit margins fall to pre-pandemic norms and this disinflationary pressure does eventually begin, it will be good news for the future path of inflation.
Profit margins spiked and did not normalize until very recently: Profits divided by the sum of labor and non-labor costs in the nonfinancial corporate sector
| Date | Profit margin | 1979-2019 average |
|---|---|---|
| 2017q1 | 15.2% | 13.0% |
| 2017q2 | 14.9% | 13.0% |
| 2017q3 | 14.5% | 13.0% |
| 2017q4 | 14.8% | 13.0% |
| 2018q1 | 14.9% | 13.0% |
| 2018q2 | 15.6% | 13.0% |
| 2018q3 | 15.6% | 13.0% |
| 2018q4 | 15.3% | 13.0% |
| 2019q1 | 14.4% | 13.0% |
| 2019q2 | 14.5% | 13.0% |
| 2019q3 | 15.2% | 13.0% |
| 2019q4 | 15.5% | 13.0% |
| 2020q1 | 13.5% | 13.0% |
| 2020q2 | 14.1% | 13.0% |
| 2020q3 | 20.6% | 13.0% |
| 2020q4 | 16.8% | 13.0% |
| 2021q1 | 18.9% | 13.0% |
| 2021q2 | 21.1% | 13.0% |
| 2021q3 | 19.7% | 13.0% |
| 2021q4 | 19.1% | 13.0% |
| 2022q1 | 19.1% | 13.0% |
| 2022q2 | 20.6% | 13.0% |
| 2022q3 | 20.4% | 13.0% |
| 2022q4 | 20.1% | 13.0% |
| 2023q1 | 18.9% | 13.0% |
| 2023q2 | 19.1% | 13.0% |
| 2023q3 | 19.6% | 13.0% |
| 2023q4 | 20.6% | 13.0% |
| 2024q1 | 19.3% | 13.0% |
| 2024q2 | 19.5% | 13.0% |

Note: Author’s analysis of data from Table 1.14 from the BEA NIPAs.
Corporate profits spiked because of historically large but temporary supply chain disruptions—not an overheated economy
The coincidence of high profit margins and inflation early in the recovery led to many theories about what linked them. The most convincing theories centered on the role of pandemic-era supply disruptions granting some sellers temporary monopoly power that allowed them to raise prices without the normal fear that this would lead to customers flocking to competing firms. This profit shock to prices led to countervailing increased nominal wage demands from workers as they tried to insulate themselves from real income losses.
Further, once the higher profit margins were set, many firms seemingly used the episode to tacitly collude with competitors and keep margins high even as supply disruptions abated and there should have been more price competition between firms. Because collusion and oligopolistic behavior are hard to sustain in normal times, it seemed natural to expect these high profit margins would move back to pre-pandemic norms before too long. But this hasn’t happened yet, which has been a real surprise from this episode.
Many influential economic writers and some economists cast contempt at analyses highlighting the coincidence of high profit margins and fast inflation early in the recovery. While it was possible to overstate the causal chain running from profits to inflation, these writers often made an even worse mistake—proclaiming confidently that high profits are always and everywhere a natural occurrence when the economy heats up (i.e., when measures of aggregate demand catch up to and surpass measures of the economy’s potential output). This just isn’t true. In every single business cycle since World War II, in fact, the opposite pattern has held—as the recovery from recessions sees the economy “heat up” (sees lower rates of unemployment) the profit share falls, not rises.
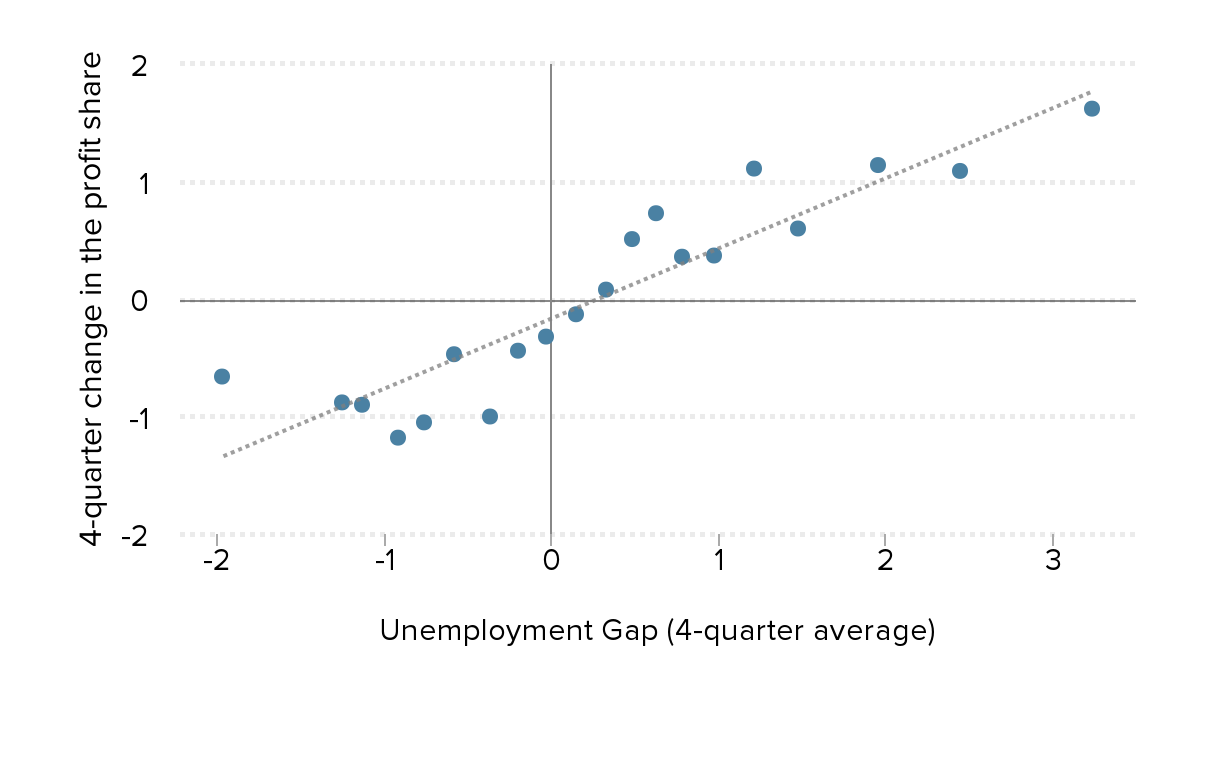
Figure C below shows the one-year change in profit shares and a measure of the economy’s “heat”. Specifically, we calculate the difference between the unemployment rate and estimates of the long-run natural rate of unemployment. This difference is sometimes referred to as the “unemployment gap” and it measures how close actual unemployment is to an estimate of the lowest unemployment rate the economy can sustain without seeing inflation accelerate.
The economy is running hot when this unemployment gap is low (or negative), while the economy is cooling when the gap is high. Using data since 1948, the figure shows a clear and extremely strong positive relationship, with the profit share rising as the economy cools and falling as it heats up. This is exactly the opposite relationship that would hold if the confident proclamations that high profits are simply a sign of a hot economy were true.
Historically, profit shares fall, not rise, when the economy is running hot: One-year change in profit share and the four-quarter average of the unemployment gap
| Unemployment gap | Profit share change |
|---|---|
| -1.97 | -0.66 |
| -1.26 | -0.88 |
| -1.13 | -0.90 |
| -0.92 | -1.18 |
| -0.77 | -1.05 |
| -0.58 | -0.47 |
| -0.37 | -1.00 |
| -0.20 | -0.44 |
| -0.04 | -0.32 |
| 0.15 | -0.13 |
| 0.33 | 0.08 |
| 0.48 | 0.51 |
| 0.62 | 0.73 |
| 0.78 | 0.36 |
| 0.97 | 0.37 |
| 1.21 | 1.11 |
| 1.47 | 0.60 |
| 1.95 | 1.14 |
| 2.44 | 1.09 |
| 3.23 | 1.62 |

Note: Author’s analysis of data from the Bureau of Labor Statistics (unemployment), the Congressional Budget Office (natural rate of unemployment), and the BEA NIPAs (profit share of the corporate sector). Binned scatterplot of regression on four-quarter change in the profit share on the four-quarter average of the unemployment gap, with controls for recessions and business cycle dummy variables.
Besides rebutting claims that high profits are a clear sign that inflation is coming from an overheated economy, this relationship in Figure C should have informed discussions of monetary policy more than it did. It was often claimed in 2022 and early 2023 that the labor market was unambiguously overheated in unprecedented ways. Some measures of the labor market were historically strong—like the record high number of vacancies during this time. But other measures—like real wage growth and the profit share of income—were actually showing values much more consistent with slack labor markets. This should have at least shaken confidence that the labor market needed immediate cooling to normalize inflation, and raised questions about whether very standard macroeconomic reasoning should be applied seamlessly to such a strange period of economic history.
In the end, the macroeconomic lessons to be learned from recent years’ inflation mostly boil down to avoiding mammoth supply disruptions and sectoral shocks. The traditional macroeconomic diagnoses of inflation—monetary and fiscal policies that are too stimulative—explain very little about post-pandemic inflation.
The inflation of 2021-2023 had huge distributional consequences—which means it was indeed about corporate power
Excess corporate power is the backdrop of nearly all economic trends in recent decades. However, for most of the post-1979 period until the pandemic, this corporate power was mostly leveraged to suppress wage growth for workers rather than raising prices charged to customers.
The circumstances of the post-pandemic recovery changed the easiest path to profitability for companies—unit labor costs rose quite fast in historic terms, but profit growth ran faster, and the combination of fast-rising unit labor costs and thickening profit margins led to rapid price inflation. The end result was largely the same as in past recoveries from steep recessions—there was a rapid increase in the share of total income claimed by profits rather than going to workers’ pay.
It should be noted again that not every inflationary episode is associated with this kind of sharp distributional change. As inflation gained momentum steadily through the late 1960s and then spiked sharply in 1973 and 1979, there was no large redistribution toward profits. In the early 1980s, high unemployment led to this redistribution toward profits, but inflation did not. In short, there is something different this time around in the profits/prices interplay, and it deserves more analysis than it has generally gotten.
If this later round of redistribution toward profits helps build support for measures like more robust anti-trust enforcement that tamp down excess corporate power, then some good might result. While it is true that corporate concentration did not directly lead to the inflation of recent years and that corporate power more broadly did not necessarily increase over this period, it is also true that lack of inflation is not a sign that corporate power has been tamed. Again, the 2010s saw extremely subdued inflation even as income was redistributed away from typical workers through wage suppression.
Conclusion
Profits don’t explain everything about recent years’ inflation. But ignoring trends in profits over this time makes inflation analyses much weaker. Further, a future normalization of profit margins could be another key source of disinflationary pressure in coming years.
Enjoyed this post?
Sign up for EPI's newsletter so you never miss our research and insights on ways to make the economy work better for everyone.
