EPI FAQ
While immigration is among the most important issues the country faces, misperceptions persist about fundamental aspects of this crucial topic—such as the size and composition of the immigrant population, how immigration affects the economy and the workforce, the budgetary impact of unauthorized immigration, why increasing numbers of unaccompanied migrant children are arriving at the United States’ Southwest border, and the various facets of U.S. labor migration policy. This FAQ provides essential background on these topics.
The immigrant population
1. How many immigrants reside in the United States?
More than 40 million immigrants resided in the United States as of 2012,1 accounting for about 13 percent of the total U.S. population. Of these roughly 40 million immigrants, slightly less than half (46 percent) are naturalized U.S. citizens.2
2. How many unauthorized immigrants are in the United States?
There were an estimated 11.7 million unauthorized immigrants in the United States as of 2012.3 Unauthorized immigrants account for about 3.7 percent of the total U.S. population and about 5.2 percent of the labor force. Note that unauthorized immigrants are a larger share of the labor force than of the total population because the vast majority of unauthorized immigrants are working-age adults.4
3. Are most immigrants Hispanic/Latino?
Contrary to popular perception, less than half (46 percent) of all immigrants in the United States are Hispanic or Latino. Roughly one-fifth of all immigrants are non-Hispanic white (19.2 percent), about 8 percent are black, and just over a quarter (26.3 percent) are Asian or of some other race/ethnicity.5
When it comes to unauthorized immigrants, the overwhelming majority are indeed Latino—primarily from Mexico and Central America. There are, however, also populations of unauthorized immigrants from Asia, South America, Europe and Canada, and the Caribbean (as shown in Figure A).
Unauthorized immigrant population in the United States, by region of birth, 2008 (in thousands)
| Region of birth | Unauthorized immigrant population |
|---|---|
| Mexico | 7,000 |
| Central America | 1,350 |
| Asia (South and East) | 1,300 |
| South America | 775 |
| Europe and Canada | 525 |
| Caribbean | 500 |
| All other | 300 |
| Middle East | 190 |
Source: EPI replication of tabulations from augmented March 2008 Current Population Survey data in Jeffrey S. Passel and D'Vera Cohn, "Origins of Unauthorized Immigrants: A Focus on Mexico," Pew Hispanic Center, April 14, 2009
Immigrants and the economy
4. How much do immigrants contribute to the economy?
One way to quantify immigrants’ contribution to the U.S. economy is to look at the wages and salaries they earn, as well as the income of immigrant-owned businesses, as a share of all wages, salaries, and business income in the United States. (See Table 1.) For the United States as a whole, immigrants’ share of total output was about 14.7 percent over 2009–2011. Note that this is actually larger than immigrants’ 13 percent share of the population.
Immigrant and U.S.-born shares of total U.S. economic output
| Total wage, salary, and business proprietor income (2011$) |
Share | |
|---|---|---|
| Total population | $5,042,277,015,987 | 100.0% |
| U.S. born | $4,298,840,505,997 | 85.3% |
| Immigrant | $743,436,509,990 | 14.7% |
Note: All figures are in 2011 dollars. Economic output is derived from wages and salary and proprietors' income. The immigrant share is simply the total income from these sources attributable to immigrant workers and business owners. For more details, see http://www.fiscalpolicy.org/FPI_NewAmericansOnLongIsland_20120119.pdf.
Source: EPI analysis of American Community Survey (2009–2011)
Immigrants have an outsized role in U.S. economic output because they are disproportionately likely to be working and are concentrated among prime working ages. Indeed, despite being 13 percent of the population, immigrants constitute 16 percent of the labor force. Moreover, many immigrants are business owners. In fact, the share of immigrant workers who own small businesses is slightly higher than the comparable share among U.S.-born workers. (Immigrants constitute 18 percent of small business owners.)6
5. Are most immigrants employed in low-wage jobs?
In the United States as a whole, there are almost as many immigrants in white-collar jobs (46 percent) as in all other occupations combined. In some states, more than half are in white-collar jobs.7 However, not all white-collar jobs pay well, and the share of U.S.-born workers in white-collar jobs is even higher. Still, the perception that nearly all immigrants work in low-wage jobs is clearly inaccurate.
The same can be seen by looking at immigrants’ levels of educational attainment. While immigrants are less likely than native-born citizens to have gone to college, 46 percent of immigrants have at least some college education.8
Immigrants may be overrepresented in some jobs and underrepresented in others, but the difference between the U.S.- and foreign-born shares is rarely as dramatic as is often assumed. Immigrants are strongly represented in some high-wage jobs, and play a significant role in many middle-wage jobs. For example, 22 percent of dental, nursing, and health aides are immigrants, as are 31 percent of computer software developers—well above immigrants’ 16 percent share of the labor force.9 While immigrants are overrepresented in low-wage occupations, immigrants are a part of the top, middle, and bottom of the economic ladder.
6. Are most immigrants poor?
Nationally, and in many states, the income of immigrant families is not very different from that of non-immigrant families, although individual earnings are lower for immigrants overall. This is because there are typically more workers per immigrant family.
Although most immigrants are not poor, nationally 20 percent live below the poverty line, compared with 16 percent of native-born citizens.10
7. Do immigrants take jobs away from American workers?
There is broad agreement among academic economists that in the long run, immigration has a small but positive impact on the labor market outcomes of native-born workers, on average.11 There is some debate about whether, within the overall small positive effect, certain subgroups are harmed, in particular native-born workers with low levels of education.
The evidence shows that in the long run, immigrants do not reduce native employment rates. But some evidence suggests that in the short run, immigration may slightly reduce native employment, because the economy takes time to adjust to new immigration. Importantly, this effect varies according to the broader economic environment. In particular, when the economy is growing and the labor market is adding jobs, new immigration creates enough jobs even in the short run (and even for the less-educated) to cause no harm to the net employment of native-born workers. But during economic downturns, things do not adjust as quickly. When the economy is weak, new immigration has a small negative impact in the short run on the employment of native-born workers.12
The United States could benefit enormously from an immigration system that is more responsive to broader economic conditions. In our current immigration system, legal immigrant flows are essentially unresponsive to the business cycle. In particular, Congress has set a yearly limit on the number of new permanent and temporary immigrants who may enter the country legally in order to work, and these limits do not fluctuate based on the state of the labor market. For example, in 2010, the unemployment rate in construction was over 20 percent, but the Department of Labor nevertheless certified thousands of temporary foreign worker visas for the construction industry.
An independent federal agency should be established to evaluate the U.S. labor market and make annual recommendations to Congress on the levels of permanent and temporary immigrant labor. This would better allow the U.S. economy to respond to the needs of employers during expansions while avoiding adding too many additional workers to the labor market when the unemployment rate is high.
8. Does immigration depress wages for American workers?
The most rigorous work on the effect of immigration on wages finds extremely modest effects for native-born workers, including those with low levels of education.
Table 2 is from a paper showing immigration’s relative impact on wages from 1994 to 2007 by gender and education for both U.S.-born and foreign-born workers.13 The first three columns show the impact on native-born workers by gender and education, and the next three columns show the impact on earlier immigrants by gender and education.
Impact of immigration on wages, by education level, 1994–2007
| U.S. born | Immigrants | All | |||||||
|---|---|---|---|---|---|---|---|---|---|
| Low | High | Typical | Low | High | Typical | Low | High | Typical | |
| Female | |||||||||
| Less than high school | 0.6% | 1.7% | 1.1% | -1.8% | -3.1% | -2.5% | 0.1% | 0.6% | 0.3% |
| High school | 1.5 | 1.2 | 1.1 | -1.0 | -3.9 | -2.6 | 1.3 | 0.8 | 0.9 |
| Some college | 0.1 | 0.4 | 0.3 | -2.5 | -4.8 | -3.6 | -0.1 | 0.1 | 0.1 |
| College | -0.4 | 0.2 | 0.0 | -5.1 | -9.3 | -7.1 | -0.8 | -0.7 | -0.7 |
| All | 0.3 | 0.6 | 0.4 | -3.2 | -6.3 | -4.7 | 0.0 | 0.0 | 0.0 |
| Male | |||||||||
| Less than high school | -1.5% | 0.5% | -0.2% | -4.3% | -5.1% | -4.4% | -2.3% | -1.0% | -1.4% |
| High school | -0.5 | -0.2 | -0.2 | -4.2 | -7.7 | -5.8 | -0.8 | -0.7 | -0.6 |
| Some college | 1.0 | 1.0 | 0.9 | -1.4 | -3.9 | -2.7 | 0.8 | 0.7 | 0.7 |
| College | 0.6 | 0.8 | 0.7 | -2.8 | -6.2 | -4.6 | 0.3 | 0.2 | 0.2 |
| All | 0.3 | 0.6 | 0.4 | -3.1 | -5.9 | -4.5 | 0.0 | 0.0 | 0.0 |
Note: The different sets ("low," "high," and "typical") reflect the fact that for each relevant elasticity (the effect on wages from an increase in immigration), there is a range of estimates in the labor literature. The column “low” assumes that the substitutability of workers in different education categories is at the low end of the range, and that the substitutability of natives and immigrants within the same education/experience class is at the high end of the range, both of which will give the gloomiest outlook for the effect of immigration on the wages of natives with low levels of schooling. Conversely, the column “high” assumes that the substitutability of workers in different education categories is at the high end of the range, and that the substitutability of natives and immigrants within the same education/experience class is at the low end of the range, both of which will give the rosiest outlook for the effect of immigration on the wages of natives with low levels of schooling. The column “typical” assumes a typical set of elasticities, neither at the high end or low end of their respective ranges, and these columns represent the estimates we believe to be the most accurate.
Source: Adapted from Table 4 in Heidi Shierholz, Immigration and Wages: Methodological Advancements Confirm Modest Gains for Native Workers, Economic Policy Institute Briefing Paper #255, February 4, 2010
The salient point here is that earlier immigrants are the group that is most adversely affected by new immigration. This is because they are often the most substitutable for new immigrants, often living in the same places and possessing similar skills. But for native-born workers, the effects tend to be very small, and on average, modestly positive.14 This is useful for reminding policymakers that native-born workers have little to fear as far as immigration’s labor market impact is concerned.
And to the extent there is something to fear, it stems from not providing legal status to unauthorized immigrants, and from guestworker programs where workers have limited rights and are tied to one employer. A useful framework for thinking about this is that any situation where workers’ individual bargaining power is reduced is going to put downward pressure on their wages, and therefore also on the wages of workers in similar occupations and industries.
For example, temporary foreign workers (also commonly referred to as “guestworkers”) who don’t have the legal right to change employers have greatly reduced bargaining power; if their employer treats them badly their only recourse is to leave the country, and many incurred a great deal of debt to get here. Additionally, “prevailing” wage rules in guestworker programs often allow guestworkers’ employers to pay them a lower wage than the market rate. In short, these workers’ lack of bargaining power—their weak position—puts downward pressure on the wages and working conditions of native- and foreign-born workers alike in the occupations and in the places where guestworkers are present.
For unauthorized immigrants it’s a similar story: They have essentially no bargaining power and virtually no labor or employment rights. If they complain about workplace safety violations or being paid less than the minimum wage, for example, an employer can fire them or threaten them with deportation. That puts downward pressure on the wages and working conditions of workers—both native- and foreign-born—in the occupations and in the places where unauthorized workers are present. Bringing these workers out of the shadows will be better not just for the workers themselves, but also those native-born workers who are similarly situated.
Unauthorized immigrants
9. Do unauthorized immigrants increase budget costs for states or the federal government?
There is a fairly broad consensus that the present value of the long-run net fiscal impact of unauthorized immigration, at all levels of government combined, is small but positive—meaning that immigration reduces overall budget deficits.15 The long-run fiscal impact at the federal level is strongly positive; however, the impact at the state and local levels is negative. There is also a clear understanding that while the negative state and local impacts are largely concentrated in the states and localities that receive most of the new immigrants, the federal impact is shared evenly across the nation.
Unauthorized immigrants are a net positive for public budgets because they contribute more to the system than they take out.16 Unauthorized immigrants generally cannot receive benefits from government programs, except in some cases, such as when unauthorized immigrant children receive public education, and in some states that allow unauthorized immigrants to attend state colleges at in-state tuition rates. Nevertheless, most of these unauthorized immigrants will still pay taxes. The vast majority pay sales taxes in states with sales taxes, and property taxes through properties that they own or rent. Additionally, most unauthorized immigrant workers also pay payroll and income taxes. The Social Security Administration estimates that 75 percent of unauthorized immigrants are actually on formal payrolls, either using fraudulent Social Security numbers or Social Security numbers of the deceased.17 Unauthorized immigrants pay into Social Security via automatic payroll deductions, but they can never claim Social Security benefits. In 2005, it was estimated that unauthorized immigrants paid about $7 billion per year in Social Security taxes that they will never be able to reclaim.18
Unauthorized immigrants are also unlikely to receive any income credits available through the tax code, or to receive a tax refund if they overpaid in their regular payroll withholdings. The Tax Policy Center estimates that 78 percent of American households that earned less than $33,000 owed no federal income taxes in 2011.19 Many low-income taxpayers only paid marginal amounts if they did owe. Because of their low income levels, most unauthorized immigrants would likely fall into either of these categories. A significant portion of unauthorized immigrants file taxes using Individual Taxpayer Identification Numbers (ITINs);20 however, many unauthorized immigrants don’t file because they fear deportation. If they don’t file, they are never refunded money that was automatically withheld from their paychecks.
10. Do unauthorized immigrants use public support programs like welfare, unemployment insurance, and food stamps?
While it is possible that an unauthorized immigrant could benefit from a U.S. citizen or legal permanent resident family member receiving income support through a federal or state program, unauthorized immigrants themselves by and large are ineligible for such programs because of their immigration status.
11. Couldn’t we just deport the 11.7 million unauthorized immigrants?
Aside from the astronomical costs it would impose21 and the fact that it’s likely to be a logistical impossibility, it would actually hurt, not help, the economy and the jobs situation. The key intuition here is that while unauthorized immigrant workers add to the supply of labor, they also consume goods and services, thereby generating economic activity and creating jobs. One way to think of this is to remember that the labor force is growing all the time due to both immigration and native-born population growth, and that’s okay, because the economy expands too. We all understand this intuitively; that’s why we don’t worry when a new graduate enters the labor force. We know those new graduates buy food and cars and clothes and pay rent. By the same token, unauthorized immigrants are not just workers, they are also consumers. We could remove them, which would indeed reduce the number of workers, but it would also reduce the jobs created by the economic activity they generate. So the right choice is to bring the unauthorized immigrants who are already here out of the shadows so they can help the country realize its economic potential.
12. Should we wait until the economy has recovered before regularizing the unauthorized immigrant population?
No, this is precisely the time we should regularize the country’s 11.7 million unauthorized immigrants by providing them legal status and a path to citizenship; it would actually be good for the economy and generate jobs. Providing legal status and citizenship enables unauthorized immigrants to produce and earn significantly more than they do when they are working without legal rights or protections and in constant fear of deportation. Their resulting productivity and wage gains ripple through the economy because immigrants are not just workers—they are also consumers and taxpayers. In particular, they will spend their increased earnings on items like food, clothing, housing, cars, and computers. That spending, in turn, will stimulate demand for more goods and services, which will create the need for more workers. In other words, it will create jobs.
Unaccompanied migrant children
13. Why are tens of thousands of unaccompanied migrant children from Central America showing up on the Southwest U.S. border?
Tens of thousands of migrant children (or minors) from Mexico and Central America arrive at the Southwest border every year without a parent or guardian, but more recently, they have been arriving in increasing numbers from the Northern Triangle of Central America: El Salvador, Guatemala, and Honduras. These unaccompanied children are often referred to by the acronym “UAC,” for “unaccompanied alien child.” According to the United Nations High Commission for Refugees and various other sources, some of the principal reasons for their arrival are violence and criminality in their home countries22 (El Salvador, Guatemala, and Honduras have some of the highest homicide rates in the world),23 including being forced to join criminal gangs under threat of violence or death;24 false rumors that children will receive some sort of legal status if they show up on the border and turn themselves in to immigration authorities; and the desire to reunite with family members living in the United States.25
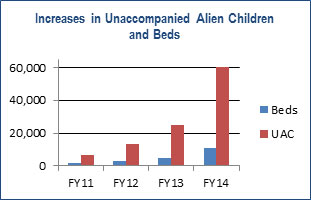
14. How many unaccompanied migrant children have arrived from Central America and Mexico in the past few years?
Since 2011, a rapidly increasing number of unauthorized unaccompanied migrant children from El Salvador, Guatemala, and Honduras have arrived at the Southwest U.S. border and been apprehended by the Border Patrol. As shown in Table 3, between October 2013 and June 2014, approximately 39,000 arrived.26 The total from these three countries has doubled each year since 2011. If Mexico is included in the total so far for fiscal 2014, the number of UACs apprehended is over 51,000 (although the number of Mexican UACs arriving has not been increasing over the same period).
Unaccompanied alien children encountered, by fiscal year, fiscal 2009–2014*
| Native country | Fiscal 2009 | Fiscal 2010 | Fiscal 2011 | Fiscal 2012 | Fiscal 2013 | Fiscal 2014* |
|---|---|---|---|---|---|---|
| El Salvador | 1,221 | 1,910 | 1,394 | 3,314 | 5,990 | 11,436 |
| Guatemala | 1,115 | 1,517 | 1,565 | 3,835 | 8,068 | 12,670 |
| Honduras | 968 | 1,017 | 974 | 2,997 | 6,747 | 15,027 |
| Mexico | 16,114 | 13,724 | 11,768 | 13,974 | 17,240 | 12,146 |
* Data for fiscal 2014 are through June 15.
Source: Adapted from U.S. Customs and Border Protection, “Southwest Border Unaccompanied Alien Children,” July 2014
15. Is the United States the only country that Salvadorians, Guatemalans, and Hondurans are fleeing to?
No, the increased inflow of Central Americans from Northern Triangle countries is not unique to the United States. Between 2009 and 2013, Mexico, Panama, Nicaragua, Costa Rica, and Belize collectively saw a 712 percent increase in the number of asylum claims filed by nationals of El Salvador, Guatemala, and Honduras.27 This is strong evidence that—apart from the false rumors of relaxed treatment in the United States—people are desperate to escape these countries, and are seeking protection throughout the region.
16. Does the arrival of unaccompanied migrant children mean the U.S. border is not secure?
Unaccompanied migrant children by and large are not evading U.S. immigration authorities and continuing into the interior of the United States. They are either being apprehended or voluntarily turning themselves in to the U.S. Border Patrol, which must then turn them over within 72 hours to the custody of the Office of Refugee Resettlement within the U.S. Department of Health and Human Services if they are not from Canada or Mexico. As a result, proposals to further fortify the Southwest border with more manpower, for instance by deploying National Guard troops, are likely to have little or no impact on the flow of unaccompanied migrant children or on safety near the border.28
17. What happens to these unaccompanied migrant children? Do we just send them home?
Under a 2008 anti–human trafficking law, unaccompanied migrant children who are apprehended at the border are treated differently depending on whether they are from a country that is contiguous to the United States. UACs from Canada and Mexico may be removed without a hearing in immigration court, after a determination by a Customs and Border Protection officer. However, those from countries other than Canada and Mexico are turned over to the Department of Health and Human Services within 72 hours and put into standard deportation proceedings, which include a hearing before an immigration judge. While the law allows any person with a case before the immigration court to be represented by an attorney, the law does not require that all unaccompanied children have an attorney in court, nor does the law provide the funding to pay for an attorney. As a result, while unaccompanied migrant children are provided with advice from an advocate, only some receive legal representation, either from an attorney providing services pro bono, or because the child (or someone paying on his or her behalf) can afford an attorney. Many children are left with no choice but to represent themselves at their own deportation hearings. A judge then determines whether the child is entitled to some form of immigration relief, including a T visa (for victims of trafficking), U visa (for victims of certain crimes), the granting of asylum, or Special Immigrant Juvenile status (which leads to permanent residence). But if the child is not found to be eligible for any U.S. immigration status or deferred action, the child may be removed to his or her country of origin.
18. Is the U.S. immigration system equipped to handle the increased flow of unaccompanied migrant children?
Two aspects of the U.S. immigration system have been exposed as ill-equipped to manage the increase in unaccompanied migrant children.
First, the United States does not have an adequate number of facilities that can house the current elevated level of UACs. UACs are detained by Customs and Border Protection for up to 72 hours. During this period, overcrowding has led to many being detained in prisons or military bases, often in unacceptable conditions.29 After being turned over to the Office of Refugee Resettlement in the Department of Health and Human Services (HHS), the vast majority of UACs are released by HHS to a relative or family friend while they await their hearing before an immigration judge. But those without a family member to care for them are put into foster care or housed in long-term care facilities managed by HHS. HHS facilities only have enough beds to accommodate 6,000 to 8,000 children at any one time,30 which is far from enough, leading HHS to house many in makeshift shelters such as Army Reserve facilities.31
Second, U.S. immigration courts are also proving to be inadequate, underfunded, and understaffed. The immigration court system only employs 243 immigration judges, while currently having a backlog of 375,500 cases.32 As a result, the average wait time for a hearing in immigration court is 587 days.33 Central American UACs are entitled to a hearing in immigration court under U.S. law to determine whether they qualify for an immigration status or if they will be repatriated to their home country, which can result in UACs residing in the United States for years before their cases are resolved. The Obama administration has indicated that UAC hearings will now be moved to the front of the line,34 which is helpful for individual UACs but does not remedy the shortage of immigration judges or the long wait times for other immigrants awaiting a hearing in immigration court. The court system also does not have funds to provide every UAC with legal counsel and representation during court proceedings, nor does the law require it.
Labor migration
19. Which legal routes are available to immigrants seeking to work in the United States?
Foreign-born workers may enter the United States for work through a number of temporary and permanent visa programs. Temporary visas are also known as “nonimmigrant” visas, many of which grant the worker legal status and work authorization for a set period of time and usually for a specific employer, and none of which automatically lead to permanent residence and naturalization (citizenship). “Employment-based” immigrant visas, on the other hand, grant the worker legal permanent resident (LPR) status, and in most cases a U.S. employer must petition for the visa on behalf of the worker. An employment-based immigrant visa holder can obtain citizenship after remaining in LPR status for 5 years and meeting certain other requirements.
Foreign-born persons who enter the United States lawfully after being granted an immigrant visa by virtue of being granted refugee status, a diversity (lottery) visa, or because of a family relationship they have with a U.S. citizen or legal permanent resident, may also seek employment and be hired with almost any employer (except for positions that require citizenship; for example, certain positions that require a high level of security clearance). Although these categories of immigrant visas permit employment, they are not considered to be “employment-based” visas because the foreign-born worker is not coming to the United States to work in a particular position for a specified employer, nor do they fall under the annual numerical limitations on employment-based visas.
20. What are the different classifications of employment-based (EB) immigrant visas?
There are five classifications of employment-based (EB) immigrant visas (referred to as “preferences” in U.S. immigration law):
- Employment-based first preference (EB-1): Priority workers (persons with extraordinary ability in the sciences, arts, education, business, or athletics; outstanding professors and researchers with at least three years of experience in teaching or research, who are recognized internationally; multinational managers or executives)
- Employment-based second preference (EB-2): Professionals with advanced degrees, and persons with exceptional ability
- Employment-based third preference (EB-3): Skilled workers, professional and other (lesser-skilled, non-professional) workers
- Employment-based fourth preference (EB-4): Certain special immigrants (religious workers, broadcasters, Iraqi/Afghan translators, Iraqis who have assisted the United States, international organization employees, physicians, armed forces members, Panama Canal Zone employees, retired NATO-6 employees, spouses and children of deceased NATO-6 employees)
- Employment-based fifth preference (EB-5): Immigrant investor program participants35
21. What are the annual numerical limits on EB immigrant visas?
As specified in U.S. law, a total of 140,000 EB visas may be granted each fiscal year. Each EB classification has its own annual numerical limit:
- EB-1: 40,040
- EB-2: 40,040
- EB-3: 40,040
- EB-4: 9,940
- EB-5: 9,940
There are also per-country numerical limits. No more than 7 percent of the total of EB immigrants in a fiscal year may originate from any single country. This limit is designed to preserve diversity among incoming immigrants by preventing any particular immigrant group from dominating the annual flow of immigrants.
In addition, it is important to note that immediate family members (spouses and children) of principal EB immigrants who are granted an immigrant visa count against the numerical limits in the EB category. This means that every year approximately half of EB immigrant visas are issued to the family members of principal EB immigrants.
22. What are the different classifications of nonimmigrant visas that permit employment in the United States?
According to the Congressional Research Service, the United States currently has “24 major nonimmigrant visa categories, and 87 specific types of nonimmigrant visas.”36 Many, but not all, classifications permit the nonimmigrant beneficiary to be employed. Some are known as traditional work visas, especially those in the “H” category, some of which (but not all) require that an employer first attest or certify that there are no available U.S. workers. TN visas (for Canadian and Mexican professionals) and L-1 visas (for intracompany transfers, specifically managers, executives, and employees with “specialized knowledge”) are also typical work visas, but do not require any form of labor certification or attestation. Other visa classifications permit employment but may be granted ostensibly for another purpose (for instance, for university-level studies or to facilitate an international cultural exchange). Table 4 displays some of the most common nonimmigrant visa classifications that permit employment, along with a general description and examples of typical occupations under each.
Description and typical occupations of common nonimmigrant visa classifications that authorize employment
| Visa classification | Description | Typical occupations |
|---|---|---|
| Traditional work visas | ||
| H-1B | Specialty occupations that require a college degree or its equivalent | Computer and information technology, accountants, physicians, nurses, teachers |
| H-2A | Seasonal agricultural occupations | Fruit and vegetable crop farming, tobacco farming, shepherding |
| H-2B | Seasonal non-agricultural occupations that do not require a college degree | Landscaping and groundskeeping, forestry, housekeeping, construction, seafood processing |
| L-1 | Intracompany transfers, either managers and executives or employees with “specialized knowledge” | Corporate managers and executives, information technology occupations |
| O-1 | Persons with extraordinary ability in the sciences, art, education, business, or athletics | |
| P-1 | Internationally recognized athletes or members of entertainment groups; essential support personnel | Professional athletes, professional and well known entertainers, circus performers and their staff, other support staff |
| TN | Canadian and Mexican professionals (visa created by North American Free Trade Agreement) | Accountants, architects, economists, lawyers, pharmacists, teachers |
| Other visa classifications that permit up to full-time employment |
||
| F-1 | Foreign university students | Various on-campus occupations, information technology occupations (especially in the Optional Practical Training program) |
| A-3 | Attendants, servants, or personal employees of diplomats, embassy workers, and foreign government officials | Domestic workers |
| G-5 | Attendants, servants, or personal employees of representatives and staffers of international organizations | Domestic workers |
| J-1 | Exchange visitors | Various programs (approximately 15)—such as Summer Work Travel, Intern/Trainee, Camp Counselors, Alien Physicians, and Teachers—permit a wide range of occupations and varying skill levels, including amusement and recreation park workers, lifeguards, housekeepers, teachers, camp counselors, physicians, and farmworkers |
| B-1 | Business visitors (cannot receive remuneration from a U.S. source) | Attending business meetings; maintenance of goods purchased by U.S. company from home country; B-1 in lieu of J-1, or H-1B, or H-3; personal servants of B-1 business visitor |
Source: U.S. Citizenship and Immigration Services website, accessed July 2014; U.S. Department of State website, accessed July 2014; Immigration and Nationality Act § 101(a)(15)
23. What are the annual numerical limits and periods of stay that are allowed on the major nonimmigrant visa classifications that permit employment?
Only a few nonimmigrant visa classifications that permit employment have annual numerical limits set by law. The ones that do are all in the H category. The Summer Work Travel program, one of the (out of approximately 15 total) programs in the J-1 visa Exchange Visitor Program, has an annual limit under a regulation promulgated by the State Department. Each visa classification, because it is temporary, only permits the beneficiary to remain in the United States for a determined period of time, which is set out in law or regulation. Listed in Table 5 are some of the most common nonimmigrant visa classifications that permit employment, with the corresponding annual numerical limit (where applicable), the number of visas that were granted in fiscal 2013, and the period of stay in the United States that each visa classification authorizes.
Annual numerical limit, number of visas granted in fiscal 2013, and period of stay for the most common nonimmigrant visa classifications that permit employment
| Visa classification | Annual numerical limit | Total visas granted, fiscal 2013 | Period of stay |
|---|---|---|---|
| H-1B | 65,000 (for-profit employers); 20,000 additionally available for workers possessing master’s degree and working for a for-profit employer; no annual limit for non-profit and research organizations | 153,223 | Six years; renewable annually until a permanent residence visa becomes available, if employer has petitioned for an immigrant visa or filed for permanent labor certification |
| H-2A | No annual limit | 74,192 | Typically 10 months, but also renewable in one-year increments up to three years |
| H-2B | 66,000 | 57,600 | Typically 10 months, but also renewable in one-year increments up to three years |
| L-1 | No annual limit | 66,700 | Seven years for managers and executives (L-1A); five years for employees with “specialized knowledge” (L-1B) |
| O-1 | No annual limit | 12,359 | Up to three years; renewable in one-year increments at U.S. Citizenship and Immigration Services discretion |
| P-1 | No annual limit | 23,269 | 10 years for athletes and essential support personnel |
| TN | No annual limit | 9,548 | Up to three years; may petition for extension or depart U.S. and apply for new three-year period |
| F-1 | No annual limit | 534,320; 123,328 for OPT | Duration of academic program; one year of OPT; 29 months for OPT with qualifying STEM degree |
| A-3 | No annual limit | 1,135 | Initially valid for up to three years, and may be extended in two-year increments. However, Department of State practice is to issue for a maximum period of 24 months, and the visa is renewable. Overall, length of stay may not exceed that of the employer. |
| G-5 | No annual limit | 736 | Initially valid for up to three years, and may be extended in two-year increments. However, Department of State practice is to issue for a maximum period of 24 months, and the visa is renewable. Overall, length of stay may not exceed that of the employer. |
| J-1 | No annual limit, except in Summer Work Travel (SWT) program (109,000) | 312,522; 91,763 for SWT (fiscal 2012) | Duration of program; four months for SWT; 12 months for interns; 18 months for trainees, three years for teachers |
| B-1 | No annual limit | 41,956 | Duration of visa approved by State Department; admission normally valid for six months |
Source: U.S. Citizenship and Immigration Services website, accessed July 2014; U.S. Department of State, “Nonimmigrant Visa Statistics”; U.S. Department of State, “J-1 Visa Basics: Facts and Figures”; U.S. Department of State, Foreign Affairs Manual; Immigration and Nationality Act
24. Are employers required to pay temporary foreign workers the minimum wage?
Regardless of employees’ immigration status, employers must abide by the rules set out in the Fair Labor Standards Act (and its implementing regulations), which include the federal minimum wage and overtime pay requirements for most workers in the United States, as well as any applicable state and local wage and hour laws. However, some occupations filled by temporary foreign workers are exempt from the state or federal minimum wage (for example, if they work for an amusement park that is only open seasonally).
Three programs in the H category require employers to pay a “prevailing” or “adverse effect” wage rate. This is because under U.S. laws and regulations, the wages and working conditions of foreign workers in these programs are prohibited from adversely affecting the wages and working conditions of U.S. workers. Nevertheless, it should be noted that in practice, in some cases prevailing wage rules may result in allowing employers to pay their temporary foreign workers less than the true market rate. In the H-1B and H-2B programs (which concern, respectively, specialty occupations that require a college degree or its equivalent, and seasonal nonagricultural occupations not requiring a college degree), Department of Labor and Department of Homeland Security regulations set out the rules for the prevailing wage levels. The H-2B program currently requires that the average wage in the occupation and local area be paid to the worker (unless a collective bargaining agreement applies), while the H-1B program sets four wage levels that are intended to correspond with each foreign worker’s education and experience. The required wage levels are based on Occupational Employment Statistics survey data published by the Bureau of Labor Statistics (with an exception being in the H-2B program, where employers may instead have an alternate wage approved based on a privately conducted wage survey).
Under Department of Labor regulations, the H-2A program (which concerns seasonal agricultural occupations) requires employers to pay the highest of the “adverse effect wage rate” (AEWR), the prevailing piece rate (i.e., the payment received per piece of fruit or vegetable picked), an agreed-upon collectively bargained wage (if applicable), or the federal or state minimum wage. Farmworker Justice, an advocacy organization that works on behalf of the interests of farmworkers, explains that the AEWR is “the regional weighted average hourly wage rate for field and livestock workers combined, as measured by the Department of Agriculture’s (USDA) annual Farm Labor Survey of nonsupervisory farm and ranch workers.”37
25. Can temporary foreign workers switch employers?
In most cases, temporary foreign workers cannot switch to another employer while retaining a valid visa status. This is because the employer petitions the U.S. government for the visa that is granted to the foreign worker; in that sense, the employer controls or “owns” the visa. In most visa programs, if a temporary foreign worker is fired from his or her job before he or she can obtain another valid visa status under a different classification or a new visa in the same classification, the worker becomes removable from the United States (this is especially true in the H visa programs).
There are some classifications where a temporary foreign worker may switch employers. These include the H-1B visa (for those in specialty occupations requiring a college degree or its equivalent), the Optional Practical Training program (for foreign university students with F-1 visas), and the J-1 visa (for exchange visitors). However, doing so requires a new employer and preapproval from the government (or a sponsor agency in the case of J-1 exchange visitors). Some nonimmigrant visa classifications, for example the L-2 and J-2 (for spouses of L-1 intracompany transferees and J-1 exchange visitors, respectively), may be employed without being tied to a particular employer.
26. Which regions and countries do permanent immigrant workers come from?
In fiscal 2013, a majority of immigrants receiving lawful permanent resident status in the employment-based (EB) preference categories came from Asia, followed by Europe, North America, South America, Africa, and Oceania, as shown in Table 6.
Number of permanent, employment-based immigrant visas granted, by immigrants' region of birth, fiscal 2013
| Region of birth of employment-based immigrant visa beneficiaries |
Number of employment-based immigrant visas issued |
|---|---|
| Asia | 101,860 |
| Europe | 21,806 |
| North America | 18,676 |
| South America | 11,833 |
| Africa | 5,605 |
| Oceania | 1,201 |
| Unknown | 129 |
| Total | 161,110 |
Source: U.S. Department of Homeland Security, Office of Immigration Statistics, "Table 10. Persons Obtaining Lawful Permanent Resident Status by Broad Class of Admission and Region and Country of Birth: Fiscal Year 2013"
In fiscal 2013, the top country of birth for immigrants receiving lawful permanent resident status in the employment-based preference categories was India, followed by China, South Korea, the Philippines, and Mexico. The top 15 countries of birth of EB immigrant visa beneficiaries in 2013 are listed in Table 7.
Number of permanent, employment-based immigrant visas granted, by immigrants' country of birth, fiscal 2013
| Country of birth of employment-based immigrant visa beneficiaries |
Number of employment-based immigrant visas issued |
|---|---|
| India | 35,720 |
| China | 20,245 |
| South Korea | 14,300 |
| Philippines | 10,482 |
| Mexico | 8,066 |
| Canada | 6,120 |
| United Kingdom | 5,948 |
| Venezuela | 3,000 |
| Brazil | 2,801 |
| Pakistan | 2,553 |
| Taiwan | 2,353 |
| Japan | 2,343 |
| France | 2,086 |
| Germany | 1,927 |
| Colombia | 1,812 |
Source: U.S. Department of Homeland Security, Office of Immigration Statistics, "Table 10. Persons Obtaining Lawful Permanent Resident Status by Broad Class of Admission and Region and Country of Birth: Fiscal Year 2013"
27. Which regions and countries do temporary foreign workers come from?
The sending countries of temporary foreign workers vary depending on the specific visa classification. According to the State Department, in fiscal 2013 most H-1B workers (those in specialty occupations requiring a college degree or its equivalent) came from Asia (82.3 percent), and about two-thirds of all H-1B workers came from India (65 percent). The next most prevalent sending countries were China (8.2 percent) and Mexico (2.4 percent).38
The vast majority of workers in the H-2A and H-2B programs (for seasonal agricultural occupations and seasonal nonagricultural occupations not requiring a college degree, respectively) came from Mexico—94 percent in the case of the H-2A program and 72.7 percent in the H-2B program. India was the largest sending country in the L-1 intracompany transfer visa program (29.5 percent), and in the J-1 exchange visitor program, China was the largest sending country (10.9 percent), with Germany the runner up (7.2 percent).39
About the authors
Daniel Costa has been EPI’s director of immigration law and policy research since 2013, having joined EPI in 2010 as an immigration policy analyst. An attorney, his current areas of research include a wide range of labor migration issues, including the management of temporary foreign worker programs, both high- and less-skilled migration, and immigrant workers’ rights. He has an LL.M. in international and comparative law from Georgetown University Law Center and a J.D. in international law from Syracuse University.
David Cooper is an economic analyst with the Economic Policy Institute. He conducts national and state-level research on a variety of issues, including the minimum wage, employment and unemployment, poverty, and wage and income trends. He also provides support to the Economic Analysis and Research Network (EARN) on data-related inquiries and quantitative analyses. David has been interviewed and cited by local and national media for his research on the minimum wage, poverty, and U.S. economic trends. His graduate research focused on international development policy and intergenerational social mobility. He holds a Master of Public Policy degree from Georgetown University.
Heidi Shierholz joined the Economic Policy Institute as an economist in 2007. She has researched and spoken widely on the economy and economic policy as it affects middle- and low-income families, especially in regards to employment, unemployment, labor force participation, compensation, income and wealth inequality, young workers, unemployment insurance, and the minimum wage. Shierholz is a coauthor of The State of Working America, 12th Edition, is a frequent contributor to broadcast and radio news outlets, is regularly quoted in print and online media outlets, and has repeatedly been called to testify in Congress on labor market issues. Prior to joining EPI, Shierholz worked as an assistant professor of economics at the University of Toronto. She holds a Ph.D. in economics from the University of Michigan at Ann Arbor.
Endnotes
1. U.S. Census Bureau, American Community Survey, “Table DP02: Selected Social Characteristics in the United States,” 2012.
2. U.S. Census Bureau, American Community Survey, “Table DP02: Selected Social Characteristics in the United States,” 2012.
3. Jeffrey S. Passel, D’Vera Cohn, and Ana Gonzalez-Barrera, “Population Decline of Unauthorized Immigrants Stalls, May Have Reversed,” Pew Hispanic Trends Project, September 23, 2013, http://www.pewhispanic.org/2013/09/23/population-decline-of-unauthorized-immigrants-stalls-may-have-reversed/.
4. Pew Research Center, “Unauthorized Immigrants: How Pew Research Counts Them and What We Know About Them,” April 17, 2013, http://www.pewresearch.org/2013/04/17/unauthorized-immigrants-how-pew-research-counts-them-and-what-we-know-about-them/.
5. EPI analysis of American Community Survey microdata, pooled sample 2009–2011.
6. EPI analysis of American Community Survey microdata, 2011.
7. EPI analysis of American Community Survey microdata, pooled sample 2007–2011.
8. EPI analysis of American Community Survey microdata, pooled sample 2009–2011.
9. EPI analysis of American Community Survey microdata, pooled sample 2007–2011.
10. EPI analysis of American Community Survey microdata, 2011. Note that poverty rates derived from the American Community Survey are different than the official poverty rate calculated using the Current Population Survey.
11. Adam Looney and Michael Greenstone, “What Immigration Means for U.S. Employment and Wages,” The Hamilton Project, May 2012, http://www.hamiltonproject.org/papers/what_immigration_means_for_u.s._employment_and_wages/.
12. See Giovanni Peri, The Impact of Immigrants in Recession and Economic Expansion, Migration Policy Institute, June 2010, http://www.migrationpolicy.org/research/impact-immigrants-recession-and-economic-expansion; and David Card, “Is the New Immigration Really So Bad?,” NBER Working Paper No. 11547, August 2005, http://www.nber.org/papers/w11547.
13. Heidi Shierholz, Immigration and Wages: Methodological Advancements Confirm Modest Gains for Native Workers, EPI Briefing Paper No. 255, February 4, 2010, http://www.epi.org/publication/bp255/.
14. Heidi Shierholz, Immigration and Wages: Methodological Advancements Confirm Modest Gains for Native Workers, EPI Briefing Paper No. 255, February 4, 2010, http://www.epi.org/publication/bp255/.
15. National Resource Council, “The Future Fiscal Impacts of Current Immigrants,” Chapter 7 in James P. Smith and Barry Edmonston [editors], The New Americans, National Academy Press, Washington, D.C., 1997, http://isites.harvard.edu/fs/docs/icb.topic803549.files/Week%209-November%203/Smith_Future.pdf.
16. Jordan Rau, “Immigrants Contribute More To Medicare Than They Take Out, Study Finds,” Kaiser Health News, May 29, 2013, http://www.kaiserhealthnews.org/Stories/2013/May/29/immigrants-Medicare-health-costs.aspx.
17. Eduardo Porter, “Illegal Immigrants Are Bolstering Social Security With Billions,” New York Times, April 5, 2005, http://www.nytimes.com/2005/04/05/business/05immigration.html?pagewanted=1&_r=3&.
18. Eduardo Porter, “Illegal Immigrants Are Bolstering Social Security With Billions,” New York Times, April 5, 2005, http://www.nytimes.com/2005/04/05/business/05immigration.html?pagewanted=1&_r=3&.
19. Tax Policy Center, “T11-0176 – Baseline Distribution of Tax Units with No Income Tax Liability by Cash Income Percentile; Current Law, 2011,” July 13, 2011, http://www.taxpolicycenter.org/numbers/displayatab.cfm?DocID=3057.
20. Nina Bernstein, “Tax Returns Rise for Immigrants in U.S. Illegally,” New York Times, April 16, 2007, http://www.nytimes.com/2007/04/16/nyregion/16immig.html?pagewanted=print.
21. Marshall Fitz, Gebe Martinez, and Madura Wijewardena, The Costs of Mass Deportation Impractical, Expensive, and Ineffective, Center for American Progress, March 19, 2010, http://www.americanprogress.org/issues/immigration/report/2010/03/19/7470/the-costs-of-mass-deportation/.
22. Tom K. Wong, “Statistical Analysis Shows that Violence, Not Deferred Action, Is Behind the Surge of Unaccompanied Children Crossing the Border,” Center for American Progress, July 8, 2014, http://www.americanprogress.org/issues/immigration/news/2014/07/08/93370/statistical-analysis-shows-that-violence-not-deferred-action-is-behind-the-surge-of-unaccompanied-children-crossing-the-border/.
23. ACAPS, Other Situations of Violence in the Northern Triangle of Central America, May 2014, http://acaps.org/en/news/other-situations-of-violence-in-the-northern-triangle-of-central-america/1.
24. Frances Robles, “Fleeing Gangs, Children Head to U.S. Border,” New York Times, July 9, 2014, http://www.nytimes.com/2014/07/10/world/americas/fleeing-gangs-children-head-to-us-border.html.
25. David Rogers, “Flood of Child Migrants a Neglected Challenge,” Politico, May 28, 2014, http://www.politico.com/story/2014/05/flood-of-child-migrants-a-neglected-challenge-107198.html.
26. U.S. Customs and Border Protection, “Southwest Border Unaccompanied Alien Children,” July 2014, http://www.cbp.gov/newsroom/stats/southwest-border-unaccompanied-children.
27. Washington Office on Latin America, “Three Myths about Central American Migration to the United States,” June 10, 2014, http://www.wola.org/commentary/3_myths_about_central_american_migration_to_the_us.
28. Jon Herskovitz, “Rick Perry Renews Calls For National Guard At U.S.-Mexico Border,” Reuters, July 3, 2014, http://www.huffingtonpost.com/2014/07/04/rick-perry-border_n_5556685.html; Eric Pianin, “Why Perry’s National Guard Border Fix Is Fraught with Danger,” Fiscal Times, July 27, 2014, http://www.thefiscaltimes.com/Articles/2014/07/27/Plans-Send-National-Guard-Border-Spark-Controversy#sthash.TOWXAkv9.dpuf
29. Dara Lind, “14 Facts that Help Explain America’s Child-Migrant Crisis,” Vox, July 16, 2014, http://www.vox.com/2014/6/16/5813406/explain-child-migrant-crisis-central-america-unaccompanied-children-immigrants-daca/in/5577523.
30. Dara Lind, “14 Facts that Help Explain America’s Child-Migrant Crisis,” Vox, July 16, 2014, http://www.vox.com/2014/6/16/5813406/explain-child-migrant-crisis-central-america-unaccompanied-children-immigrants-daca/in/5577523.
31. Jenna Johnson, “Graffiti on Proposed Shelter for Immigrant Children in Maryland: ‘No Illeagles Here,’” Washington Post, July 14, 2014, http://www.washingtonpost.com/local/md-politics/graffiti-on-proposed-shelter-for-immigrant-children-in-maryland-no-illeagles-here/2014/07/14/cc89610a-0b89-11e4-b8e5-d0de80767fc2_story.html.
32. TRAC, “Backlog of Pending Cases in Immigration Courts as of June 2014,” June 2014, http://trac.syr.edu/phptools/immigration/court_backlog/apprep_backlog.php.
33. TRAC, “Average Time Pending Cases Have Been Waiting in Immigration Courts as of June 2014,” June 2014, http://trac.syr.edu/phptools/immigration/court_backlog/apprep_backlog_avgdays.php.
34. Julia Preston, “U.S. Adjusts Court Flow to Meet Rise in Migrants,” New York Times, July 8, 2014, http://www.nytimes.com/2014/07/09/us/us-adjusts-court-flow-to-meet-rise-in-migrants.html.
35. U.S. Citizenship and Immigration Services, “EB-5 Immigrant Investor,” July 3, 2012, http://www.uscis.gov/working-united-states/permanent-workers/employment-based-immigration-fifth-preference-eb-5/eb-5-immigrant-investor.
36. Ruth Ellen Wasem, “U.S. Immigration Policy on Temporary Admissions,” Congressional Research Service, February 28, 2011, http://fas.org/sgp/crs/homesec/RL31381.pdf.
37. Farmworker Justice, “Adverse Effect Wage Rate Rule,” n.d., https://www.farmworkerjustice.org/sites/default/files/AEWR%20Fact%20Sheet.pdf.
38. U.S. Department of State, “Nonimmigrant Visa Statistics,” n.d., http://travel.state.gov/content/visas/english/law-and-policy/statistics/non-immigrant-visas.html.
39. U.S. Department of State, “Nonimmigrant Visa Statistics,” n.d., http://travel.state.gov/content/visas/english/law-and-policy/statistics/non-immigrant-visas.html. This resource also allows you to see how many temporary foreign workers came to the United States, by visa classification and sending country.