Introduction
A recent EPI report surveyed trends in labor force participation in the United States in recent decades. Besides presenting basic facts, the report also reviewed the research literature on the determinants of these trends, and the effects of policy changes. This policy brief focuses on one theme from the report: the need for patience when crafting a response to labor force participation trends. This need for patience applies to two main aspects of crafting policy:
Other briefs, reports, and analysis from this series
Good news and bad news about U.S. labor force participation Many headwinds from the 2010s are gone, but we’re not investing enough in the future
The U.S.-Born labor force will shrink over the next decade Achieving historically ‘normal’ GDP growth rates will be impossible, unless immigration flows are sustained
Job quality is a policy decision Better jobs can spur higher labor force participation for both men and women
Assessing the strength of the labor market Preliminary downward revisions do not necessarily signal a weaker 2024 labor market, but there are warning signs for 2025
Patience in diagnosing determinants of labor force participation trends
A previous wave of research in labor force participation in the mid-2010s came to erroneous and overly pessimistic conclusions simply because it examined a period when the economy was still cyclically depressed. The labor market still had excess slack from the collapse in aggregate demand that caused the Great Recession of 2008–2009. Once this slack was mostly wrung out of the labor market by the late 2010s (and the mid-2020s), many key measures of labor force participation began improving (with a substantial lag). An analogy to the mistake of trying to diagnose structural trends in the economy when it was still plagued by cyclical weakness would be trying to assess how effectively a marathon runner had been training for the past year by timing a race run when they were still recovering from a bad flu.
Patience in allowing for reasonable lags between the implementation of policies and positive results from those policies
As noted above, labor force participation rates are some of the last macroeconomic variables to recover fully from a cyclical downturn—responding with a considerable lag even to short-run changes in the macroeconomy. Further, because labor force participation is positively linked to workers’ skills and credentials, durably boosting economywide participation rates requires a broad and long-lived investment in these skills and credentials. This obviously takes time. In fact, the most promising interventions to raise labor force participation in the long run are likely significant investments in the health and education of today’s children. The payoff to this investment (even in narrow labor force participation terms) is significant and large but will obviously take a substantial amount of time to fully realize—even decades—as childen grow to adulthood and participate in the labor force.
Patience in diagnosis
Economic researchers are often interested in disentangling structural from cyclical effects on various outcomes. For example, in 2000 the unemployment rate averaged 4%, and in 2010 it averaged 9.6%. Researchers might want to know how much of the higher unemployment rate in 2010 was driven simply by the economy being in a different phase of the business cycle in 2010 versus how much was driven by long-running structural forces on the labor market that were unrelated to the business cycle. In theory, drivers of long-running structural trends might include changes in technology that displaced workers or changes in the age structure or educational attainment of the population.1 In regard to 2000 and 2010, however, all of the difference in unemployment rates between those years can be accounted for by cyclical factors: In 2000 the economy was booming with strong aggregate demand, and in 2010 the labor market was in recession and economywide spending was extremely weak. 2
In practice, the easiest way to disentangle structural from cyclical factors in driving trends in economic variables is to look at changes in these variables from business cycle peak to business cycle peak, essentially measuring outcomes only when something close to full employment had been reattained. In the 2010s, many researchers made premature declarations about structural trends about U.S. labor force participation because they did not wait until a business cycle peak was reached to compare with past peaks. This led to misleading conclusions.
The long tail of the Great Recession and why it led to pessimistic forecasts of labor force participation
In 2008, the United States entered what was then its worst economic crisis since the Great Depression—often referred to as the “Great Recession.” The unemployment rate rose to 10% in 2009 and remained above its 2007 average for the next decade. Despite clear evidence that economic growth remained demand-constrained and that the labor market was characterized by substantial slack even as late as 2015, a number of studies were published in the 2010s, aiming to assess structural trends in labor force participation. When these studies included post-2008 data points and assumed these data points were indicative of long-run structural trends, a notably pessimistic picture of labor force participation emerged.
This pessimism was driven by two large considerations, one true and one overstated. The true consideration was that the U.S. population is aging steadily over time, and demographic pressures were always going to see a rising ratio of retirees to active labor force participants. The overstated consideration concerned likely future labor force participation declines among prime-age workers (adults between the ages of 25 and 54). Recent decades had seen a long-running decline in prime-age male labor force participation, a recent stagnation of prime-age female labor force participation since 2000, and a sharp drop in both after 2007.
The confluence of these trends led many of the studies from the 2010s to project a future with a substantially smaller labor force. For example, one of the most influential of these mid-2010s papers (Aaronson et al. 2014) forecast that the overall labor force participation rate in 2019 would be 61.8%, and that in 2022, it would be 61%. In fact, 2019 saw an overall labor force participation rate of 63.1%, and in 2024 it was 62.6%. These are significant differences: Every 1 percentage point increase in labor force participation implies roughly 2.75 million more adults in the workforce, so these projections essentially lowballed the size of the labor force in recent years by close to 4 million workers.
It is certainly true that demographics—particularly population aging—are putting steady and predictable downward pressure on overall labor force participation rates. But the degree to which prime-age labor force participation was on a steep downward trend after 2007 was overestimated. And a large part of this overestimation was simply due to trying to infer structural determinants of labor force participation in the 2010s when the economy remained cyclically depressed. For example, Hall (2014) began his comments on the Aaronson et al. (2014) paper with the following (emphasis added):
The substantial decline in labor-force participation in recent years has raised the important question: How much of this decline is the result of the slack labor market from the Great Recession, and how much comes from other, structural forces? As the unemployment rate has returned to normal, a concern has developed that some of the people now classified as out of the labor force are, effectively, unemployed, but they are not included in the standard unemployment count because they do not satisfy its fairly exacting standards for classifying people as unemployed.
But the unemployment rate in 2014 had decisively not “returned to normal.” It averaged 6.2% over the year compared with the 4.6% average for 2007 (which, itself, was not particularly low). The Aaronson et al. (2014) paper included a figure (Figure 13 in their paper) that also showed what their projections for future labor force participation would have been if they had simply ignored the post-2008 data. These projections were far closer to what actually occurred in the period after their paper was written.
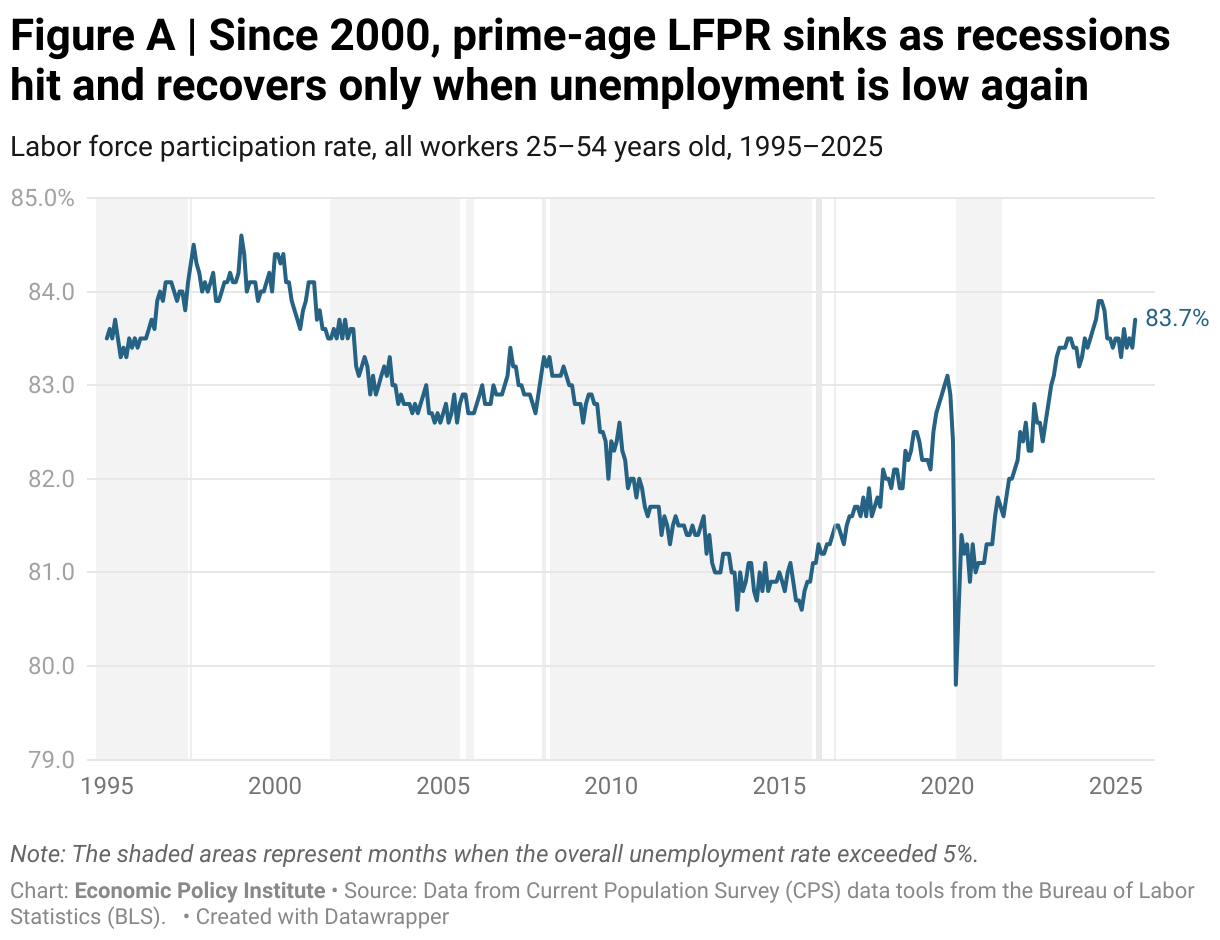
In short, by incorporating the 2010s data that was infected with cyclical weakness when they were trying to estimate a structural trend, their projections were too pessimistic. As Figure A shows, in 2016—a year that saw the overall unemployment rate dip below 5% for the first time in 8 years—prime-age labor force participation began rapidly recovering and continued recovering as overall unemployment rates fell further. By 2024, after years of extremely strong post-pandemic labor markets, labor force participation rates had actually regained the levels of the late 1990s. The evidence here is that there was little in the way of structural downward pressure on labor force participation; it was all driven by excess unemployment.
The best course of action for those who want to use the most timely data and do not want to have structural trend estimation marred by cyclical effects is simply to wait until a full business cycle has run its course and measure from peak to peak. This does not fully neutralize all cyclical effects (some business cycles end even before the economy has reached full employment), but this degree of patience would help a lot in correctly diagnosing trends.
The misdiagnosis in the mid-2010s about the likely trend of future labor force participation could have had serious repercussions. The state of labor force participation is a key variable when trying to assess what the level of potential gross domestic product (GDP) is. If one estimates this potential GDP as being too low relative to its true level, policymakers will stop aiming to boost aggregate demand and will settle for a level of actual GDP that is quite a bit below its true potential. This, in turn, will keep many potential workers from ever finding jobs, and the resulting too-slack labor market will fail to generate acceptable levels of wage growth. In turn, the federal budget deficit will be too high as tax collections hover below what could have been achieved if genuine full employment had been reached.
Patience in waiting for prescriptions to have an effect
In 2024, the biggest observable correlate with labor force participation is educational attainment. Labor force participation rates of workers with a college degree, for example, are 15.6 percentage points higher than for workers with a high school diploma.
Labor force participation is highest for those with a 4-year college degree: Prime-Age labor force participation rates by educational attainment
| Education level | Labor force participation rate |
|---|---|
| Advanced degree | 73% |
| Bachelor’s degree | 73% |
| Some college | 63% |
| High school | 59% |
| Less than high school | 41% |

Source: EPI’s State of Working America Data Library (EPI 2025), using CPS data from the BLS.
To the degree that a significant portion of this educational gradient in labor force participation reflects the causal influence of greater educational attainment in improving participation rates, this implies that measures that raise educational attainment would lead to higher labor force participation. This educational gap in labor force participation is often underrated as a source of economic inequality, and hence, also underrated as a possible margin along which educational investments might boost living standards.
For example, it is well known by now that greater educational attainment leads to higher annual (and lifetime) earnings. What is often underestimated is how often this premium is calculated conditional on working. But labor force participation for college graduates is 14.4 percentage points greater (or roughly 25% higher) for workers with a college degree, relative to those with a high school diploma. The National Center on Education Statistics (NCES 2024) reports that workers with a bachelor’s degree have annual earnings that are 59% higher than those with a high school diploma. But if we account for nonparticipation of college and high school workers (essentially assigning zero earnings to the share of each group not participating in the labor force), this would raise the annual earnings gap to roughly 105%, and almost a quarter of it would be accounted for simply by the higher labor force participation rates of college graduates. 3
Investing in children has large beneficial effects but will take decades to realize
The need for patience stems from the obvious fact that investments to boost educational attainment of the labor force will take considerable time: Colleges (including community colleges) and other forms of workforce development require mobilizing resources, and those being trained and educated need time to absorb new skills.
Further, the biggest payoffs to upfront investments in the name of boosting economywide labor force participation will come from investing in children—and particularly in early childhood. Investments in high-quality pre-kindergarten, for example, have very high social rates of return in large part because the children receiving these investments grow up to have higher earnings and stronger labor force attachment than other children do. But these benefits take considerable time to develop. For example, Lynch and Vaughul (2015) document that the annual payoff from a large investment in high-quality pre-kindergarten in year 1 of the investment is roughly 2% as high as the payoff in year 20. This is true even after accounting for the some considerable “real-time” effects of investing in early childhood education—like the boost to parents’ labor force participation when affordable, high-quality child care options are available.
Other research shows that investments in children’s health (including their nutritional health) also have high payoffs in terms of greater labor market success when they become adults. For example, Hoynes, Schanzenbach, and Almond (2016) found that children’s access to food stamps (or Supplemental Nutrition Assistance Program (SNAP) benefits) led to higher rates of high school completion and higher labor market earnings. Bailey et al. (2024) similarly found that access to SNAP increased their measured human capital as adults. Miller and Wherry (2019) found that infants who gained access to Medicaid in utero via their mothers’ prenatal coverage also had increased high school graduation rates. Brown, Kowalski, and Lurie (2020) found that eligibility for Medicaid during childhood increased college enrollment rates and taxes paid as adults.
The earnings effects of exposure to both Medicaid and high-quality early childhood education (ECE) are large. Brown, Kowalski, and Lurie (2020) find that each year that a child is covered by Medicaid adds 0.5% to their earnings as adults. This implies Medicaid coverage over an entire childhood would raise future earnings by as much as 9%. Lynch and Vaghul (2015) find that exposure to high-quality ECE can raise earnings of affected children by 25%–40%. If the total earnings effects of a large investment in children today were earnings that were 40% higher decades from now for children exposed to these greater investments, this necessarily implies a large effect on labor force participation. For example, if a quarter of these earnings effects were driven by higher labor force participation rates and just a tenth of U.S. children were exposed to these higher investments, this would imply a boost in labor force participation for this cohort’s lifetime of over a percentage point. The earnings effects of these interventions would provide a very substantial offset to their upfront fiscal costs. 4
Finally, a common finding across this literature is that effects are largest when they begin when children are young—even in utero. This implies that policymakers hoping for a payoff in labor force attachment from raising investments will need to display a lot of patience. The payoff might only begin in 10–20 years, and the full payoff could well take over 50 years. Patience is not a widely recognized virtue in U.S. policymaking, but it is one that could pay off greatly, should it be practiced in the form of investing today in children’s improved health, nutrition, and education.
Acknowledgments
The author thanks Joe Fast for research assistance and Grace Park for editing. This project was made possible by financial support from the Peter G. Peterson Foundation.
Notes
1. For example, if higher educational attainment causally increases labor force participation rates (something discussed in section two of this brief), then an increasing share of workers having college degrees should boost labor force participation over time. Another example going in the other direction concerns the potential negative causal effect on labor force participation of a spell of incarceration—if such a spell leads to lower labor force participation after re-entry, the large rise in the number of Americans with a spell of incarceration in their past would lower labor force participation rates overall.
2. Evidence of this can be seen in the fact that unemployment rates by 2018 and 2019 were actually lower than they were in the late 1990s and 2000s. Evidently there was no permanent structural shift keeping unemployment from falling back to these levels.
3. We can calculate the average relative earnings per member of the population (rather than per worker) by multiplying the 1.59 relative earnings advantage of those with a college degree by 1.28—which is the ratio of the prime-age employment-to-population ratio of workers with at least a college degree relative to the rest of the workforce. This gives 2.05, for a 105% relative earnings advantage. Since we know that 28% of this advantage is due to the higher employment-to-population ratio, we know that this is over a quarter of the advantage. Finally, if we do the same exercise but use the ratio of prime-age labor force participation rather than employment-to-population ratio, this gives us a relative earnings measure of 2.00—which indicates that 2.00/2.05 of the total effect of higher relative employment is driven by higher labor force participation of college workers rather than by lower rates of unemployment—still over a quarter of the entire advantage.
4. Lynch and Vaghul (2015) find this for early childhood education, and a Congressional Budget Office (CBO) working paper (Ash et al. 2023) finds that allowing Medicaid to offer “continuous eligibility” to children—allowing children to remain on Medicaid for 3 years, even after they may no longer quality for it based on current income tests—could boost future earnings enough that higher taxes could finance between 49% and 197% of the upfront cost of this policy change.
References
Aaronson, Stephanie, Tomaz Cajner, Bruce Fallick, Felix Galbis-Reig, Christopher Smith, and William Wascher. 2014. Labor Force Participation: Recent Developments and Prospects. Brookings Papers on Economic Activity. The Brookings Institution, Fall 2014.
Ash, Elizabeth, William Carrington, Rebecca Heller, and Grace Hwang. 2023. “Exploring the Effects of Medicaid During Childhood on the Economy and the Budget.” Congressional Budget Office Working Paper 2023-07, November 1, 2023.
Bailey, Martha J., Hilary Hoynes, Maya Rossin-Slater, and Reed Walker. 2024. “Is the Social Safety Net a Long-Term Investment? Large-Scale Evidence from the Food Stamps Program.” Review of Economic Studies 91, no.3: 1291–1330. https://doi.org/10.1093/restud/rdad063.
Brown, David W., Amanda E. Kowalski, and Ithai Z. Lurie. 2020. “Long-Term Impacts of Childhood Medicaid Expansions on Outcomes in Adulthood.” Review of Economic Studies 87, no. 2: 792–821. https://doi.org/10.1093/restud/rdz039.
Bureau of Labor Statistics (BLS). 2025. Online Data Retrieval Tool from the Current Population Survey Database–Labor Force Participation Rates for Workers Between the Ages of 25 and 54, Overall and by Educational Attainment. Accessed September 2025.
Economic Policy Institute (EPI). 2025. “Number of Labor Force Participants.” [web], State of Working America Data Library. Published 2025.
Gould, Elise, Sarah Jane Glynn, Hilary Wething, and Josh Bivens. 2025. Good News and Bad News About U.S. Labor Force Participation: Many Headwinds from the 2010s Are Gone, but We’re Not Investing Enough in the Future. Economic Policy Institute, September 2025.
Hall, Robert. 2014. Comments on Stephanie Aaronson, Tomaz Cajner, Bruce Fallick, Felix Galbis-Reig, Christopher Smith, and William Wascher. 2014. Labor Force Participation: Recent Developments and Prospects. Brookings Papers on Economic Activity. The Brookings Institution, Fall 2014.
Hoynes, Hilary, Diane Whitmore Schanzenbach, and Douglas Almond. 2016. “Long-Run Impacts of Childhood Access to the Safety Net.” American Economic Review 106, no. 4 (April 2016): 903–934.
Lynch, Robert and Kavya Vaghul. 2015. The Benefits and Costs of Investing in Early Childhood Education: The Fiscal, Economic, and Societal Gains of a Universal Prekindergarten Program in the United States, 2016–2050. Washington Center for Equitable Growth, December 2, 2015.
Miller, Sarah, and Laura R. Wherry. 2019. “The Long-Term Effects of Early Life Medicaid Coverage.” Journal of Human Resources 54, no.3: 785–824. https://doi.org/10.3368/jhr.54.3.0816.8173R1.
National Center on Education Statistics (NCES). 2024. Annual Earnings by Educational Attainment. Condition of Education. U.S. Department of Education, Institute of Education Sciences. May 2024.