Thinking Like an RA, Jobs Day Edition: What I’ve learned in the last three years
In a month, I’ll be leaving EPI to begin graduate school in Seattle, which makes this my last jobs day. I’ve learned a lot in my three years at EPI, and I thought it might be useful to write a series of posts explaining how the work we do has shifted the way I think about economics.
Of all the tasks at EPI, frantically gathering and analyzing new employment data on the first Friday of every month has been one of the most formative. Jobs day is like monthly report card on how the labor market is doing for workers. While almost every news station covers the unemployment rate and jobs numbers, the full report contains a wealth of indicators and information that take a bit more analysis to understand.
My first jobs day reported the release of June 2011 data: a month that, like the months prior, showed painfully slow growth in the recovery of the Great Recession. The unemployment rate was undeniably high (9 percent), payroll employment had added an average of only 115,000 jobs per month over the last year, and both real wages and average weekly hours—two measures of how workers with jobs were faring—had fallen from the month before. We were in the beginning stages of the severe public-sector austerity that would strangle growth in coming years—governments (mostly state and local) had laid off an additional 130,000 workers within the last six months, adding to a cumulative half a million public sector jobs cut between 2007-2011. These indicators reflected a truly terrible economy. Two years out from the height of the Great Recession, many economists and policy makers were still arguing for another stimulus act, and the Fed had already launched two rounds of “quantitative easing.”
Remember the Last Time the Fed Tightened After a Recession? I Didn’t Either, So…
[Updated – somehow didn’t get the GDP row in previous table to come along—should be fixed now]
Ten years ago (July 2004) was the last time the Fed started raising the effective Federal Funds Rate to provide less support to an economic recovery. Many observers—even presidents of regional Fed banks—think the Fed should start tightening today. I thought I’d just take a quick look at some measures of slack and inflationary pressures to see if the economy does indeed look at least as tight as it did in July 2004. Indicators are in the table below.

First, the unemployment rate—it was 5.6 percent in the second quarter of 2004 (i.e., right before tightening began) and it’s 6.2 percent today.
Next, we look at the employment to population ratio for prime-age adults—simply the share of prime-age (25-54) adults with a job. This was 79 percent in July 2004 and is 76.5 percent today.
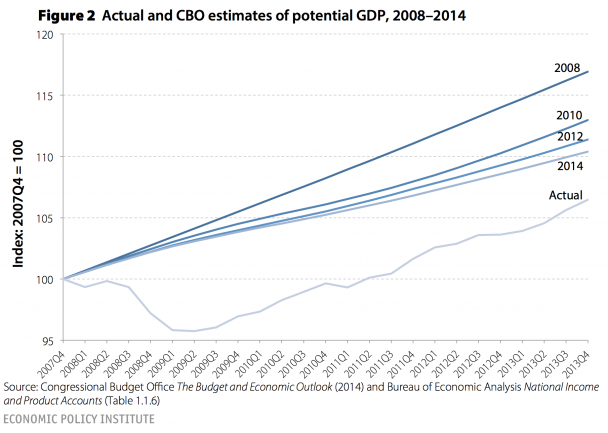
Third, we examine the output gap, as measured by the Congressional Budget Office. This is a measure of how much of the economy’s productive potential is being unused—the most direct attempt to measure economic slack. In the second quarter of 2004 this measure indicated that 0.9 percent of potential output being unused, while today this number is 4.5 percent—and this even after the CBO has made very large downward revisions in the unobserved “potential” measure.
I So Want to See Accelerating Job Growth, and It Is So Not Happening
Second quarter job growth was delightfully strong—277,000 jobs added per month on average—and even I got excited that maybe the pace of job growth was meaningfully accelerating. But July’s job growth of 209,000 certainly dampens those hopes. Over the 12 months from July 2013–June 2014, job growth averaged, yes, 209,000 per month. Sigh. At this pace, it will take nearly four years to get back to health in the labor market.

Tightening Labor Market Will at Some Point Strengthen Wage Growth, but No Sign of That Today
The weak labor market of the last seven years has put enormous downward pressure on wages. Employers just don’t have to offer big wage increases to get and keep the workers they need when their workers don’t have anywhere else to go. As the labor market continues to tighten, at some point wage growth will accelerate and workers will see real wage growth, which will be a very good thing. But as the figure shows, there is no sign of that yet in today’s jobs report.

Hope Springs Eternal, But The Data Is Actually Pretty Mixed About Whether Or Not Recovery Is Accelerating
The last couple of months have provided some data points that have raised hopes that the recovery is about to step into a higher gear.
Unemployment fell by 0.6 percent between December 2013 and June 2014, and essentially all of the decline was driven by actual job-growth rather than falling participation. Payroll job-growth for the second quarter of 2014 averaged 272,000, a rate that, if continued, would see us back to pre-Great Recession labor market health by early 2017. Not soon enough, but much better than the November 2018 recovery that would have happened had the pre-2014 pace of job-growth in the recovery persisted. And yesterday it was reported that gross domestic product grew at an annualized rate of 4.0 percent in the second quarter.
How excited should we be by all of this?
Let’s take GDP first, since the story is pretty unambiguous: not very excited at all. Yesterday’s second quarter number was largely a pretty predictable bounceback from the disastrous first quarter numbers, which showed that the economy contracted at a 2.1 percent rate. Average these two quarters and you have the economy growing at less than a 1 percent rate for the first half of the year. This sad performance comes even as the fiscal drag from federal and state governments has relented a lot since 2013. It’s very hard to see us moving ahead of the same 2 percent growth in final demand that we have seen over the past three years.
What To Watch On Jobs Day—Have We Really Kicked It Into A Higher Gear?
Last month’s jobs report was a strong one. We added 288,000 jobs, bringing the second-quarter average growth rate to 272,000 jobs per month. Meanwhile, the unemployment rate dropped for good reasons—because people found work, not because people stopped looking. Indeed, last month’s report made me unusually optimistic; at a growth rate of 272,000 jobs per month, we would get back to a healthy labor market in early 2017. That would still mean that the Great Recession, all told, will have caused roughly ten years of weakened labor market opportunities for American workers, but at least there’s light at the end of the tunnel.
So July’s jobs numbers, which will be released on Friday, will help answer the all-important question: have we really kicked it into higher gear? A jobs number north of 270,000 would be a pretty clear sign that the answer is yes—but anything much less than that would push us back to “we have to wait and see” territory. Unfortunately, consensus forecasts are for job growth around 235,000—if true, that sets us back to growth rates that put health in the labor market more than three years away.
Social Security and Medicare Trustees Reports Show the Impact of Slowing Health Costs
The big news in the Social Security and Medicare trustees reports released this afternoon is the improvement in Medicare’s finances due to slowing health cost inflation. As a result, the Medicare Hospital Insurance Trust Fund is projected to remain solvent until 2030, four years later than projected last year. The projected HI Trust Fund’s 75-year shortfall is 0.87 percent of taxable payroll, down from 1.11 percent of payroll last year.
On the other hand, the trustees also assume the Medicare Sustainable Growth Rate formula will not take effect. Though Congress has overridden the legislated reduction in physician payment rates since 2003, it has also included provisions offsetting part or all of the cost to Medicare. Implicitly, the projections now assume the “doc fix” will no longer include such provisions, raising projected Medicare Part B costs by about 0.3 percentage points annually over the next 75 years.
The combined effect of these changes is a reduction in projected short- and medium-term costs and an increase in long-term costs. Last year, costs were projected to rise to 3.6, 5.8, and 6.5 percent of GDP in 2012, 2040 and 2087, respectively. This year, costs are projected to rise to 3.5, 5.6, and 6.9 percent of GDP in 2013, 2040 and 2088, respectively.
Social Security projections show little change from last year, with the combined old age and disability trust funds projected to remain solvent through 2033—the same as last year—and a modest increase in the long-term shortfall from 2.72 percent of taxable payroll last year to 2.88 percent of taxable payroll this year. The change in the valuation period—one fewer year of surplus and one more year of deficit—accounts for 0.6 percentage points of the decline. The rest is due to small changes in demographic and economic assumptions (such as a reduction in the inflation rate from 2.8 to 2.7 percent), methodological improvements, and the repeal of parts of the so-called Defense of Marriage Act.
Can We Have Too Many STEM Workers?
I read two pieces about the STEM (science, technology, engineering, and math) workforce this morning: an op-ed in USA Today and an editorial in the Washington Post. Both reference a recent Census Bureau study, which found that only a quarter of bachelor’s degree graduates in STEM fields end up working in those fields. But from there, the two pieces head in very different directions.
The Post says Census got the number of STEM jobs wrong, because, in fact, one out of every five jobs requires STEM skills, even if the students end up working outside their field. That’s stretching definitions, though the idea that many STEM grads can use what they learn outside their field of study is certainly true. But, amazingly, the Post also says the numbers don’t really matter: “Whatever the number generated, it should not be seen as determining the need for STEM education.” Whether one STEM worker in four finds a job in his field of study, or only one in ten, the education is so valuable we can’t have too many STEM majors, according to the Post editorial. Why, even farmers should have STEM degrees because, “many farmers rely on genetic modification of crops.” That’s just silly. Many truck drivers rely on civil engineering, but they don’t need engineering degrees any more than a farmer planting hybrid corn needs a math or genetics degree.
The Post’s editors believe there’s no such thing as an oversupply of STEM graduates, but their editorial doesn’t review the boom and bust history of STEM graduate oversupply, or even mention what effect oversupply might have on the earnings or aspirations of the students who have paid for and worked to complete STEM bachelor degrees. By contrast, the USA Today authors (some of whom have done research with EPI before), all of whom are academics with close ties to actual students, do care about what happens to STEM grads after they leave school and look for work. They are rightly concerned that the wages of IT personnel have been flat for 16 years, and they worry that overproducing STEM grads, coupled with industry’s immigration proposal to triple the number of IT guestworkers, will suppress wage growth and deny IT workers the middle class security most would like, let alone a fair share of the tech industry’s fabulous profits.
Congress Takes Steps To Stop Wage Theft By Federal Contractors
Of all the thefts that happen in the United States, one type is greatly outpacing the rest. With billions of dollars stolen annually—greater than all burglaries, robberies, larcenies, and motor vehicle thefts combined—wage theft has become an epidemic. And wage theft’s victims tend to be those who can least afford it and who lack the power to stop it: low-wage and immigrant workers. When victims do speak out, they often face severe economic retribution, like cuts in their hours or the possibility of losing their job.
The federal government is not just failing to do enough to stop wage theft—it’s an active participant in it. Federally-contracted workers are victimized at an alarming rate. According to a Senate Heath, Education, Labor, and Pensions Committee report, 35 of the Department of Labor’s 100 largest wage theft penalties from 2007-2012 (32 companies, with three repeat violations) were levied against federal contractors. In total, these firms had to repay employees $82.1 million in back wages, but only six faced civil penalties, which totaled just $640,385. Moreover, this did not prevent these firms from getting future government contracts—in FY 2012, these same 32 companies received a whopping $73.1 billion in federal contracts. If this doesn’t send a clear message to contractors, I’m not sure what does. Rip off your employees and you may get a slap on the wrist, but don’t worry, the contracts will keep coming.
In fact, the federal bidding process even provides a certain incentive for these illegal labor cost reductions. With contracts going to the lowest bidder, some firms try to shave costs in whatever ways possible, including illegally denying employees the wages they deserve.
Is an Aging Population—or Slow and Unequal Wage Growth—our Biggest Challenge?
The release of the Social Security Trustees Report, just announced for July 28, usually prompts alarmist commentary on the burdens of supporting an aging population. A recent Congressional Budget Office report fanned the flames by identifying aging as the key driver of long-term growth in federal spending, accounting for 55 percent of the projected growth in federal spending on Social Security, Medicare, and Medicaid as a share of GDP over the next quarter century. Aging eclipsed excess growth in health costs above general inflation (24 percent of the increase) and the expansion of federal health care programs under the Affordable Care Act (21 percent).
Aging appears to loom larger because health cost inflation slowed after ACA’s passage. Despite this positive development, CBO projects that by 2039 federal debt as a share of GDP will almost match the record set after World War II, even as federal revenues increase relative to the size of the economy. If aging is as inevitable as death and the Republican aversion to taxes, cuts to large social insurance programs benefiting seniors would seem to be the only way to prevent the federal debt from ballooning.
Not so fast. While CBO analysts should be given the benefit of the doubt when it comes to producing unbiased projections, how these projections are framed is not immune to politics. And while both the current and former CBO directors are known for their expertise in analyzing health costs, Peter Orszag, who stepped down as CBO director to become President Obama’s budget director, emphasized the need to rein in health costs through government action, whereas his successor, Douglas Elmendorf, has been more skeptical of government’s ability to do so, going so far as to dismiss ACA provisions designed to restrain health costs in CBO’s influential “alternative” projections.