An Open Letter to Sec. of Labor Tom Perez
An open letter to Secretary of Labor Tom Perez and Wage and Hour Administrator David Weil
Dear Mr. Secretary:
Several newspapers and journals, including Computerworld and the L.A. Times, have reported that Southern California Edison (SCE), a public utility, has laid off hundreds of its U.S. employees and replaced them with H-1B guestworkers employed by the India-based IT services firms Infosys and Tata Consultancy Services. As my colleague, Ron Hira, has written, “Adding to the injustice, American workers losing their jobs are being forced to do “knowledge transfers,” an ugly euphemism that means being forced to train your own foreign replacement.”
As you know, the law (the Immigration and Nationality Act) forbids the hiring of H-1B temporary foreign guestworkers whose employment would “adversely affect the wages and working conditions of U.S. workers comparably employed.” Clearly, taking away the jobs, wages and benefits of the laid-off SCE employees does adversely affect their wages and working conditions.
You have authority under the Immigration and Nationality Act to investigate this case, but I have seen no announcement that you intend to do so or that you share my sense of outrage that the H-1B program is being abused in such an egregious way. I hope that we will soon learn that the Department of Labor intends to investigate and remedy this harm to skilled U.S. workers who have pursued education and training in a technical field, worked hard, and played by the rules. Our government should, at the very least, ensure that its programs, including its visa programs, are not used to destroy the careers and financial security of its people.
Sincerely,
Ross Eisenbrey
Vice President
Economic Policy Institute
Wage Theft by Employers is Costing U.S. Workers Billions of Dollars a Year
Rampant wage theft in the United States is a huge problem for struggling workers. Surveys reveal that the underpayment of owed wages can reduce affected workers’ income by 50 percent or more. Most recently, a careful study of minimum wage violations in New York and California in 2011 commissioned by the U.S. Department of Labor (DOL) determined that the affected employees’ lost weekly wages averaged 37–49 percent of their income. This wage theft drove between 15,000 and 67,000 families below the poverty line. Another 50,000–100,000 already impoverished families were driven deeper into poverty.
The extensive weekly minimum wage violations uncovered by the DOL study in California and New York alone amount to an estimated $1.6 billion–$2.5 billion over the course of a full year. Given that the combined population of California and New York is 18.5 percent of the U.S. total, it is reasonable to estimate that minimum wage violations nationwide amount to at least $8.6 billion a year, and as much as $13.8 billion a year. On the one hand, violations in these two states might be less frequent because the wage and hour enforcement effort in New York and California is greater than in most states and violations might be deterred (Florida, for example, does not have a state labor department). But on the other hand, their large immigrant populations might increase the prevalence of wage theft—the DOL study found that non-citizens were 1.6 to 3.1 times more likely to suffer from a minimum wage violation.
The DOL study vastly understates the total impact of wage theft because it reported only on minimum wage violations, which are more frequent than overtime violations but usually involve smaller per violation dollar amounts than many overtime pay violations. A bookkeeper, for example, earning an annual salary of $45,000, who works 10 hours of unpaid overtime a week might lose $325, whereas a minimum wage worker forced to work “off-the-clock” unpaid for 10 hours would lose “only” $72.50, or ten times the state minimum wage if it were higher than the federal minimum. (Overtime violations are very frequent among low wage workers: a 2009 study found that on a weekly basis, 19 percent of front-line workers in low wage industries were cheated out of overtime pay to which they were entitled.)
DOL’s new study shows the need for much greater efforts to ensure employer compliance. Helpfully, the president has called for increases in the budget and staffing of the Wage and Hour Division, but Congress should revisit the obsolete penalties for non-compliance: repeated or willful violations of the minimum wage and overtime requirements are subject to a maximum fine of only $1,100.
A Milestone Week for Apple’s Stock, but Not its Workers
This week was a milestone for Apple. As its stock continues to rise, its market cap exceeded $700 billion—the largest valuation ever achieved by any U.S. company. This milestone, however, must be viewed with considerably less admiration after one takes a close look at its new “supplier responsibility” report. The report reveals important information about one of the less appetizing ingredients of Apple’s vast success: the continued mistreatment of the workers who make its products. The report shows that widespread labor rights violations can still be found in Apple’s massive supply chain, and that Apple continues to obfuscate these realities in its public communications on the subject.
Apple fails to report that its own data shows that labor practices are getting worse in several important areas. In its new report, which covers 2014, Apple says that in 92 percent of cases, the workweeks of the employees in its supply chain fell below its 60 hours per week standard. Apple fails to report that this compliance rate is down from the 2013 compliance rate of 95 percent. In 2014, Apple found that the overall labor rights compliance rate in the area of Health and Safety was 70 percent; it fails to state that this is down from the 2013 compliance rate of 77 percent. Notably, while Apple fails to report prior year data on those issues, which reveal negative trends, the report does provide such data on other topics—those where this year’s data is better than that of prior years.
The effects of Apple’s reforms are often dubious and overstated by the company. For example, in reporting that 92 percent of the time workers in its supply chain are working less than 60 hours per week, Apple ignores the fact that workweeks at its Chinese factories still consistently break Chinese law, which restricts workweeks to less than 50 hours and which Apple has repeatedly pledged to uphold. The average workweek Apple reports still exceeds this legal limit by a substantial margin. Apple also continues to make the remarkable claim that nearly all its suppliers have achieved freedom of association (the right to organize unions and bargain collectively), saying its suppliers achieved 96 percent compliance with this standard. As Apple is aware, such freedom is non-existent in China. Independent unions are illegal. Workers who try to form them go to jail. Moreover, the information available about a program run by the Fair Labor Association (FLA), which was supposedly going to provide a greater voice for Apple’s workers (within the cramped confines of Chinese law), indicates it has fallen woefully short of its stated goals. Further, Apple touts training programs under which, according to the company, 2.3 million workers were trained in labor rights in 2014. This is a large number, to be sure; unfortunately, it is the suppliers themselves, not worker rights advocates or worker representatives (and not even Apple or its new training academy), that provide this training—and Apple provides no substantive information on its actual content or impact. Independent reports indicate that this management-provided training may be entirely cursory. (Apple’s repudiation of the use of bonded foreign labor was a positive step, but does not address the much larger, multi-faceted problem within Apple’s supply chain in China of the excessive use of domestic labor hired through dispatch agencies.)
Less Than Half the Truth: Jobs and Wages in Export Industries
Trade is a hot topic on Capitol Hill this year. President Obama has asked members of Congress for “fast track” trade promotion authority in order to finalize proposed trade deals with Asia and Europe that set the stage for growing, trade-related job displacement. One of the president’s core, frequently repeated arguments for these trade and investment deals is that “our businesses export more than ever, and exporters tend to pay their workers higher wages.” But that’s less than half the story. Trade is a two-way street, and talking about exports without considering imports is like keeping score in a baseball game by counting only the runs scored by the home team. It might make you feel good, but it won’t tell you who’s winning the game. Sadly, when it comes to trade and wages, trade is driving down the average wages of American workers because the United States runs large trade deficits with the world as a whole, including many countries in Asia and Europe—the regions targeted in current trade negotiations.
A case in point is provided by U.S. trade with China, which was responsible for nearly half (46.5 percent) of our $736.8 billion goods trade deficit in 2014. Jobs in industries exporting to China did pay well in 2009-2011 (the last years for which we have complete wage data)—an average of $872.89 per week, or 10.3 percent more than workers making non-traded goods and services (who earned only $791.14 per week), as shown in the figure below. However, workers in import-competing industries were paid even better—an average of $1,021.66 per week, or 29.1 percent more than workers in non-traded industries.
Congress and President Obama Cannot Sit Idly By While Companies Use H-1B Guestworkers to Replace American Workers
A recent investigation by Computerworld revealed that hundreds of information technology (IT) workers were laid off by Southern California Edison (SCE) and replaced with temporary foreign workers through the H-1B guestworker visa program, which allows employers to hire temporary foreign workers for up to six years if they have at least a college degree (most work in IT). The replacement H-1B workers are employed by two India-based IT services firms that specialize in outsourcing and offshoring U.S. jobs: Infosys and Tata Consultancy Services. While U.S. Sen. Jeff Sessions (R-Ala.) and Rep. Darrell Issa (R-Calif.) have publicly criticized the move, it doesn’t look like any action will be taken to reverse it.
SCE describes itself as “one of the nation’s largest electric utilities…deliver[ing] power to more than 14 million people.” SCE earned net profits of $1.4 billion on $13.2 billion in revenues over the past year. The company’s stock price is up 10 percent over that time and it pays its investors a 4.8 percent yield in dividends. An observer could be forgiven for believing that a job delivering safe and reliable power to homes in the United States might be reasonably safe from being offshored to India or even outsourced to temporary foreign workers. But he or she would be mistaken. In fact, the SCE case is just one more example in a long line of cases in which American workers are being replaced by H-1B workers.
Adding to the injustice, American workers losing their jobs are being forced to do “knowledge transfers,” an ugly euphemism that means being forced to train your own foreign replacement.
Americans should be outraged that most of our politicians sit idly by while outsourcing firms hijack the nation’s temporary foreign worker programs. Unpublished H-1B data from United States Citizenship and Immigration Services reveals the scale of the problem: A majority of H-1B visas are now being used by firms that displace American workers and facilitate the offshoring of high-wage jobs.
The Unemployed Exceed Job Openings in Almost Every Industry
One of the recurring myths following the Great Recession has been that recovery in the labor market has lagged because workers don’t have the right skills. The figure below, which shows the number of unemployed workers and the number of job openings in December by industry, is a useful way to examine this idea. If today’s labor market woes were the result of skills shortages or mismatches, we would expect to see some sectors where there are more unemployed workers than job openings, and others where there are more job openings than unemployed workers. What we find, however, is that there are more unemployed workers than jobs openings in almost every industry.
The notable exception is health care and social assistance, which has been consistently adding jobs throughout the business cycle. There is now one unemployed worker for every job opening in that sector, suggesting a tighter labor market for those workers. However, we have yet to see any sign of decent wage gains yet, which would be the final indicator that the labor market, at least for those workers, were approaching reasonable health.
Other sectors have seen little-to-no improvement in their job-seekers-to-job-openings ratios. There are still about six unemployed construction workers for every job opening. In other words, despite claims from some employers, there is no shortage of construction workers.
Taken as a whole, these numbers demonstrate that the main problem in the labor market is a broad-based lack of demand for workers—not available workers lacking the skills needed for the sectors with job openings.
Unemployed and job openings, by industry (in millions)
| Industry | Unemployed | Job openings |
|---|---|---|
| Professional and business services | 1.0833 | 0.8846 |
| Health care and social assistance | 0.7053 | 0.7228 |
| Retail trade | 1.0993 | 0.4843 |
| Accommodation and food services | 0.9564 | 0.5871 |
| Government | 0.6781 | 0.4474 |
| Finance and insurance | 0.2590 | 0.2308 |
| Durable goods manufacturing | 0.4543 | 0.1803 |
| Other services | 0.3686 | 0.1476 |
| Wholesale trade | 0.1610 | 0.1525 |
| Transportation, warehousing, and utilities | 0.3565 | 0.1648 |
| Information | 0.1535 | 0.0992 |
| Construction | 0.7621 | 0.1273 |
| Nondurable goods manufacturing | 0.3002 | 0.1084 |
| Educational services | 0.2298 | 0.0793 |
| Real estate and rental and leasing | 0.1139 | 0.0569 |
| Arts, entertainment, and recreation | 0.2117 | 0.0698 |
| Mining and logging | 0.0524 | 0.0293 |

Note: Because the data are not seasonally adjusted, these are 12-month averages, January 2014–December 2014.
Source: EPI analysis of data from the Job Openings and Labor Turnover Survey and the Current Population Survey
Layoffs and Quits Hold Steady in December
The hires, quits, and layoffs rates all held fairly steady in the December Job Openings and Labor Turnover Survey (JOLTS). As you can see in the figure below, layoffs shot up during the recession but recovered quickly and have been at prerecession levels for more than three years. The fact that this trend continued in December is a good sign. That said, not only do layoffs need to come down before we see a full recovery in the labor market, but hiring needs to pick up. While the hires rate has been generally improving, it’s still below its prerecession level.
The voluntary quits rate had been flat since February (1.8 percent), and saw a modest spike up in September to 2.0 percent, before falling to 1.9 percent in October and holding steady through December. A larger number of people voluntarily quitting their jobs indicates a strong labor market—one where workers are able to leave jobs that are not right for them and find new ones. In December, the quits rate was still 9.2 percent lower than it was in 2007, before the recession began.
Over the year, the quits rate has averaged 1.8 percent, an improvement over its average rate of 1.4 percent in 2009 and 2010. Each consecutive year has seen modest improvement, an average increase in the quits rate of 0.1 percentage points per year. Before long, we should look for a return to pre-recession levels of voluntary quits, which would mean that fewer workers are locked into jobs they would leave if they could.
Hires, quits, and layoff rates, December 2000–December 2014
| Month | Hires rate | Layoffs rate | Quits rate |
|---|---|---|---|
| Dec-2000 | 4.1% | 1.4% | 2.3% |
| Jan-2001 | 4.4% | 1.6% | 2.6% |
| Feb-2001 | 4.1% | 1.4% | 2.5% |
| Mar-2001 | 4.2% | 1.6% | 2.4% |
| Apr-2001 | 4.0% | 1.5% | 2.4% |
| May-2001 | 4.0% | 1.5% | 2.4% |
| Jun-2001 | 3.8% | 1.5% | 2.3% |
| Jul-2001 | 3.9% | 1.5% | 2.2% |
| Aug-2001 | 3.8% | 1.4% | 2.1% |
| Sep-2001 | 3.8% | 1.6% | 2.1% |
| Oct-2001 | 3.8% | 1.7% | 2.2% |
| Nov-2001 | 3.7% | 1.6% | 2.0% |
| Dec-2001 | 3.7% | 1.4% | 2.0% |
| Jan-2002 | 3.7% | 1.4% | 2.2% |
| Feb-2002 | 3.7% | 1.5% | 2.0% |
| Mar-2002 | 3.5% | 1.4% | 1.9% |
| Apr-2002 | 3.8% | 1.5% | 2.1% |
| May-2002 | 3.8% | 1.5% | 2.1% |
| Jun-2002 | 3.7% | 1.4% | 2.0% |
| Jul-2002 | 3.8% | 1.5% | 2.1% |
| Aug-2002 | 3.7% | 1.4% | 2.0% |
| Sep-2002 | 3.7% | 1.4% | 2.0% |
| Oct-2002 | 3.7% | 1.4% | 2.0% |
| Nov-2002 | 3.8% | 1.5% | 1.9% |
| Dec-2002 | 3.8% | 1.5% | 2.0% |
| Jan-2003 | 3.8% | 1.5% | 1.9% |
| Feb-2003 | 3.6% | 1.5% | 1.9% |
| Mar-2003 | 3.4% | 1.4% | 1.9% |
| Apr-2003 | 3.6% | 1.6% | 1.8% |
| May-2003 | 3.5% | 1.5% | 1.8% |
| Jun-2003 | 3.7% | 1.6% | 1.8% |
| Jul-2003 | 3.6% | 1.6% | 1.8% |
| Aug-2003 | 3.6% | 1.5% | 1.8% |
| Sep-2003 | 3.7% | 1.5% | 1.9% |
| Oct-2003 | 3.8% | 1.4% | 1.9% |
| Nov-2003 | 3.6% | 1.4% | 1.9% |
| Dec-2003 | 3.8% | 1.5% | 1.9% |
| Jan-2004 | 3.7% | 1.5% | 1.9% |
| Feb-2004 | 3.6% | 1.4% | 1.9% |
| Mar-2004 | 3.9% | 1.4% | 2.0% |
| Apr-2004 | 3.9% | 1.5% | 2.0% |
| May-2004 | 3.8% | 1.4% | 1.9% |
| Jun-2004 | 3.8% | 1.4% | 2.0% |
| Jul-2004 | 3.7% | 1.4% | 2.0% |
| Aug-2004 | 3.9% | 1.5% | 2.0% |
| Sep-2004 | 3.8% | 1.4% | 2.0% |
| Oct-2004 | 3.9% | 1.4% | 2.0% |
| Nov-2004 | 3.9% | 1.5% | 2.1% |
| Dec-2004 | 4.0% | 1.5% | 2.1% |
| Jan-2005 | 3.9% | 1.4% | 2.1% |
| Feb-2005 | 3.9% | 1.4% | 2.0% |
| Mar-2005 | 3.9% | 1.5% | 2.1% |
| Apr-2005 | 4.0% | 1.4% | 2.1% |
| May-2005 | 3.9% | 1.4% | 2.1% |
| Jun-2005 | 3.9% | 1.5% | 2.1% |
| Jul-2005 | 3.9% | 1.4% | 2.0% |
| Aug-2005 | 4.0% | 1.4% | 2.2% |
| Sep-2005 | 4.0% | 1.4% | 2.3% |
| Oct-2005 | 3.8% | 1.3% | 2.2% |
| Nov-2005 | 3.9% | 1.2% | 2.2% |
| Dec-2005 | 3.7% | 1.3% | 2.1% |
| Jan-2006 | 3.9% | 1.3% | 2.1% |
| Feb-2006 | 3.9% | 1.3% | 2.2% |
| Mar-2006 | 3.9% | 1.2% | 2.2% |
| Apr-2006 | 3.8% | 1.3% | 2.1% |
| May-2006 | 4.0% | 1.4% | 2.2% |
| Jun-2006 | 3.9% | 1.2% | 2.2% |
| Jul-2006 | 3.9% | 1.3% | 2.2% |
| Aug-2006 | 3.8% | 1.2% | 2.2% |
| Sep-2006 | 3.8% | 1.3% | 2.1% |
| Oct-2006 | 3.8% | 1.3% | 2.1% |
| Nov-2006 | 4.0% | 1.3% | 2.3% |
| Dec-2006 | 3.8% | 1.3% | 2.2% |
| Jan-2007 | 3.8% | 1.2% | 2.2% |
| Feb-2007 | 3.8% | 1.3% | 2.2% |
| Mar-2007 | 3.8% | 1.3% | 2.2% |
| Apr-2007 | 3.7% | 1.3% | 2.1% |
| May-2007 | 3.8% | 1.3% | 2.2% |
| Jun-2007 | 3.8% | 1.3% | 2.0% |
| Jul-2007 | 3.7% | 1.3% | 2.1% |
| Aug-2007 | 3.7% | 1.3% | 2.1% |
| Sep-2007 | 3.7% | 1.5% | 1.9% |
| Oct-2007 | 3.8% | 1.4% | 2.1% |
| Nov-2007 | 3.7% | 1.4% | 2.0% |
| Dec-2007 | 3.6% | 1.3% | 2.0% |
| Jan-2008 | 3.5% | 1.3% | 2.0% |
| Feb-2008 | 3.5% | 1.4% | 2.0% |
| Mar-2008 | 3.4% | 1.3% | 1.9% |
| Apr-2008 | 3.5% | 1.3% | 2.1% |
| May-2008 | 3.3% | 1.3% | 1.9% |
| Jun-2008 | 3.5% | 1.5% | 1.9% |
| Jul-2008 | 3.3% | 1.4% | 1.8% |
| Aug-2008 | 3.3% | 1.6% | 1.7% |
| Sep-2008 | 3.1% | 1.4% | 1.8% |
| Oct-2008 | 3.3% | 1.6% | 1.8% |
| Nov-2008 | 2.9% | 1.6% | 1.5% |
| Dec-2008 | 3.2% | 1.8% | 1.6% |
| Jan-2009 | 3.1% | 1.9% | 1.5% |
| Feb-2009 | 3.0% | 1.9% | 1.5% |
| Mar-2009 | 2.8% | 1.8% | 1.4% |
| Apr-2009 | 2.9% | 2.0% | 1.3% |
| May-2009 | 2.8% | 1.6% | 1.3% |
| Jun-2009 | 2.8% | 1.6% | 1.3% |
| Jul-2009 | 2.9% | 1.7% | 1.3% |
| Aug-2009 | 2.9% | 1.6% | 1.3% |
| Sep-2009 | 3.0% | 1.6% | 1.3% |
| Oct-2009 | 2.9% | 1.5% | 1.3% |
| Nov-2009 | 3.1% | 1.4% | 1.4% |
| Dec-2009 | 2.9% | 1.5% | 1.3% |
| Jan-2010 | 3.0% | 1.4% | 1.3% |
| Feb-2010 | 2.9% | 1.4% | 1.3% |
| Mar-2010 | 3.2% | 1.4% | 1.4% |
| Apr-2010 | 3.1% | 1.3% | 1.5% |
| May-2010 | 3.4% | 1.3% | 1.4% |
| Jun-2010 | 3.1% | 1.5% | 1.5% |
| Jul-2010 | 3.2% | 1.6% | 1.4% |
| Aug-2010 | 3.0% | 1.4% | 1.4% |
| Sep-2010 | 3.1% | 1.4% | 1.4% |
| Oct-2010 | 3.1% | 1.3% | 1.4% |
| Nov-2010 | 3.2% | 1.4% | 1.4% |
| Dec-2010 | 3.2% | 1.4% | 1.5% |
| Jan-2011 | 3.0% | 1.3% | 1.4% |
| Feb-2011 | 3.1% | 1.3% | 1.4% |
| Mar-2011 | 3.2% | 1.3% | 1.5% |
| Apr-2011 | 3.2% | 1.3% | 1.5% |
| May-2011 | 3.1% | 1.3% | 1.5% |
| Jun-2011 | 3.3% | 1.4% | 1.5% |
| Jul-2011 | 3.1% | 1.3% | 1.5% |
| Aug-2011 | 3.2% | 1.3% | 1.5% |
| Sep-2011 | 3.3% | 1.3% | 1.5% |
| Oct-2011 | 3.2% | 1.3% | 1.5% |
| Nov-2011 | 3.2% | 1.3% | 1.5% |
| Dec-2011 | 3.2% | 1.3% | 1.5% |
| Jan-2012 | 3.2% | 1.2% | 1.5% |
| Feb-2012 | 3.3% | 1.3% | 1.6% |
| Mar-2012 | 3.3% | 1.2% | 1.6% |
| Apr-2012 | 3.2% | 1.4% | 1.6% |
| May-2012 | 3.3% | 1.4% | 1.6% |
| Jun-2012 | 3.2% | 1.3% | 1.6% |
| Jul-2012 | 3.2% | 1.2% | 1.6% |
| Aug-2012 | 3.3% | 1.4% | 1.6% |
| Sep-2012 | 3.1% | 1.3% | 1.4% |
| Oct-2012 | 3.2% | 1.3% | 1.5% |
| Nov-2012 | 3.3% | 1.3% | 1.6% |
| Dec-2012 | 3.2% | 1.2% | 1.6% |
| Jan-2013 | 3.2% | 1.2% | 1.7% |
| Feb-2013 | 3.4% | 1.2% | 1.7% |
| Mar-2013 | 3.2% | 1.3% | 1.6% |
| Apr-2013 | 3.3% | 1.3% | 1.6% |
| May-2013 | 3.3% | 1.3% | 1.6% |
| Jun-2013 | 3.2% | 1.2% | 1.6% |
| Jul-2013 | 3.3% | 1.2% | 1.7% |
| Aug-2013 | 3.4% | 1.2% | 1.7% |
| Sep-2013 | 3.4% | 1.3% | 1.7% |
| Oct-2013 | 3.3% | 1.1% | 1.8% |
| Nov-2013 | 3.3% | 1.1% | 1.8% |
| Dec-2013 | 3.3% | 1.2% | 1.8% |
| Jan-2014 | 3.3% | 1.2% | 1.7% |
| Feb-2014 | 3.4% | 1.2% | 1.8% |
| Mar-2014 | 3.4% | 1.2% | 1.8% |
| Apr-2014 | 3.5% | 1.2% | 1.8% |
| May-2014 | 3.4% | 1.2% | 1.8% |
| Jun-2014 | 3.5% | 1.2% | 1.8% |
| Jul-2014 | 3.6% | 1.2% | 1.8% |
| Aug-2014 | 3.4% | 1.2% | 1.8% |
| Sep-2014 | 3.6% | 1.2% | 2.0% |
| Oct-2014 | 3.7% | 1.3% | 1.9% |
| Nov-2014 | 3.6% | 1.2% | 1.9% |
| Dec-2014 | 3.7% | 1.2% | 1.9% |
Note: Shaded areas denote recessions. The hires rate is the number of hires during the entire month as a percent of total employment. The layoff rate is the number of layoffs and discharges during the entire month as a percent of total employment. The quits rate is the number of quits during the entire month as a percent of total employment.
Source: EPI analysis of Bureau of Labor Statistics Job Openings and Labor Turnover Survey
Job Openings Were Stronger in 2014 than 2013 or 2012, but We Have Still Not Fully Recovered
The number of job openings hit 5.0 million in December, according to this morning’s Job Openings and Labor Turnover Summary (JOLTS)—a slight increase from 4.8 million in November. Meanwhile, according to the Census’s Current Population Survey, there was a slight drop in people looking for work, to 8.7 million. Taken together, this means there were 1.7 times as many job seekers as job openings in December—the lowest this ratio has been since November 2007.
This slight decline in the jobs-seekers-to-job-openings ratio is a continuation of its steady decrease, since its high of 6.8-to-1 in July 2009, as you can see in the figure below. If the economy were stronger, the ratio would be even smaller—a 1-to-1 ratio would mean that there were roughly as many job openings as job seekers—but this indicates that we are moving in the right direction.
With the December data, we can also look at what’s happened throughout 2014, compared to the rest of the recovery. The job-seekers-to-jobs-openings ratio has been consistently falling, from a high of 5.9 percent in 2009 down to an average of 2.1 percent average in 2014. The average annual ratio fell 0.8 over the last year.
While the outlook for jobless workers is clearly improving, the job-seekers-to-jobs-openings ratio fails to account for the full extent of declines in labor force participation over the course of the recovery. 8.7 million unemployed workers understates how many job openings will be needed when a robust jobs recovery finally begins, due to the 6.1 million potential workers (in December) who are currently not in the labor market, but who would be if job opportunities were strong. Many of these “missing workers” will go back to looking for a job when the labor market picks up, so job openings will be needed for them, too.
The job-seekers ratio, December 2000–December 2014
| Month | Unemployed job seekers per job opening |
|---|---|
| Dec-2000 | 1.1 |
| Jan-2001 | 1.1 |
| Feb-2001 | 1.3 |
| Mar-2001 | 1.3 |
| Apr-2001 | 1.3 |
| May-2001 | 1.4 |
| Jun-2001 | 1.5 |
| Jul-2001 | 1.5 |
| Aug-2001 | 1.7 |
| Sep-2001 | 1.8 |
| Oct-2001 | 2.1 |
| Nov-2001 | 2.3 |
| Dec-2001 | 2.3 |
| Jan-2002 | 2.3 |
| Feb-2002 | 2.4 |
| Mar-2002 | 2.3 |
| Apr-2002 | 2.6 |
| May-2002 | 2.4 |
| Jun-2002 | 2.5 |
| Jul-2002 | 2.5 |
| Aug-2002 | 2.4 |
| Sep-2002 | 2.5 |
| Oct-2002 | 2.4 |
| Nov-2002 | 2.4 |
| Dec-2002 | 2.8 |
| Jan-2003 | 2.3 |
| Feb-2003 | 2.5 |
| Mar-2003 | 2.8 |
| Apr-2003 | 2.8 |
| May-2003 | 2.8 |
| Jun-2003 | 2.8 |
| Jul-2003 | 2.8 |
| Aug-2003 | 2.7 |
| Sep-2003 | 2.9 |
| Oct-2003 | 2.7 |
| Nov-2003 | 2.6 |
| Dec-2003 | 2.5 |
| Jan-2004 | 2.5 |
| Feb-2004 | 2.4 |
| Mar-2004 | 2.5 |
| Apr-2004 | 2.4 |
| May-2004 | 2.2 |
| Jun-2004 | 2.4 |
| Jul-2004 | 2.1 |
| Aug-2004 | 2.2 |
| Sep-2004 | 2.1 |
| Oct-2004 | 2.1 |
| Nov-2004 | 2.3 |
| Dec-2004 | 2.1 |
| Jan-2005 | 2.2 |
| Feb-2005 | 2.1 |
| Mar-2005 | 2.0 |
| Apr-2005 | 1.9 |
| May-2005 | 2.0 |
| Jun-2005 | 1.9 |
| Jul-2005 | 1.8 |
| Aug-2005 | 1.8 |
| Sep-2005 | 1.8 |
| Oct-2005 | 1.8 |
| Nov-2005 | 1.7 |
| Dec-2005 | 1.7 |
| Jan-2006 | 1.7 |
| Feb-2006 | 1.7 |
| Mar-2006 | 1.6 |
| Apr-2006 | 1.6 |
| May-2006 | 1.6 |
| Jun-2006 | 1.6 |
| Jul-2006 | 1.8 |
| Aug-2006 | 1.6 |
| Sep-2006 | 1.5 |
| Oct-2006 | 1.5 |
| Nov-2006 | 1.5 |
| Dec-2006 | 1.5 |
| Jan-2007 | 1.6 |
| Feb-2007 | 1.5 |
| Mar-2007 | 1.4 |
| Apr-2007 | 1.5 |
| May-2007 | 1.5 |
| Jun-2007 | 1.5 |
| Jul-2007 | 1.6 |
| Aug-2007 | 1.6 |
| Sep-2007 | 1.6 |
| Oct-2007 | 1.7 |
| Nov-2007 | 1.7 |
| Dec-2007 | 1.8 |
| Jan-2008 | 1.8 |
| Feb-2008 | 1.9 |
| Mar-2008 | 1.9 |
| Apr-2008 | 2.0 |
| May-2008 | 2.1 |
| Jun-2008 | 2.3 |
| Jul-2008 | 2.4 |
| Aug-2008 | 2.6 |
| Sep-2008 | 3.0 |
| Oct-2008 | 3.1 |
| Nov-2008 | 3.4 |
| Dec-2008 | 3.7 |
| Jan-2009 | 4.4 |
| Feb-2009 | 4.6 |
| Mar-2009 | 5.4 |
| Apr-2009 | 6.1 |
| May-2009 | 6.0 |
| Jun-2009 | 6.2 |
| Jul-2009 | 6.8 |
| Aug-2009 | 6.5 |
| Sep-2009 | 6.2 |
| Oct-2009 | 6.5 |
| Nov-2009 | 6.3 |
| Dec-2009 | 6.1 |
| Jan-2010 | 5.5 |
| Feb-2010 | 6.0 |
| Mar-2010 | 5.8 |
| Apr-2010 | 5.0 |
| May-2010 | 5.1 |
| Jun-2010 | 5.3 |
| Jul-2010 | 5.0 |
| Aug-2010 | 5.0 |
| Sep-2010 | 5.2 |
| Oct-2010 | 4.8 |
| Nov-2010 | 4.9 |
| Dec-2010 | 5.0 |
| Jan-2011 | 4.8 |
| Feb-2011 | 4.6 |
| Mar-2011 | 4.4 |
| Apr-2011 | 4.5 |
| May-2011 | 4.5 |
| Jun-2011 | 4.3 |
| Jul-2011 | 4.0 |
| Aug-2011 | 4.3 |
| Sep-2011 | 3.9 |
| Oct-2011 | 4.0 |
| Nov-2011 | 4.2 |
| Dec-2011 | 3.7 |
| Jan-2012 | 3.5 |
| Feb-2012 | 3.7 |
| Mar-2012 | 3.3 |
| Apr-2012 | 3.5 |
| May-2012 | 3.4 |
| Jun-2012 | 3.3 |
| Jul-2012 | 3.5 |
| Aug-2012 | 3.4 |
| Sep-2012 | 3.4 |
| Oct-2012 | 3.2 |
| Nov-2012 | 3.2 |
| Dec-2012 | 3.4 |
| Jan-2013 | 3.3 |
| Feb-2013 | 3.0 |
| Mar-2013 | 3.0 |
| Apr-2013 | 3.1 |
| May-2013 | 3.0 |
| Jun-2013 | 3.0 |
| Jul-2013 | 3.0 |
| Aug-2013 | 2.9 |
| Sep-2013 | 2.8 |
| Oct-2013 | 2.8 |
| Nov-2013 | 2.6 |
| Dec-2013 | 2.6 |
| Jan-2014 | 2.6 |
| Feb-2014 | 2.5 |
| Mar-2014 | 2.5 |
| Apr-2014 | 2.2 |
| May-2014 | 2.1 |
| Jun-2014 | 2.0 |
| Jul-2014 | 2.1 |
| Aug-2014 | 2.0 |
| Sep-2014 | 2.0 |
| Oct-2014 | 1.9 |
| Nov-2014 | 1.9 |
| Dec-2014 | 1.7 |
Note: Shaded areas denote recessions.
Source: EPI analysis of Bureau of Labor Statistics Job Openings and Labor Turnover Survey and Current Population Survey
Increasing Labor Force Participation Leads to Fewer Missing Workers
The official unemployment rate ticked up slightly last month as more potential workers entered the labor force. While is it a positive sign that more people are actively looking for work, the unemployment rate still understates the weakness of job opportunities. This is due to the existence of a large pool of “missing workers”—potential workers who, because of weak job opportunities, are neither employed nor actively seeking a job. In other words, these are people who would be either working or looking for work if job opportunities were significantly stronger.
The number of missing workers has been hovering around 6 million for over a year. They fell slightly in January, which could be the start of a positive trend. As the economy gets stronger, I would expect more people to start looking for work. At this point, the fact remains that there are still 5.8 million missing workers. And, if the missing workers were actively looking for work, the unemployment rate would be 9.0 percent.
Millions of potential workers sidelined: Missing workers,* January 2006–January 2015
| Date | Missing workers |
|---|---|
| 2006-01-01 | 530,000 |
| 2006-02-01 | 110,000 |
| 2006-03-01 | 110,000 |
| 2006-04-01 | 250,000 |
| 2006-05-01 | 210,000 |
| 2006-06-01 | 110,000 |
| 2006-07-01 | 60,000 |
| 2006-08-01 | -120,000 |
| 2006-09-01 | 120,000 |
| 2006-10-01 | -50,000 |
| 2006-11-01 | -220,000 |
| 2006-12-01 | -500,000 |
| 2007-01-01 | -460,000 |
| 2007-02-01 | -210,000 |
| 2007-03-01 | -150,000 |
| 2007-04-01 | 650,000 |
| 2007-05-01 | 560,000 |
| 2007-06-01 | 360,000 |
| 2007-07-01 | 370,000 |
| 2007-08-01 | 840,000 |
| 2007-09-01 | 410,000 |
| 2007-10-01 | 800,000 |
| 2007-11-01 | 280,000 |
| 2007-12-01 | 250,000 |
| 2008-01-01 | -320,000 |
| 2008-02-01 | 220,000 |
| 2008-03-01 | 50,000 |
| 2008-04-01 | 340,000 |
| 2008-05-01 | -60,000 |
| 2008-06-01 | 20,000 |
| 2008-07-01 | -70,000 |
| 2008-08-01 | -90,000 |
| 2008-09-01 | 180,000 |
| 2008-10-01 | 60,000 |
| 2008-11-01 | 420,000 |
| 2008-12-01 | 420,000 |
| 2009-01-01 | 710,000 |
| 2009-02-01 | 620,000 |
| 2009-03-01 | 1,050,000 |
| 2009-04-01 | 750,000 |
| 2009-05-01 | 650,000 |
| 2009-06-01 | 650,000 |
| 2009-07-01 | 1,040,000 |
| 2009-08-01 | 1,320,000 |
| 2009-09-01 | 2,050,000 |
| 2009-10-01 | 2,270,000 |
| 2009-11-01 | 2,300,000 |
| 2009-12-01 | 3,120,000 |
| 2010-01-01 | 2,770,000 |
| 2010-02-01 | 2,690,000 |
| 2010-03-01 | 2,440,000 |
| 2010-04-01 | 1,940,000 |
| 2010-05-01 | 2,530,000 |
| 2010-06-01 | 2,950,000 |
| 2010-07-01 | 3,220,000 |
| 2010-08-01 | 2,830,000 |
| 2010-09-01 | 3,200,000 |
| 2010-10-01 | 3,640,000 |
| 2010-11-01 | 3,310,000 |
| 2010-12-01 | 3,800,000 |
| 2011-01-01 | 3,910,000 |
| 2011-02-01 | 4,110,000 |
| 2011-03-01 | 3,960,000 |
| 2011-04-01 | 4,000,000 |
| 2011-05-01 | 4,110,000 |
| 2011-06-01 | 4,220,000 |
| 2011-07-01 | 4,640,000 |
| 2011-08-01 | 4,100,000 |
| 2011-09-01 | 3,990,000 |
| 2011-10-01 | 4,090,000 |
| 2011-11-01 | 4,090,000 |
| 2011-12-01 | 4,150,000 |
| 2012-01-01 | 4,450,000 |
| 2012-02-01 | 4,180,000 |
| 2012-03-01 | 4,240,000 |
| 2012-04-01 | 4,630,000 |
| 2012-05-01 | 4,240,000 |
| 2012-06-01 | 4,060,000 |
| 2012-07-01 | 4,520,000 |
| 2012-08-01 | 4,630,000 |
| 2012-09-01 | 4,500,000 |
| 2012-10-01 | 3,930,000 |
| 2012-11-01 | 4,370,000 |
| 2012-12-01 | 4,070,000 |
| 2013-01-01 | 4,350,000 |
| 2013-02-01 | 4,790,000 |
| 2013-03-01 | 5,310,000 |
| 2013-04-01 | 5,060,000 |
| 2013-05-01 | 4,840,000 |
| 2013-06-01 | 4,700,000 |
| 2013-07-01 | 5,030,000 |
| 2013-08-01 | 5,150,000 |
| 2013-09-01 | 5,370,000 |
| 2013-10-01 | 6,120,000 |
| 2013-11-01 | 5,700,000 |
| 2013-12-01 | 5,950,000 |
| 2014-01-01 | 5,850,000 |
| 2014-02-01 | 5,650,000 |
| 2014-03-01 | 5,330,000 |
| 2014-04-01 | 6,210,000 |
| 2014-05-01 | 5,940,000 |
| 2014-06-01 | 5,950,000 |
| 2014-07-01 | 5,810,000 |
| 2014-08-01 | 5,890,000 |
| 2014-09-01 | 6,250,000 |
| 2014-10-01 | 5,720,000 |
| 2014-11-01 | 5,760,000 |
| 2014-12-01 | 6,100,000 |
| 2015-01-01 | 5,760,000 |
* Potential workers who, due to weak job opportunities, are neither employed nor actively seeking work
Note: Volatility in the number of missing workers in 2006–2008, including cases of negative numbers of missing workers, is simply the result of month-to-month variability in the sample. The Great Recession–induced pool of missing workers began to form and grow starting in late 2008.
Source: EPI analysis of Mitra Toossi, “Labor Force Projections to 2016: More Workers in Their Golden Years,” Bureau of Labor Statistics Monthly Labor Review, November 2007; and Current Population Survey public data series
Similarly, we saw a tick up in the employment-to-population ratio for prime-working-age population in January, following a trend that has been slowly moving in the right direction for years. That said, it’s clear that there is a long way to go before we return to pre-recession labor market health.
Employment-to-population ratio of workers ages 25–54, 2006–2015
| Month | Employment to population ratio |
|---|---|
| 2006-01-01 | 79.6% |
| 2006-02-01 | 79.7% |
| 2006-03-01 | 79.8% |
| 2006-04-01 | 79.6% |
| 2006-05-01 | 79.7% |
| 2006-06-01 | 79.8% |
| 2006-07-01 | 79.8% |
| 2006-08-01 | 79.8% |
| 2006-09-01 | 79.9% |
| 2006-10-01 | 80.1% |
| 2006-11-01 | 80.0% |
| 2006-12-01 | 80.1% |
| 2007-01-01 | 80.3% |
| 2007-02-01 | 80.1% |
| 2007-03-01 | 80.2% |
| 2007-04-01 | 80.0% |
| 2007-05-01 | 80.0% |
| 2007-06-01 | 79.9% |
| 2007-07-01 | 79.8% |
| 2007-08-01 | 79.8% |
| 2007-09-01 | 79.7% |
| 2007-10-01 | 79.6% |
| 2007-11-01 | 79.7% |
| 2007-12-01 | 79.7% |
| 2008-01-01 | 80.0% |
| 2008-02-01 | 79.9% |
| 2008-03-01 | 79.8% |
| 2008-04-01 | 79.6% |
| 2008-05-01 | 79.5% |
| 2008-06-01 | 79.4% |
| 2008-07-01 | 79.2% |
| 2008-08-01 | 78.8% |
| 2008-09-01 | 78.8% |
| 2008-10-01 | 78.4% |
| 2008-11-01 | 78.1% |
| 2008-12-01 | 77.6% |
| 2009-01-01 | 77.0% |
| 2009-02-01 | 76.7% |
| 2009-03-01 | 76.2% |
| 2009-04-01 | 76.2% |
| 2009-05-01 | 75.9% |
| 2009-06-01 | 75.9% |
| 2009-07-01 | 75.8% |
| 2009-08-01 | 75.6% |
| 2009-09-01 | 75.1% |
| 2009-10-01 | 75.0% |
| 2009-11-01 | 75.2% |
| 2009-12-01 | 74.8% |
| 2010-01-01 | 75.1% |
| 2010-02-01 | 75.1% |
| 2010-03-01 | 75.1% |
| 2010-04-01 | 75.4% |
| 2010-05-01 | 75.1% |
| 2010-06-01 | 75.2% |
| 2010-07-01 | 75.1% |
| 2010-08-01 | 75.0% |
| 2010-09-01 | 75.1% |
| 2010-10-01 | 75.0% |
| 2010-11-01 | 74.8% |
| 2010-12-01 | 75.0% |
| 2011-01-01 | 75.2% |
| 2011-02-01 | 75.1% |
| 2011-03-01 | 75.3% |
| 2011-04-01 | 75.1% |
| 2011-05-01 | 75.2% |
| 2011-06-01 | 75.0% |
| 2011-07-01 | 75.0% |
| 2011-08-01 | 75.1% |
| 2011-09-01 | 74.9% |
| 2011-10-01 | 74.9% |
| 2011-11-01 | 75.3% |
| 2011-12-01 | 75.4% |
| 2012-01-01 | 75.6% |
| 2012-02-01 | 75.6% |
| 2012-03-01 | 75.7% |
| 2012-04-01 | 75.7% |
| 2012-05-01 | 75.7% |
| 2012-06-01 | 75.7% |
| 2012-07-01 | 75.6% |
| 2012-08-01 | 75.7% |
| 2012-09-01 | 75.9% |
| 2012-10-01 | 76.0% |
| 2012-11-01 | 75.8% |
| 2012-12-01 | 75.9% |
| 2013-01-01 | 75.7% |
| 2013-02-01 | 75.9% |
| 2013-03-01 | 75.9% |
| 2013-04-01 | 75.9% |
| 2013-05-01 | 76.0% |
| 2013-06-01 | 75.9% |
| 2013-07-01 | 76.0% |
| 2013-08-01 | 75.9% |
| 2013-09-01 | 75.9% |
| 2013-10-01 | 75.5% |
| 2013-11-01 | 76.0% |
| 2013-12-01 | 76.1% |
| 2014-01-01 | 76.5% |
| 2014-02-01 | 76.5% |
| 2014-03-01 | 76.6% |
| 2014-04-01 | 76.5% |
| 2014-05-01 | 76.4% |
| 2014-06-01 | 76.8% |
| 2014-07-01 | 76.6% |
| 2014-08-01 | 76.8% |
| 2014-09-01 | 76.8% |
| 2014-10-01 | 76.9% |
| 2014-11-01 | 76.9% |
| 2014-12-01 | 77.0% |
| 2015-01-01 | 77.2% |
Source: EPI analysis of Bureau of Labor Statistics' Current Population Survey public data series.
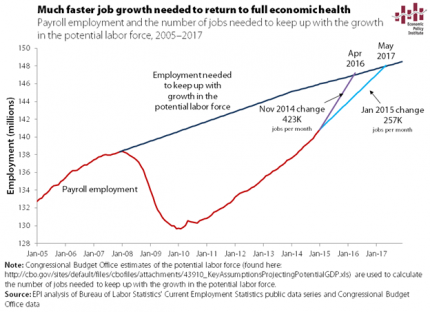
Much Stronger Job Growth is Needed If We’re Going to See a Healthy Economy Any Time Soon
Today’s job report is a solid start to the new year, and could be a sign that the economy has shifted into a slightly higher gear. At 257,000 jobs a month, we would get to pre-recession labor market health by May 2017 (as shown in the figure below).
The BLS revisions to 2014 payroll employment suggest moderately faster growth than initially reported last year, particularly in the last quarter of 2014. If we were to use the highest rate of growth last year—November’s 423,000 jobs added—in each ensuing month, we would return to 2007 labor market health by April 2016, over a year sooner.
There is no reason to expect a much faster growth rate of jobs, but stronger numbers on jobs will hopefully translate into decent wage growth sometime in the foreseeable future. It’s not there yet, but we can only hope.