Opinion pieces and speeches by EPI staff and associates.
[THIS TESTIMONY WAS GIVEN BEFORE THE U.S. SENATE DEMOCRATIC POLICY COMMITTEE HEARING ON JUNE 6, 2003.]
[FOR AN UPDATE TO SOME OF THE POINTS DISCUSSED IN THIS TESTIMONY, PLEASE SEE THE REPORT GRADING THE ‘JOBS AND GROWTH PLAN’![]() AND JOBWATCH.ORG.]
AND JOBWATCH.ORG.]
Grading the Bush “Jobs and Growth Plan”
By Lawrence Mishel and Jared Bernstein
Introduction
Thank you for this opportunity to present testimony about these critical issues.
Despite the fact that the economy has been expanding for over a year, our labor market remains mired in a jobless recovery, and these conditions are now hurting the living standards of working families. At a time like this, when the private sector is simply not generating enough economic activity to lower unemployment and broadly raise incomes, it is appropriate, indeed essential, for economic policy makers to act to stimulate growth. The President and the Congress claim to have done so with the passage of the Jobs and Growth Tax Relief Reconciliation Act of 2003, but as our testimony argues, this plan is unlikely to provide the boost the economy needs.
However, a central question is how will economists, policy makers and citizens know whether the plan lives up to its name? A key portion of our testimony offers an important benchmark against which to evaluate the administration’s claim regarding the stimulative effect of their plan.
Our main points are:
- We stress four key indicators of current labor market weakness—unemployment, job loss, household income, and wage growth.
- Unemployment has averaged 5.8% over the past year, and most recently hit 6.1%, two points above the 2000 rate of 4%. Since then, over 3 million more persons have been added to the ranks of the unemployed.
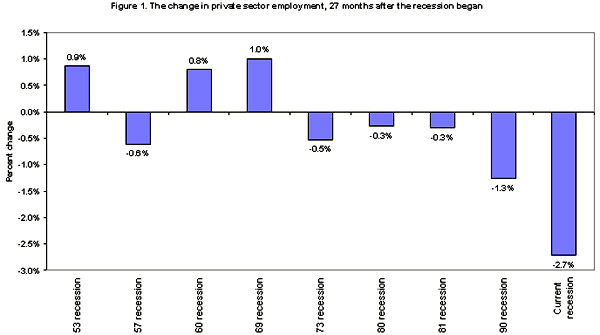
- Private-sector payrolls are down 260,000 this year and are down by 3.1 million, or 2.8%, since the recession began in March of 2001, the largest percentage decline in any post-WWII recession.
- Persistently high unemployment has caught up with wage growth; for the first time since the 1990s, real median earnings fell for the last four quarters in a row.
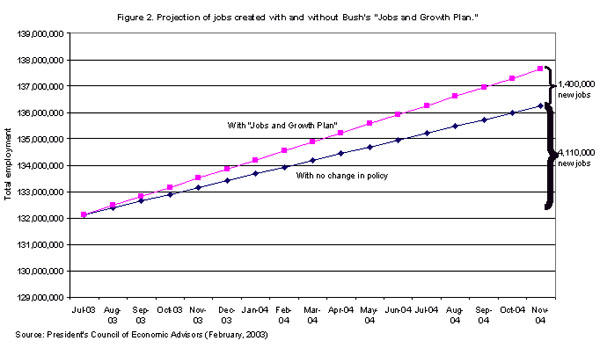
- The administration argued that its tax cut would lead to the creation of 1.4 million new jobs by the end of 2004. But it is not widely recognized that according to their own projections, these new jobs are expected in addition to the 4.1 million jobs the economy would generate on its own without the tax cuts.
- Thus, for their plan to accomplish its stated goal, the economy will need to generate an average of 344,000 new jobs per month between now and the end of 2004.
Current Labor Market Conditions
Before we assess the potential of the new tax plan to meet its stated goals, it is important to establish the extent of weakness in the current economy. We are specifically interested in that part of the economy most vital to the living standards of the vast majority of families: the labor market. We cite four indicators that measure the weakness in the current labor market: unemployment, job loss, household income, and wage decline.
Although the end of the recession that began in March 2001 has not been officially dated, most analysts believe it ended in late 2001 or early 2002. However, despite the fact that the economy has expanded consistently since then, it is readily apparent that what growth we have achieved is far below the level necessary to add jobs, generate wage growth, or provide broadly shared prosperity.
First, unemployment has been hovering around 5.8% for over a year and was 6.1% in May. Although unemployment has not reached the levels of other recessions, it is still 2% higher than the 4% rate in 2000. Returning to a 4% unemployment rate is not only possible, but should be an articulated goal of economic policy makers.
Second, a better indicator of labor market slack is the severe loss of jobs, especially private sector jobs. The newly revised data reveal that private-sector employment has fallen by 3.1 million jobs in this downturn. This is a 2.8% employment decline, far larger than in any other post-war recession. (See Figure #1).
How do we reconcile these developments – severe job loss but without historically high unemployment? The answer is that the labor force, which is normally expected to grow 1% a year, has grown far more slowly than that. Why? Because about two million people have dropped out of the labor force and are not counted as unemployed. If they were still in the labor force, many would presumably be unsuccessfully seeking work and unemployment would be higher, probably more than 6.6%.
When the economy really starts growing again, this “missing labor force” may show up again – seemingly from nowhere – to search for the emerging job opportunities. This will make it more difficult to reduce the official unemployment rate.
Another important dimension of the jobless recovery is long-term unemployment. The fact that the number of unemployed far outpace the number of job vacancies (by about 3 to 1, according to the BLS vacancy survey) has led to recessionary levels of unemployment spells. The most recent data from April and May 2003 show that the average unemployment spell was, respectively, 19.6 and 19.2 weeks in length. These are as high as the mean duration of unemployment spells in the deeper recessions of the 1980s and 1990s.
Thus, when we consider the slow growth of the labor force, the sharp contraction of payroll employment, and the historically very high levels of long-term joblessness, the fact that unemployment is “only” 6% offers little solace.
A third indicator of current weakness is household income. Rising unemployment forced an across-the-board decline in real household incomes in 2001, with the median household losing 2.2%, or $934.
That is a large loss for what seems a relatively small rise in unemployment from 4.0% to 4.8%. When the data for 2002 are released in September, they are highly likely to show an even larger decline between 2001 and 2002. Similarly, further losses are likely occurring this year due to continued employment losses and the added problem of real wage decline.
This new problem—real wage decline—is our fourth indicator of current labor market weakness. Despite the fact that unemployment began to rise in late 2000, there was enough momentum left over from the full employment/fast productivity growth environment of the latter 1990s to keep earnings rising into 2001, when real weekly wages grew 2.5% at the median. But persistently high unemployment has now caught up to wage growth. Last year, nominal wage growth slowed by 1 to 1.5%, and, with the higher inflation that lasted through the first quarter of this year, this has led to real wage declines. These real losses are occurring throughout the wage scale, reaching high, middle and low wage workers.
The Bureau of Labor Statistics data on the weekly wages of full-time workers illustrate the current scope in the decline in real wages. Over the last four quarters the real weekly wages of the median worker (who earns more than half the workforce and less than half the workforce) fell 1.4%. This is the first time since 1990 that real earnings for middle-wage workers have declined for four quarters in a row. Real wages have also declined for high wage workers (at t
he 90th percentile, a worker who earns more than 90% of the workforce), falling 1.4% over the last year. Low-wage workers saw their real weekly wages fall slightly, by 0.3% (these figures for high and low wage workers refer to those 25 years and older).
The large employment decline and fall in real wages has caused the total wages earned by all workers to grow very slowly during this economic downturn. As a result the growth in total wages has contributed far less to the overall growth in disposable personal income in this downturn than in prior downturns. Averaging over four prior downturns, we found that wage growth contributed 27% to the growth of disposable income, compared to 9% in the current period.
Since disposable personal income provides the basis for consumption spending, which is two-thirds of total spending in the economy, these employment losses and wage reductions are undercutting economic growth. We have written more extensively about this in a recent paper, “Jobless Recovery Catches Up With Wages, Stifles Growth.”
Looking ahead,there are two risks to consider in regards to wages and incomes. First, continued employment decline or stagnation combined with continued reductions in real wages will lead to sluggish consumption growth and will constrain the strength of the recovery. Second, as stressed above, wage trends lag overall economic growth by at least a year if not more. Thus, even if the economy were to pick up speed in the near term, it will be considerably longer before broad-based wage growth returns.
Jobs In The Future
That we need more jobs, need to lower unemployment and need to generate greater wage growth seems obvious. How to achieve these goals has been the focus of the debate about President Bush’s “Jobs and Growth Plan” and the competing plans offered by Democrats.
The recently passed package of tax cuts follows a misguided approach to creating jobs in the near future. First, it contains permanent, or semi-permanent, tax cuts when the need is for temporary one-time tax relief. The consequence is that the plan is far more expensive than is needed and will lead to chronic deficits, which ultimately will end up destroying jobs ten years from now.
Second, the tax cuts are directed in ways that are very ineffective at creating jobs. Nearly all economists agree that excluding taxes on dividends and capital gains will have very little effect on job growth in the near-term. Tax breaks for business expenses will also not create jobs. Businesses have the funds to invest in new equipment and credit is readily available at very low interest rates. Yet, there is very little investment now. The reason is that we have substantial overcapacity. What business needs is more customers – people to sell to. As demand grows, so will jobs and investment.
Third, as is well known, the personal income tax cuts are largely directed at high-income families—according to estimates by Brookings/Urban Institute Tax Center, 62% of the cuts go to households in the top 5% of the income scale. Since these families have higher saving rates — spend a lower share of their income — the income tax cuts will be less effective at generating spending than tax relief aimed at low-income and middle-income families.
Nevertheless, the Bush plan has now been enacted. This presents the analytical issue of how to judge whether it works.
As payroll employment declined by more than half a million in three months and unemployment rose to 6.0%, Bush’s tax cut plan was promoted as a way to create jobs.
A White House press release dated April 24, 2003 was very specific about the additional jobs the president expects his tax cuts to create:
President Bush traveled to Ohio to discuss the benefits of his jobs and growth plan with local small business owners and workers at the Timken Company in Canton….The president is working to grow the economy and create the largest number of new jobs possible for America’s workers. He has proposed a jobs and economic growth plan that would help create 510,000 new jobs this year and a total of 1.4 million new jobs by the end of next year. The president will not be satisfied until everyone looking for work can find it.
It remains to be seen, however, whether the Bush Administration’s plan will work. How will we know whether the plan has succeeded or how well?
No matter how badly the economy performs over the next 16 months, it is almost certain to create at least some jobs. After all, in the last century, only Herbert Hoover left office without creating any net jobs during his administration.
But it will not be possible to know whether the jobs were generated as a result of Bush’s tax cuts without knowing how many jobs would have been created in the absence of the tax cuts (the “baseline” growth, in technical jargon). As the accompanying table shows, the President’s Council of Economic Advisers (CEA) expect that, even without tax cuts, 4.1 million jobs would be created over the 16 months between July 2003 and the fourth quarter of 2004 (whose middle month is November 2004). Thus, the additional 1,400,000 jobs President Bush is promising raise the total number of jobs to be created by November 2004 to 5,510,000. In monthly terms, the CEA expects the economy to generate 256,875 jobs each month even without passage of the “Jobs and Growth Plan,” and 344,375 jobs per month with its passage. These projections are based on the nonfarm payroll employment data published monthly by the Bureau of Labor Statistics. So, the best yardstick for judging the success of the Bush Administration’s economic policy is its own CEA’s projections: if the economy generates the promised 5,510,000 jobs by November 2004, the plan and the President will have succeeded.
The accompanying chart (Table 1) shows the CEA’s job growth projections both with and without the passage of the Bush plan. Is this a fair metric of success? Absolutely. First, the baseline, or expected job growth (a 2.3% annual growth over 16 months) is certainly in line with recent history: job growth was at a 2.2% per yearly rate in the 16 months after unemployment reached its high point in June 1992, and averaged 2.5% per year from 1993 to 2000. Second, the recently passed tax package actually has a larger fiscal impact in 2003 and 2004 than the initial Bush plan ($210 billion versus $154 billion) that was the basis for these projections. Third, this yardstick ignores the more than 260,000 jobs already lost this year (and the 3.1 million since the recession began in March 2001), so grading the Bush plan in this way doesn’t penalize it for the disappointing job growth since 2000.
Conclusion
The U.S. economy is in dire straits, undergoing a lengthy downturn, high unemployment, a fall in real wages, declining family incomes, and extensive job losses. Obviously, economic policy should be geared to job creation. The Bush Administration’s plan makes many important choices with long-lasting consequences: spending priorities (defense, homeland security, education, health, state fiscal relief, etc.), the course of fiscal deficits into the future, the distribution and timing of tax cuts, and the economic role of government. It is important to gauge whether this economic policy will keep the promises regarding job generation made by the Bush Administration. The administration has projected that its growth plan will create 1.4 million jobs in addition to the 4.1 million jobs the economy was already expected to generate. The success of the Bush “Jobs and Growth Plan” can be fairly judged by whether, in fact, 5.5 million jobs are created by the end of 2004. Every citizen can grade the Bush policy by checking the nonfarm payroll employment series each month. Any month that adds at least 344,000 jobs to the economy can be marked a success. And every month payro
lls grow by less than 257,000 jobs, the policy is generating fewer jobs than would have been created without the “jobs and growth” plan.
Bibliography
Council of Economic Advisers, Strengthening America’s Economy: The President’s Jobs and Growth Proposals, February 4, 2003.

Lawrence Mishel is president of the Economic Policy Institute. Jared Bernstein is an economist at the Economic Policy Institute.
[ POSTED TO VIEWPOINTS ON JUNE 9, 2003 ]