Summary
What this paper finds: Legislative measures restricting public-sector collective bargaining rights enacted in Idaho, Indiana, Michigan, Tennessee, and Wisconsin in 2011 and 2012 significantly reduced school districts’ spending on teacher compensation, including both teacher salaries and teacher benefits. The cuts in spending were sizable: In the years following the changes, average school district spending on teacher compensation decreased by about 6%, with spending on teacher salaries falling by about 5% and spending on teacher benefits declining by 9.7% in the five states relative to the rest of the states.
Why it matters: Reduced education spending and lowered teacher compensation have negative repercussions for teacher labor markets and student outcomes. Teachers in the five states were affected regardless of union membership. The effects can be extrapolated to other states that have also experienced significant curbs to public-sector workers in recent years, and they may shed light on some consequences of the 2018 Supreme Court decision in Janus v. American Federation of State, County, and Municipal Employees.
Introduction
The U.S. Supreme Court’s 2018 decision in Janus v. American Federation of State, County, and Municipal Employees (AFSCME) (referred to as Janus hereafter) prohibited state and local government worker unions from negotiating collective bargaining agreements with fair share fee arrangements. The court agreed with the plaintiff’s claim that the fair share fees (known also as “agency fees”) violate workers’ First Amendment rights of freedom of speech and association. This dramatic legal change makes it harder for public-sector unions to be effective.1 However, its full repercussions on membership, employment conditions, and other outcomes for public-sector workers remain to be investigated.
Because the Janus decision is relatively recent, it is too early to assess its comprehensive impacts. However, we can anticipate the direction that Janus is taking us by examining legislation that was passed by several U.S. states in the last decade that also substantially restricted public-sector bargaining rights. Though the laws in Idaho, Indiana, Michigan, Tennessee, and Wisconsin lack the scale of the Janus decision, and though they differ from one another and from the substance and the legal focus of Janus, all have—like Janus—been described as an attack on unions’ membership and strength.
In this report, we examine state collective bargaining restrictions on public-sector unions and how they impact spending on teacher compensation. Specifically, we develop a framework to estimate how spending on teacher compensation was affected by changes in the legal institutions (laws, court decisions, and other administrative mechanisms) governing public-sector unions in five states that experienced these changes early in the previous decade. There are two purposes of this study. First, our framework and the analysis, with the necessary adjustments to scale, contexts, and timelines, could be used in the near future to understand and estimate the impact on public-sector workers of the Janus decision (or of laws, court decisions, and other administrative mechanisms of a similar nature). Second, our results also set the stage for other important and broad questions regarding the affected education systems. These institutional changes that influence districts’ spending on teacher compensation may also shift the career decisions of individuals who otherwise may have chosen a teaching profession, and they may have implications for student outcomes. Thus, this study can help policymakers better grasp the role of teachers unions in the post-Janus era by exploring pre-Janus events that affected the educational sector.
We find that the pre-Janus legal changes weakening teachers unions in Idaho, Indiana, Michigan, Tennessee, and Wisconsin effectively reduced spending on total teacher compensation by about 6%, reduced teacher salaries by about 5%, and reduced teacher benefits by 9.7%. Even though it is not possible to use these results to exactly estimate the impact of Janus on union and nonunion teachers (nor to assess the impact of any other policy changes in states occurring within different contexts and under different timelines), the evidence from our study serves as an early warning of potentially negative repercussions of Janus on similar outcomes.
The legal environment for public-sector workers differs from that for private-sector workers
Legal environments and labor laws in each state play critical roles in the labor market for public-sector workers because they govern the breadth of worker rights and employment conditions. For private-sector workers, the exercise of collective bargaining rights is regulated by the country’s fundamental labor law, the 1935 National Labor Relations Act (NLRA) and the National Labor Relations Board (NLRB) established to administer and enforce the NLRA.2
For public-sector employees, there is no one national labor law or administrative body governing the entirety of collective bargaining rights. Instead, state laws and administrative bodies (1) govern whether collective bargaining (CB) among public-sector employees is mandated, legal, or prohibited, (2) govern whether public-sector employees are allowed to strike, and (3) shape the work environment and labor market outcomes. Prior to Janus, these institutions also governed whether unions were permitted to collect fair share fees from nonunion members (Winkler, Scull, and Zeehandelaar 2012; Hanushek 2020). After the Janus decision deemed public-sector agency fees unconstitutional, nonmembers were no longer required to pay fair share fees for union services, even though they are covered by the same bargaining contracts as union members.
Over half of union workers in the United States are in the public sector, and public school teachers make up the single largest group of public-sector unionized employees (Wolf and Schmitt 2018). According to a report by the National Center for Education Statistics (NCES), approximately seven in 10 (70%) of the close to 4 million public school teachers were members of a union or employee association in the 2015–2016 school year (NCES n.d.). Therefore, examining the role of legal institutions governing collective bargaining in the educational sector can also speak to the nature of public-sector unions in general and how they operate in various legal environments.
The existing research finds that the legal frameworks stipulating how teachers unions operate influence teacher well-being, teacher qualifications, and the educational landscape more broadly because the unions affect the level of revenue available to each district and how districts allocate their educational spending (Han 2019, 2020; Jones, Bettini, and Brownell 2016; Cowen and Strunk 2015; Moe 2011; Moore-Johnson et al. 2007).
The last decade brought major changes in legal institutions governing collective bargaining for public school teachers in some states
State and local governments began enacting labor laws to govern public-sector unions in the 1950s and 1960s. Some laws prohibited collective bargaining for their public-sector workers, some created a framework for a full set of collective bargaining rights (e.g., including a right to strike, a right to bargain over wages, etc.), and some created no framework but did not prohibit collective bargaining (Paglayan 2019; Keefe 2015).3
Most states established their own legal institutions for teachers unions in the 1960s, 1970s, and 1980s, and these laws changed little through the first decade of the new century.
The map in Figure A, reproduced from Han (2019), shows various legal environments in which teachers unions operated as of 2010. Based on the long-established state laws, the states are grouped into four categories according to two legal criteria: whether public school teacher collective bargaining is legal and/or mandatory for employers, and whether nonunion members can be required to pay fair share fees. (Notice that the fair share fee criterion is no longer applicable after Janus. See Han 2019 for more details).
States with no to high levels of collective bargaining rights for teachers as of 2010
| State | Group | Abbreviation |
|---|---|---|
| Alaska | High-CB Group | AK |
| California | High-CB Group | CA |
| Connecticut | High-CB Group | CT |
| Delaware | High-CB Group | DE |
| Hawaii | High-CB Group | HI |
| Illinois | High-CB Group | IL |
| Maine | High-CB Group | ME |
| Maryland | High-CB Group | MD |
| Massachusetts | High-CB Group | MA |
| Michigan | High-CB Group | MI |
| Minnesota | High-CB Group | MN |
| Montana | High-CB Group | MT |
| New Hampshire | High-CB Group | NH |
| New Jersey | High-CB Group | NJ |
| New Mexico | High-CB Group | NM |
| New York | High-CB Group | NY |
| Ohio | High-CB Group | OH |
| Oregon | High-CB Group | OR |
| Pennsylvania | High-CB Group | PA |
| Rhode Island | High-CB Group | RI |
| Vermont | High-CB Group | VT |
| Washington | High-CB Group | WA |
| Wisconsin | High-CB Group | WI |
| Florida | Mid-CB Group | FL |
| Idaho | Mid-CB Group | ID |
| Indiana | Mid-CB Group | IN |
| Iowa | Mid-CB Group | IA |
| Kansas | Mid-CB Group | KS |
| Nebraska | Mid-CB Group | NE |
| Nevada | Mid-CB Group | NV |
| North Dakota | Mid-CB Group | ND |
| Oklahoma | Mid-CB Group | OK |
| South Dakota | Mid-CB Group | SD |
| Tennessee | Mid-CB Group | TN |
| Washington D.C. | NA | DC |
| Alabama | Low-CB Group | AL |
| Arkansas | Low-CB Group | AR |
| Colorado | Low-CB Group | CO |
| Kentucky | Low-CB Group | KY |
| Louisiana | Low-CB Group | LA |
| Missouri | Low-CB Group | MO |
| Utah | Low-CB Group | UT |
| West Virginia | Low-CB Group | WV |
| Wyoming | Low-CB Group | WY |
| Arizona | No-CB Group | AZ |
| Georgia | No-CB Group | GA |
| Mississippi | No-CB Group | MS |
| North Carolina | No-CB Group | NC |
| South Carolina | No-CB Group | SC |
| Texas | No-CB Group | TX |
| Virginia | No-CB Group | VA |

Source: Adapted with permission from Eunice Han, “The Impact of Teachers Unions on Teachers’ Well-Being Under Various Legal Institutions: Evidence from District–Teacher Matched Data” (Han 2019).
The “High-CB” group is composed of 23 states with “duty-to-bargain” laws (under which employers have a duty to bargain with the employee union) and allowed mandatory fair share fees for nonunion members. For example, New York and New Jersey were “High-CB” states. The second group, the “Mid-CB” group, is composed of states that also had duty-to-bargain laws but prohibited mandatory fair share fees. There were 11 states in this group. The third group, the “Low-CB” group, comprises states where local school districts are allowed to sign collective bargaining agreements but bargaining is not mandatory, and nine states, including Colorado, Louisiana, Utah, and Wyoming, are in this group. The last group, the “No-CB” group, includes states in which collective bargaining for teachers is banned, and there are seven states in this group: Arizona, Georgia, Mississippi, North Carolina, South Carolina, Texas, and Virginia.
In the last decade, however, several states have experienced significant alterations of their long-standing legislation governing the environment in which public-sector unions can operate. In 2011–2012, state legislators in Idaho, Indiana, Michigan, Tennessee, and Wisconsin launched unprecedented initiatives substantially restricting or entirely prohibiting the collective bargaining rights of public-sector employees, including public school teachers.
In 2011, Indiana enacted a law stating that collective bargaining is no longer mandatory, and only wages and wage-related items can be part of the collective bargaining process. In 2011, Tennessee passed the Professional Educators’ Collaborative Conferencing Act, making collective bargaining for teachers illegal. Wisconsin’s Act 10 enacted in 2011 eliminated fair share fees for public employee unions and restricted public-sector collective bargaining to only wage and wage-related items. It also capped the annual growth in affected public-sector workers’ base pay to the rate of inflation and required teachers unions to obtain annual recertification, a laborious process in which unions that already received enough employee votes to be created must ask their members to vote for the union again every year to retain its status. In Idaho, in 2012, teacher collective bargaining was no longer permitted unless the union could validate that at least half of a district’s teachers were union members. The new law also limited the scope of collective bargaining to teacher salaries and benefits. In 2012, the Michigan legislature passed the “Freedom to Work” law, a so-called right-to-work (RTW) law.4 Michigan’s RTW law reduced the financial strength of unions by making it illegal for a group of unionized workers to negotiate a collective bargaining contract that includes fair share fees for nonmembers covered by the contract. (Note that the Janus decision has been described as a decision that effectively made all states into RTW states for the public sector.)
These new laws became effective as early as 2012. After the laws curbing public-sector collective bargaining rights in these five states became effective, the changes were so significant that the states slid down the categorization used by Han (2019): Wisconsin moved from the High-CB group to the Mid-CB group; Michigan moved from the High-CB group to the Low-CB group; Idaho and Indiana moved from the Mid-CB group to the Low-CB group; and Tennessee moved from the Mid-CB group to the No-CB group.5
There are several ways laws curbing public-sector collective bargaining could have affected education spending in these five states
The stated motivation for these legal changes made in the states was the need to fix the holes in state budgets in the aftermath of the Great Recession.6 During the Great Recession, national public school per-pupil spending fell by roughly 7% overall—over 10% in seven states and more than 20% in two states (Jackson, Wigger, and Xiong 2018). The changes also derived from major changes in the political dominance of the states’ legislatures. For instance, for four out of five of these states (Indiana, Michigan, Tennessee, and Wisconsin), the legislative measures limiting teachers’ collective bargaining rights occurred right after a Republican governor replaced a Democratic governor. Idaho had elected Republican governors since 1994.
Surprisingly, despite the debate over the reasons, the consequences of these changes are still not well understood. In particular, research has not established how these changes impacted teachers unions and whether they impacted district spending on teacher compensation, the largest portion of school spending (NCES 2018).
There are direct and indirect ways in which the restrictions on collective bargaining in Idaho, Indiana, Michigan, Tennessee, and Wisconsin could influence district spending on teacher compensation. Directly, spending on teacher compensation could decrease as a result of some of the restrictions on collective bargaining rights over teacher salaries and benefits, such as the cap on salary increase to the level of inflation (which is about 2%, see Bureau of Labor Statistics) and the ban on unions negotiating over benefits (Freeman and Han 2013; Han 2019; Workman 2011; Lafer 2013; Goldstein 2014).
Indirectly, districts’ spending on teacher compensation would decrease as the changes in legal institutions ultimately weaken the strength of public-sector unions (Han 2020; Freeman and Han 2013). As the bargaining power of teachers unions weakens, the demand for unions is more likely to fall, as more teachers expect lower benefits from unionization. This lowered demand and reduced union membership would put pressure on the financial capability of unions, decreasing their bargaining power even more. Finally, in states where unions could no longer collect mandatory fair share fees from nonunion members, the “free-rider” problem may arise (Freeman, Han, and Rogers 2015). The free-rider problem refers to the likelihood that some teachers in the bargaining unit—knowing that the union must represent them regardless of membership—may want to enjoy the advantages conferred by union contracts without paying for them, which is likely to further undermine unions’ financial capacity (Marianno and Strunk 2018). To the extent that lower membership and dwindling financial capacity will negatively affect the bargaining power of unions, these changes in legislation may further reduce districts’ spending on teacher compensation.
Past research indicates potential consequences of changing collective bargaining laws on teacher outcomes
Given these direct and indirect ways in which changing collective bargaining laws could affect spending on teacher compensation, we expect to observe substantial adverse impacts on teachers’ labor markets in the five states in our study. Before providing the estimates, we discuss additional potential consequences of reducing collective bargaining rights on other various teacher and student outcomes, according to the existing literature.
The existing research has long found a positive relationship between teachers unions and various teacher outcomes. For instance, teachers unions increase teacher salaries, raise nonwage benefits, improve working conditions, and reduce turnover (Freeman and Medoff 1984; Hoxby 1996; Ingersoll 2001; Podgursky 2003; Hirsch, Macpherson, and Winters 2011; West 2015; Han 2019; Han 2020).7 Further, the institutional changes that may have decreased spending on teacher compensation may also lead to undesirable consequences for students, through the following channels.
Numerous studies suggest that decreases in teacher pay and educational spending have adverse effects on educational outcomes of students. For example, according to the efficiency wages theory, higher salaries lead to higher-quality students entering the education field with greater interest in becoming a teacher (Figlio 1997; Hanushek, Piopiunik, and Wiederhold 2019; Leigh 2012; Manski 1987; Podolsky et al. 2019); higher quality teachers (Britton and Propper 2016; Hendricks 2014); and reduced teacher turnover (Ronfeldt, Loeb, and Wyckoff 2013; Sorensen and Ladd 2018; Loeb, Darling-Hammond, and Luczak 2005; Podolsky et al. 2019; Katz 2018; Gray and Taie 2015; Grissom, Viano, and Selin 2015; Stockard and Lehman 2004; Murnane and Olsen 1989).8
Moreover, growing evidence points to positive effects of higher spending on short- and long-term student outcomes (Jackson, Johnson, and Persico 2016; Gibbons, McNally, and Viarengo 2018; Hyman 2017; Lafortune, Rothstein, and Whitmore-Schanzenbach 2018; Jackson 2018; Baker 2018), and also to negative effects of spending cuts on student outcomes (Jackson, Wigger, and Xiong 2018).
These bodies of research suggest that ultimately, the changes in legal institutions toward teachers unions could pose serious threats to the educational system as a whole by deteriorating both teacher labor market conditions and student performance.
The empirical analysis: States with weakened collective bargaining rights have seen a relative decline in spending on teacher compensation
To estimate the effect of weakened collective bargaining rights on spending on teacher compensation, we used two national-level data sources: the Local Education Agency (School District) Finance Survey (F-33), administered by NCES, and the Stanford Education Data Archive (SEDA) from 2009 to 2016. (More detailed characteristics of the data and the analyses are included in the Appendix.) We employ a statistical method that allows us to estimate the causal impact of the change in legal institutions weakening teachers unions by comparing district spending on teacher compensation in the five states that enacted the legal changes in the study period (our treatment group) with spending in districts in all other states (our control group).
Before we offer these estimates, we first plot the trends in spending on teacher compensation and its two main components, salaries and benefits, in the districts in the treatment and control groups. Figures B and C show the time trend for public school district spending on teacher salaries and teacher benefits, respectively.
States that restricted collective bargaining saw a relative decline in spending on teacher salaries: Average per school district spending on teacher salaries in five states that restricted teachers’ collective bargaining rights in 2011–2012 and in all other states, 2008–2016
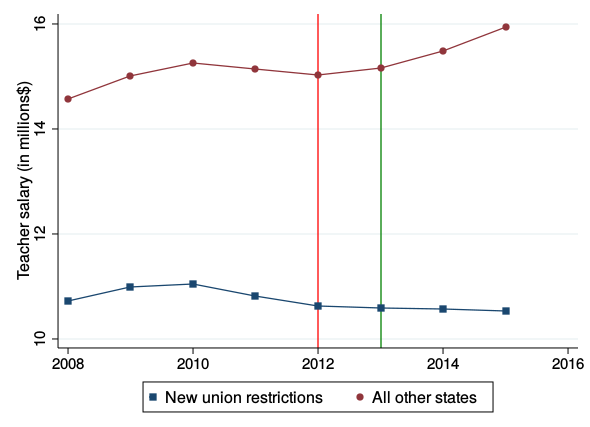
Note: The five states are Idaho, Indiana, Michigan, Tennessee, and Wisconsin. Data are for elementary and secondary public school districts.
Source: Local Education Agency Finance Survey microdata from the National Center for Education Statistics (NCES 2008–2009 to 2015–2016)
In both cases, we can see that spending patterns diverge after the legal changes in 2011–2012. Spending on both teacher salaries and teacher benefits continuously increases in the control group but levels off (salaries) and falls (benefits) in the states with new restrictions on collective bargaining starting in 2012.
States that restricted collective bargaining saw a relative decline in spending on teacher benefits: Average per school district spending on teacher benefits in five states that restricted teachers’ collective bargaining rights in 2011–2012 and in all other states, 2008–2016
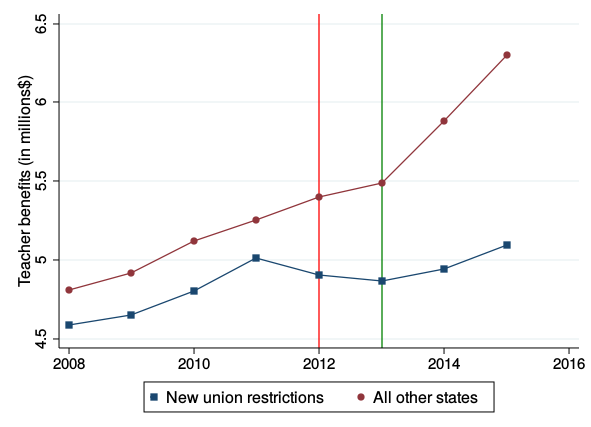
Note: The five states are Idaho, Indiana, Michigan, Tennessee, and Wisconsin. Data are for elementary and secondary public school districts.
Source: Local Education Agency Finance Survey microdata from the National Center for Education Statistics (NCES 2008–2009 to 2015–2016)
Next we estimate the impact of the legal changes that weakened teachers unions on spending on teacher compensation by comparing the average changes in district spending on teacher compensation in the treatment group with the changes in the control group, controlling for various district and neighborhood characteristics that could also influence spending patterns. The results are shown in Figure D. Across all districts, we find that the collective bargaining restrictions that weakened teachers unions reduced average school district spending on total teacher compensation by about 6%, with teacher salary expenditures falling by about 5% and teacher benefit expenditures falling by 9.7%.
Restrictions on teachers unions in five states reduced spending on teacher compensation by 6%: Change in average school district spending on teacher salaries and benefits from 2009–2010 to 2015–2016 school years in states that restricted teachers unions in 2011–2012, relative to all other states, regression adjusted
| Change in expenditure | |
|---|---|
| Salaries | -5.0% |
| Benefits | -9.7% |
| Total compensation | -6.0% |
Notes: The five states are Idaho, Indiana, Michigan, Tennessee, and Wisconsin. Data are for elementary and secondary public school districts. Results are statistically significant at the 1% level (p < 0.01). All models include covariates for district characteristics, community characteristics, year dummies, and state dummies.
Source: Authors’ estimates using a data set linking Local Education Agency Finance Survey (F-33) microdata from the National Center for Education Statistics (NCES 2009–2010, 2015–2016) and the Stanford Education Data Archive for the same years.
Additionally, we conduct similar analyses measuring district spending on teacher compensation using other variables as outcomes, such as the ratio between teacher pay expenditure and total district expenditure (i.e., the share of total district expenditure devoted to teacher compensation) and average teacher compensation. The results based on these measures are similar to what we report here.
We also test whether the impacts on spending of the restrictions on teachers unions differ across low–, middle–, and high–socioeconomic status (SES) districts.9 We expect that the legal changes governing public-sector collective bargaining rights may have greater effects on spending on teacher compensation in the high-SES districts than in the low-SES districts, because the low-SES districts are more likely to operate with greater constraints, which leaves less room for a change in teacher compensation. For instance, studies find that teacher average salaries are lower in high-poverty schools than in low-poverty schools, and that it is difficult to attract high-quality young applicants to the teaching sector and retain them, especially in low-SES districts (García and Weiss 2019; Goldhaber, Lavery, and Theobald 2015; Ingersoll and Merrill 2017). This is all occurring in a profession that has been subject to a growing total compensation penalty over time, which reached 10.2% in 2019 (Allegretto and Mishel 2020).10 Thus, further reducing spending on teacher compensation in low-SES districts may not be well received by educators and policymakers.
Table 1 shows that school district spending on teacher salaries, benefits, and total compensation fell more sharply in the high-SES districts than in the low-SES districts (relative to how much such spending fell in similar districts in states with no change to the laws). The results for spending on teacher salaries are similar across districts with different SES status. This implies that teachers in the low-SES districts were not immune to the institutional changes, suggesting that their relative position in the salary distribution might have fallen further.11 However, as we expected, the cuts to spending on teacher benefits are much larger in the high-SES districts than the low-SES districts.
Effects of legal changes weakening teachers unions on school district spending on teacher compensation, by socioeconomic (SES) status of school district
| Teacher compensation variables | High-SES districts | Mid-SES districts | Low-SES districts |
|---|---|---|---|
| Log (teacher salary expenditure) | -0.0500*** | -0.0450*** | -0.0437*** |
| standard error | (0.0065) | (0.0042) | (0.0098) |
| Log (teacher benefits expenditure) | -0.154*** | -0.0910*** | -0.0225** |
| standard error | (0.0135) | (0.0067) | (0.0109) |
| Log (teacher total compensation) | -0.0867*** | -0.0529*** | -0.0439*** |
| standard error | (0.0105) | (0.0081) | (0.0118) |
| Observations | 18,750 | 37,620 | 19,090 |
Notes: Errors are clustered within districts (presented in parentheses). N is rounded to the nearest ten. ***p < 0.01, **p < 0.05, *p < 0.1. All models include covariates for district characteristics, community characteristics, year dummies, and state dummies.
Sources: Authors’ estimation based on a linked data set between the Local Education Agency (School Districts) Finance Survey and the Stanford Education Data Archive for 2009–2010 and 2015–2016 school years.
Conclusions
This analysis shows that the legislative measures restricting public-sector collective bargaining rights enacted in five states in 2011 and 2012 significantly reduced average districts’ spending on teacher compensation, including both teacher salaries and teacher benefits. The cuts in spending were sizable: In the years following the changes, average district spending on teacher compensation decreased by about 6%, with spending on teacher salaries falling by about 5% and spending on teacher benefits declining by 9.7% in the five states relative to the rest of the states in the sample. Further research would be needed to determine whether the decrease in teacher compensation grew larger over time in the absence of measures to counter the early effects.
These findings are a matter of concern for at least four reasons.
First, education policymakers and society in general should worry about the broader impact on the educational sector of changes in legal institutions governing collective bargaining for public-sector workers, given evidence that reduced education spending and lowered teacher compensation are associated with not only impaired teachers’ labor markets but also worsened student outcomes. Broadly understood, such legal changes could deteriorate the overall quality of public education and the educational systems in the states that experienced the legal changes.
Second, all teachers in the states that enacted measures explicitly targeting public-sector unions’ bargaining rights should be concerned about reduced spending on teacher compensation because such impacts affect all teachers, whether they are or are not union members. Typically, union dues or agency fees for union members are about 1–2% of a teacher’s salary, a cost which nonunion members could avoid under the new laws. But that savings is offset by salary losses: According to our estimates, legal changes weakening teachers unions reduce spending on teacher salaries by about 5%, and, equating teacher salaries to spending on teacher compensation, roughly speaking, this finding suggests that nonunion members would face a net loss of 3–4% of their salaries. This is not unexpected because, in general, the consequence of free-riding is the underprovision of public goods and services, which leads to loss in well-being of all members in the society.
Third, constituents in other states that have subsequently undergone equally drastic movements limiting public-sector workers’ collective bargaining rights should also be concerned about these findings, as it is likely that the effects can be extrapolated to them. For example, Kentucky passed an RTW law in 2017. In 2017, Iowa passed a law to significantly restrict the bargaining rights of teachers and other public employees. Then, in 2018, the Janus decision substantially diminished the financial capacity of public-sector unions by banning their collection of agency fees from nonmembers who are covered by the same union contracts, shifting the course of public-sector workers’ rights onto a different path (McNicholas 2018; Rosales 2018). Although the effects of these similar institutional changes for union and nonunion teachers in the states will need to be properly estimated, these continued movements that reduce the strength of teachers unions could have negative impacts on teachers’ labor markets and on student outcomes both locally and nationally.
Fourth, those concerned with the strength of the private-sector workforce should also be aware of the implications of this study. The legal changes affecting public-sector employees also could affect pay and working conditions of private-sector employees. The private-sector and public-sector labor markets are not mutually exclusive, so the legal environments for public-sector workers can influence the labor market in the private sector. The lower wages may push public school teachers to search for private-sector occupations, reducing wages in the private sector (union spillover effects in the opposite direction), and the weakened strength of public-sector unions may discourage private-sector workers from unionizing (the inverse of union threat effects).12 The existing evidence shows that in the wake of legal changes affecting teachers unions, a greater than normal share of teachers leave public schools through transfers across districts and by taking early retirement (Han 2020; Biasi 2018; Baron 2018; Roth 2019). Thus, changes in public-sector labor laws could have consequences for employment conditions of all workers.
Changes in legal institutions may arise in the pursuit of fundamental goals such as individual freedom, efficiency, equity, or others, but they often occur because they are ideological and politicized in nature. However, it is important to consider their ultimate repercussions. Our evidence suggests that legal changes affecting collective bargaining for teachers are more likely to be a hindrance to enhancing the educational system and improving the well-being of teachers, and they may impose costs down the road when further efforts are needed to fix their negative consequences to labor market and educational outcomes.
About the authors
Emma García is an education economist at the Economic Policy Institute, where she specializes in the economics of education and education policy. García’s research focuses on the production of education (cognitive and noncognitive skills), evaluation of educational interventions (early childhood, K–12, and higher education), equity, returns to education, teacher labor markets, and cost-effectiveness and cost–benefit analysis in education. She has held research positions at the Center for Benefit-Cost Studies of Education, the Campaign for Educational Equity, the National Center for the Study of Privatization in Education, and the Community College Research Center; she has consulted for MDRC, the World Bank, the Inter-American Development Bank, and the National Institute for Early Education Research; and she has served as an adjunct faculty member at the McCourt School of Public Policy, Georgetown University. García received her Ph.D. in economics and education from Columbia University Teachers College.
Eunice Han is an assistant professor in the Economics Department at the University of Utah. Han’s research interests include labor unions, economic inequality, intergenerational mobility, and public education. She is also a research associate with the Economic Policy Institute and a senior research associate at the Labor and Worklife Program at Harvard Law School. Han received her Ph.D. in economics from Harvard University.
Acknowledgments
The authors are grateful to EPI Publications Director Lora Engdahl for her edits. We also appreciate EPI Vice President John Schmitt’s comments on this report and on the full paper this report is based on. We acknowledge EPI Research Assistant Daniel Perez for his assistance with the tables and figures in this report and EPI’s communications staff for their work disseminating the report and their assistance with the media.
Appendix
To estimate the causal effects of the changes in collective bargaining on teacher compensation expenditures, we construct our data set by combining two data sources: the Local Education Agency (School Districts) Finance Survey (F-33), administered by NCES, and the Stanford Education Data Archive (SEDA) from 2009 to 2016.
The F-33 data include annual fiscal data for every U.S. school district providing public education to prekindergarten to grade 12 students, approximately 16,000 districts for each survey year. From these data we draw three main variables of districts’ expenditures during the school year: teacher salaries, teacher benefits, and teacher total compensation (salaries plus benefits).
The SEDA provides district-level information on schools and students for all public school districts in the country, along with descriptive information on the characteristics of families with school-age children residing in each district, derived from the American Community Survey.
We merge these two data sources to construct a national- and district-level panel data set, containing a great deal of information on districts and their surrounding neighborhoods between the 2009–2010 and 2015–2016 school years.
We examine the impact of the change in legal institutions weakening teachers unions by comparing average district spending on teacher compensation in the five states that experienced the legal changes (our treatment group) to district spending on teacher compensation in all other states (our control group). The method used, a difference-in-difference (DID) estimation, provides us with a causal estimate, computed by the difference between the average change in teacher compensation spending before and after the legal changes in 2011–2012 for districts in the treatment group and the average change in teacher compensation spending before and after 2011–2012 for districts in the control group.
To obtain more precise estimates, we control for various district and community characteristics. Our covariates for district characteristics include the following variables for grades three through eight: total enrollment, number of teachers, number of instructional aides, number of instructional coordinators/supervisors, number of elementary guidance counselors, share of students who are Hispanic students, share who are Black students, share who are Asian students, share who are Native American students, share who are eligible for reduced-price lunch, share who are eligible for free lunch, share who are English language learners, share who are special education students, and share who are public school students in charter schools. Covariates for community characteristics include median household income (in $), share of adults with a bachelor’s degree or higher level of educational attainment, share of households with children and headed by a female, share of households receiving Supplemental Nutrition Assistance Program (SNAP) benefits, share living in the same house that they lived in last year, share of adults who are unemployed, Gini coefficient, city/urban locale, suburban locale, and town locale.
In addition, we add state and year dummies to control for unobservable characteristics of each state and to allow for the effect of legal changes on teacher compensation to emerge over time, respectively (see full details in García and Han 2020).
Endnotes
1. Labor unions and employers negotiate collective bargaining agreements that cover wages, working conditions, and other features of the employment relationship. Where allowed by the laws covering public- or private-sector collective bargaining rights, unions typically have required nonmembers who are covered by a collective bargaining contract (because they are part of the collective bargaining unit) to pay “fair share fees.” These fees are usually a percentage of regular union dues that covers only the most basic costs of union representation. The fees support things like negotiating contracts governing wages and workplace conditions or representing workers in the case of disputes, which can be costly.
2. The NLRA is also known as the Wagner Act. Under the NLRA, for instance, most groups of private-sector employees can collectively bargain and strikes are legal.
3. The first state to provide collective bargaining rights for public employees was Wisconsin, in 1958. Federal workers were not given collective bargaining rights until President John F. Kennedy signed Executive Order 10988 in 1962.
4. State RTW laws reduce the financial strength of unions by making it illegal for a group of unionized workers to negotiate a collective bargaining contract that includes fair share fees for nonmembers covered by the contract.
5. Three states have passed RTW laws since 2016: West Virginia, Kentucky, and Missouri. The laws affected different groups of workers across the states. The law in Missouri was defeated in a 2018 referendum before it could take effect. These states are not included in this analysis because our study period covers 2009–2016.
6. The public leaders backing the laws argued that they were needed to curb the growing compensation costs associated with public-sector workers. However, some scholars and economists have raised questions about the link, noting that public-sector workers were not overpaid, that the states curbing collective bargaining were not the states with the biggest budget shortfalls, and that there were many ways to balance budgets that did not involve cutting education funding (Allegretto, Jacobs, and Lucia 2011; Lafer 2013).
7. This literature finds that teachers unions are associated with higher salaries (Han 2019; Merkle and Phillips 2018; Belman, Heywood, and Lund 1997; Freeman and Valletta 1988; Ehrenberg and Schwarz 1986; Lipsky 1982). Several studies have also found that teachers unions play an important role in raising teachers’ nonwage benefits (Eberts and Stone 1984; Delaney 1985; Podgursky 2003; Cowen and Strunk 2015). Unions also improve members’ working conditions (student-teacher ratio, required hours, etc.) and general well-being (teacher morale, etc.) (Hoxby 1996; Han 2019; Han and Keefe 2020). Moreover, unionized teachers are more involved and engaged in politics when becoming aware of how legislatures impact school finances; this finding comes from research examining what happens in school districts when they are required by states to engage in collective bargaining with their teachers unions and have a larger capacity for political organization (Flavin and Hartney 2015; Paglayan 2019).
8. In general, the efficiency wages theory argues that higher wages can raise productivity in occupations or jobs that face certain challenges, making it hard to measure productivity (Katz 1986; Krueger and Summers 1988; Stiglitz 1986; Weiss 1980; Weiss 2017). Some of these challenges, such as difficulty in measuring worker productivity and monitoring worker effort, etc., are applicable to teachers.
9. We measure districts’ SES status with a composite index based on the share of children in poverty, median household income, the share of adults with a bachelor’s degree or higher level of educational attainment, the share of households with children and a female head, the share of residents living in the same house as in the prior year, the share unemployed, and the Gini coefficient. For details on how to construct the composite index for socioeconomic status of districts, see Fahle et al. 2017.
10. The teacher compensation penalty is how much less, in percentage terms, teachers are compensated relative to other professionals with similar characteristics in nonteaching careers.
11. As said, on average, teacher salaries are lower in low-SES schools and districts than in high-SES schools and districts. If the effects had been worse in high-SES districts, we could have expected some relative improvement or catching up of salaries in low-SES districts. Given the fact that the effects are similar, we would expect no relative improvement of the low-SES districts.
12. Spillover effects occur when the higher wages in the unionized sector cause unemployment. If the unemployed workers spill over into the nonunion sector, it will lead to a surplus of employment and lower wages in the nonunion sectors. Threat effects exist when the wages in the nonunion sector increase as employers react to the possibility that their workplaces could unionize.
References
Allegretto, Sylvia A., Ken Jacobs, and Laurel Lucia. 2011. The Wrong Target: Public Sector Unions and State Budget Deficits. Institute for Research on Labor and Employment, University of California, Berkeley, October 2011.
Allegretto, S., and L. Mishel. 2020. Teacher Pay Penalty Dips but Persists in 2019: Public School Teachers Earn About 20% Less in Weekly Wages Than Nonteacher College Graduates. Economic Policy Institute and the Center on Wage and Employment Dynamics at the University of California, Berkeley, September 2020.
Baker, B. D. 2018. Educational Inequality and School Finance: Why Money Matters for America’s Students. Cambridge, Massachusetts: Harvard Education Press.
Baron, E. J. 2018. “The Effect of Teachers’ Unions on Student Achievement in the Short Run: Evidence from Wisconsin’s Act 10.” Economics of Education Review 67: 40–57.
Belman, D., Heywood, J. D., and Lund, J. 1997. “Public Sector Earnings and the Extent of Unionization.” Industrial and Labor Relations Review 50: 610–628.
Biasi, B. 2018. “The Labor Market for Teachers Under Different Pay Schemes.” National Bureau of Economic Research (NBER) Working Paper, 24813.
Britton, J., and Propper, C. 2016. “Teacher Pay and School Productivity: Exploiting Wage Regulation.” Journal of Public Economics 133: 75–89, http://dx.doi.org/10.1016/j.jpubeco.2015.12.004.
Cowen, J. M., and Strunk, K. O. 2015. “The Impact of Teachers’ Unions on Educational Outcomes: What We Know and What We Need to Learn.” Economics of Education Review 48: 208–223.
Delaney, J. T. 1985. “Unionism, Bargaining Spillovers, and Teacher Compensation.” In Advances in Industrial Relations 2, edited by D. B. Lipsky, 111–142. Greenwich, Conn.: JAI Press.
Eberts, R. W., and Stone, J. A. 1984. Unions and Public Schools: The Effect of CB on American Education. Lexington, Mass.: Lexington Books.
Ehrenberg, R. G., and Schwarz, J. L. 1986. “Public Sector Labor Markets.” In Handbook of Labor Economics 2, edited by O. C. Ashenfelter and R. Layard, 1219–1268. Amsterdam, Netherlands: North-Holland.
Fahle, E. M., Shear, B. R., Kalogrides, D., Reardon, S. F., Disalvo, R., and Ho, A. D. 2017. Stanford Education Data Archive—Technical Documentation. Version. 2.0. Stanford: Center for Education Policy Analysis, Stanford University.
Figlio, D. N. 1997. “Teacher Salaries and Teacher Quality.” Economic Letters 55, no. 2: 267–271, https://doi.org/10.1016/S0165-1765(97)00070-0.
Flavin, P., and Hartney, M. T. 2015. “When Government Subsidizes Its Own: CB Laws as Agents of Political Mobilization.” American Journal of Political Science 59: 896–911, https://doi.org/10.1111/ajps.12163.
Freeman, R., and Han, E. S. 2013. “Public Sector Unionism Without CB.” American Economic Association (AEA) Annual Meeting, San Diego. January 6, 2013. Second Draft. Cited in the Council of Economic Advisers Issue Brief, October 2015.
Freeman, R., Han, E., and Rogers, J. 2015. Brief for Amici Social Scientists as Amici Curiae Supporting Respondents, Friedrichs v. California Teachers Association. 578 U.S. (2016). Retrieved from https://www.scotusblog.com/wp-content/uploads/2015/11/14-915_amicus_resp_SocialScientists.authcheckdam.pdf.
Freeman, R. B., and Medoff, J. L. 1984. What Do Unions Do? New York: Basic Books.
Freeman, R. B., and Valletta, R. 1988. NBER Public Sector Collective Bargaining Law dataset. In R. Freeman and C. Ichniowski (eds.), When Public Sector Workers Unionize. Chicago: University of Chicago Press.
García, E., and Han, E. S. 2020. “The Effect of Changes in Legal Institutions Weakening Teachers’ Unions on District’s Spending on Teacher Compensation” (unpublished manuscript).
García, E., and Weiss, E. 2019. Low Relative Pay and High Incidence of Moonlighting Play a Role in the Teacher Shortage, Particularly in High-Poverty Schools: The Third Report in ‘The Perfect Storm in the Teacher Labor Market’ Series. Economic Policy Institute, May 2019.
Gibbons, S., McNally, S., and Viarengo, M. 2018. “Does Additional Spending Help Urban Schools? An Evaluation Using Boundary Discontinuities.” Journal of the European Economic Association 16, no. 5: 1618–1668.
Goldhaber, D., Lavery, L., and Theobald, R. 2015. “Uneven Playing Field? Assessing the Inequity of Teacher Characteristics and Measured Performance Across Students.” Educational Researcher 44, no. 5: 293–307.
Goldstein, D. 2014. The Teacher Wars: A History of America’s Most Embattled Profession. New York: Doubleday.
Gray, L., and Taie, S. 2015. Public School Teacher Attrition and Mobility in the First Five Years: Results from the First Through Fifth Waves of the 2007–08 Beginning Teacher Longitudinal Study: First Look. National Center for Education Statistics, U.S. Department of Education. Retrieved from: https://nces.ed.gov/pubs2015/2015337.pdf.
Grissom, J. A., Viano, S. L., and Selin, J. L. 2015. “Understanding Employee Turnover in the Public Sector: Insights from Research on Teacher Mobility.” Public Administration Review 76, no. 2: 241–251. https://doi.org/10.1111/puar.12435
Han, E. S. 2019. “The Impact of Teachers Unions on Teachers’ Well-Being Under Various Legal Institutions: Evidence from District–Teacher Matched Data.” AERA Open 5, no. 3 (August), https://doi.org/10.1177/2332858419867291.
Han, E. S. 2020. “The Myth of Unions’ Overprotection of Bad Teachers: Evidence from the District-Teacher Matched Panel Data on Teacher Turnover.” Industrial Relations, online publication, https://doi.org/10.1111/irel.12256.
Han, E. S., and Keefe, J. 2020. “Candidates for Free Riding in a Post Agency Shop Public Sector.” Advances in Industrial and Labor Relations, forthcoming.
Hanushek, E. A. 2020. “Education Production Functions.” In The Economics of Education, edited by S. Baradley and C. Green, 161–170. Academic Press.
Hanushek, E. A., Piopiunik, M., and Wiederhold, S. 2019. “Do Smarter Teachers Make Smarter Students?” Education Next, Spring 2019: 57–64. Retrieved from: https://www.educationnext.org/do-smarter-teachers-make-smarter-students-international-evidence-cognitive-skills-performance/.
Hendricks, M. D. 2014. “Does It Pay to Pay Teachers More? Evidence from Texas.” Journal of Public Economics 109: 50–63. https://doi.org/10.1016/j.jpubeco.2013.11.001.
Hirsch, B. T., Macpherson, D., and Winters, J. 2011. “Teacher Salaries, State Collective Bargaining Laws, and Union Coverage.” Paper presented at Association for Education Finance and Policy (AEFP) Meetings, Seattle.
Hoxby, C. M. 1996. “How Teachers’ Unions Affect Education Production.” Quarterly Journal of Economics 111, no. 3: 671–718. https://doi.org/10.2307/2946669.
Hyman, J. 2017. “Does Money Matter in the Long Run? Effects of School Spending on Educational Attainment.” American Economic Journal: Economic Policy 9, no. 4: 256–80. DOI: 10.1257/pol.20150249
Ingersoll, R., and Merrill, L. 2017. A Quarter Century of Changes in the Elementary and Secondary Teaching Force: From 1987 to 2012. Washington, D.C.: National Center for Education Statistics.
Ingersoll, R. 2001. “Teacher Turnover and Teacher Shortages: An Organizational Analysis.” American Educational Research Journal 38, no. 3: 499–534.
Jackson, K. C. 2018. “Does School Spending Matter: The New Literature on an Old Question.” NBER Working Paper No. 25368.
Jackson, K. C., Johnson, R. C., and Persico, C. 2016. “The Effects of School Spending on Educational and Economic Outcomes: Evidence from School Finance Reforms.” Quarterly Journal of Economics 131, no. 1: 157–218, https://doi.org/10.1093/qje/qjv036.
Jackson, K. C., Wigger, C., and Xiong, H. 2018. “Do School Spending Cuts Matter? Evidence from The Great Recession.” National Bureau of Economic Research (NBER) Working Paper No. 24203.
Janus v. American Federation of State, County, and Municipal Employees. 2018. No. 16-1466 Supreme Court of United States. June 27, 2018.
Jones, N. D., Bettini, E., and Brownell, M. T. 2016. Can Collaborative School Reform and Teacher Evaluation Reform Be Reconciled?, Albert Shanker Institute.
Katz, L. F. 1986. “Efficiency Wage Theories: A Partial Evaluation.” National Bureau of Economic Research (NBER) Working Paper No. 1906.
Katz, V. 2018. Teacher Retention: Evidence to Inform Policy. Charlottesville, Va.: University of Virginia. Retrieved from https://curry.virginia.edu/sites/default/files/uploads/epw/Teacher%20Retention%20Policy%20Brief.pdf.
Keefe, J. 2015. Eliminating Fair Share Fees and Making Public Employment “Right-to-Work” Would Increase the Pay Penalty for Working in State and Local Government. Economic Policy Institute. October 2015.
Krueger, A. B., and Summers, L. H. 1988. “Efficiency Wages and the Inter-Industry Wage Structure.” Econometrica 56, no 2: 259–293, https://doi.org/10.2307/1911072.
Lafer, G. 2013. The Legislative Attack on American Wages and Labor Standards, 2011–2012. Economic Policy Institute, October 2013.
Lafortune, J., Rothstein, J., and Whitmore-Schanzenbach, D. 2018. “School Finance Reform and the Distribution of Student Achievement.” American Economic Journal: Applied Economics 10, no. 2: 1–26. https://doi.org/10.1257/app.20160567.
Leigh, A. 2012. “Teacher Pay and Teacher Aptitude.” Economics of Education Review 1: 41–53. https://doi.org/10.1016/j.econedurev.2012.02.001.
Lipsky, D. B. 1982. “The Effect of Collective Bargaining on Teacher Pay: A Review of the Evidence.” Educational Administration Quarterly 18, no. 1: 14–42.
Loeb, S., Darling-Hammond, L., and Luczak, J. 2005. “How Teaching Conditions Predict Teacher Turnover in California Schools.” Peabody Journal of Education 80, no. 3: 44–70. https://doi.org/10.1207/s15327930pje8003_4.
Manski, C. F. 1987. “Academic Ability, Earnings, and the Decision to Become a Teacher: Evidence from the National Longitudinal Study of the High School Class of 1972.” In Public Sector Payrolls, edited by D. A. Wise, 291–316. Chicago: University of Chicago Press.
Marianno, B. D., and Strunk, K. O. 2018. “The Bad End of the Bargain?: Revisiting the Relationship Between Collective Bargaining Agreements and Student Achievement.” Economics of Education Review 65: 93–106. https://doi.org/10.1016/j.econedurev.2018.04.006.
McNicholas, C. 2018. “In 5–4 Decision, Supreme Court Undercuts Workers’ Freedom to Organize” (statement). Economic Policy Institute, June 27, 2018.
Merkle, J. S., and Phillips, M. A. 2018. “The Wage Impact of Teachers Unions: A Meta-Analysis.” Contemporary Econ Policy 36: 93–115. https://doi.org/10.1111/coep.12234.
Moe, Terry M. 2011. Special Interest. Washington D.C.: Brookings Institution Press.
Moore-Johnson, S., Donaldson, M. L., Munger, M. S., Papay, J. P., and Qazilbash, E. K. 2007. Leading the Local: Teacher Union Presidents Speak on Change, Challenges. Washington, D.C.: Education Sector.
Murnane, R. J., and Olsen, R. J. 1989. “The Effect of Salaries and Opportunity Costs on Duration in Teaching: Evidence from Michigan,” The Review of Economics and Statistics 71, no. 2: 347–352. https://doi.org/10.2307/1926983.
National Center for Education Statistics (NCES) (U.S. Department of Education). 2008–2009 to 2015–2016. Microdata from the Local Education Agency Finance Survey (F-33).
National Center for Education Statistics (NCES) (U.S. Department of Education). 2018. “Table 236.20. Total Expenditures for Public Elementary and Secondary Education and Other Related Programs, by Function and Subfunction: Selected Years, 1990–91 Through 2015–16.” https://nces.ed.gov/programs/digest/d18/tables/dt18_236.20.asp.
National Center for Education Statistics (NCES) (U.S. Department of Education). n.d. “Total Number of Public School Teachers and Percentage of Public School Teachers in a Union or Employees’ Association, by Selected School Characteristics: 2015–16.” National Teacher and Principal Survey (NTPS),
Paglayan, A. S. 2019. “Public‐Sector Unions and the Size of Government.” American Journal of Political Science 63: 21–36. https://doi.org/10.1111/ajps.12388.
Podgursky, M. J. 2003. “Fringe Benefits: There Is More to Compensation Than a Teacher’s Salary.” Education Next 3, 71–76.
Podolsky, A., Kini, T., Darling-Hammond, L., and Bishop, J. 2019. “Strategies for Attracting and Retaining Educators: What Does the Evidence Say?” Education Policy Analysis Archives 27, no. 38. http://dx.doi.org/10.14507/epaa.27.3722.
Reardon, S. F., Kalogrides, D., Ho, A., Shear, B., Shores, K., and Fahle, E. 2016. Stanford Education Data Archive. http://purl.stanford.edu/db586ns4974.
Ronfeldt, M., Loeb, S., and Wyckoff, J. 2013. “How Teacher Turnover Harms Student Achievement.” American Educational Research Journal 50, no. 1, 4–36. https://doi.org/10.3102/0002831212463813.
Rosales, J. 2018. “Supreme Court Ruling in ‘Janus’ Deals Blow to Working Families.” NEA Today, June 27, 2018. Retrieved from: http://neatoday.org/2018/06/27/supreme-court-janus-decision/.
Roth, J. 2019. “Union Reform and Teacher Turnover: Evidence from Wisconsin’s Act 10.” Retrieved from: https://scholar.harvard.edu/jroth/publications/union-reform-and-teacher-turnover-evidence-wisconsins-act-10. Working paper.
Sorensen, L. C., and Ladd, H. 2018. “The Hidden Costs of Teacher Turnover.” National Center for Analysis of Longitudinal Data in Education Research (CALDER) Working Paper no. 203-0918-1. Retrieved from: https://caldercenter.org/publications/hidden-costs-teacher-turnover.
Stiglitz, J. 1986. “Theories of Wage Rigidities.” In Keynes’ Economic Legacy: Contemporary Economic Theories, edited by J. Butkiewicz et al., 153–206. New York: Praeger Publishers.
Stockard, J., and Lehman, M. B. 2004. “Influences on the Satisfaction and Retention of 1st-year Teachers: The Importance of Effective School Management.” Educational Administration Quarterly 40, no. 5: 742–771. https://doi.org/10.1177/0013161X04268844.
Weiss, A. 1980. “Job Queues and Layoffs in Labor Markets with Flexible Wages.” Journal of Political Economy 88, no. 3: 526–538. https://doi.org/10.1086/260884.
Weiss, A. 2017. Efficiency Wages: Models of Unemployment, Layoffs, and Wage Dispersion. Princeton, N.J.: Princeton University Press.
West, K. L. 2015. “Teachers’ Unions, Compensation, and Tenure.” Industrial Relations: A Journal of Economy and Society 54: 294–320.
Winkler, A. M., Scull, J., and Zeehandelaar, D. 2012. How Strong Are U.S. Teacher Unions? A State-by-State Comparison. Thomas B. Fordham Institute. Retrieved from: https://fordhaminstitute.org/national/research/how-strong-are-us-teacher-unions-state-state-comparison.
Wolf, J., and Schmitt, J. 2018. A Profile of Union Workers in State and Local Government: Key Facts about the Sector for Followers of Janus v. AFSCME Council 31. Economic Policy Institute, June 2018.
Workman, E. 2011. “State Collective Bargaining Policies for Teachers.” Education Commission of the States. Retrieved from: https://www.ecs.org/clearinghouse/99/78/9978.pdf.