Full Report
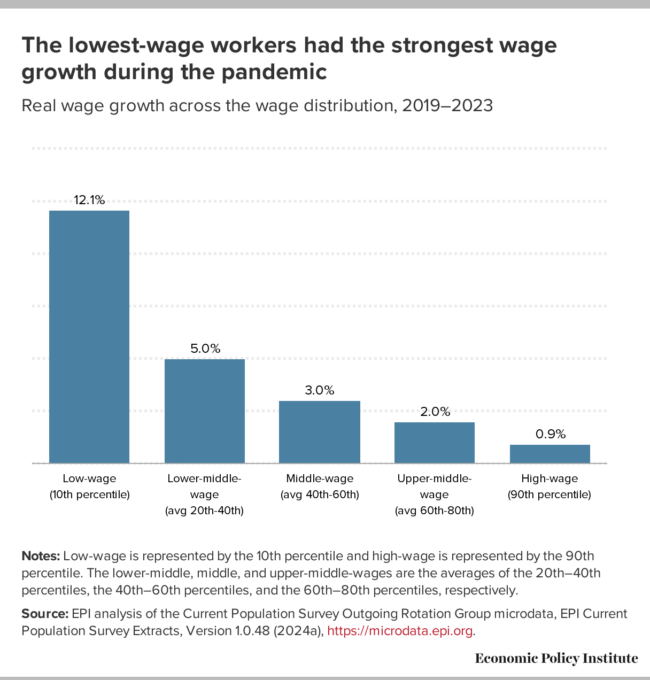
Correction notice: An earlier version of this report published in March contained computational errors. The most meaningful changes were that real wages of low-wage workers grew 13.2% between 2019 and 2023 (not 12.1%), while those of 90th-percentile workers grew by 4.4% (not 0.9%). A minor change was that the 10th-percentile hourly wage was $13.66 (not $13.52) in 2023, which amounts to $28,410 (not $28,120) in annual pay. An updated press release with the correct data is below, and the report has also been revised accordingly. The key finding remains true: Low-wage workers experienced the fastest wage growth of any group since 2019, and this surge occurred after decades of slow growth. We regret the error.
The current business cycle is a notable reversal of fortune for lower-wage workers in the U.S. labor market. Between 1979 and 2019, low- and middle-wage workers in the U.S. labor market experienced only a few short years of strong growth in real (inflation-adjusted) wages. But, between 2019 and 2023, workers in the bottom half of the wage distribution have seen historically fast wage growth, even in the face of high inflation.
Policy choices in the wake of the pandemic and the strong labor market have made these strong gains possible. Historically disadvantaged groups—such as women, Black and Hispanic workers, young workers, and workers with less than college degree—have experienced particularly strong wage growth in recent years. Of course, even recent strong growth has not totally closed these wage gaps, and the nation’s lowest-paid workers still receive wages that are inadequate to meet most families’ basic needs. Policymakers need to strengthen labor standards so that workers can lock in the gains made and continue to build on them, even in weaker labor markets.
Synopsis
Findings: Between 2019 and 2023, low-wage workers experienced historically fast real wage growth. The 10th percentile real hourly wage grew 13.2% over the four-year period. This tremendous real wage growth at the lower end of the wage distribution was exceptional, significantly faster than in any other business cycle peak since 1979. Faster wage growth at lower wage levels is a significant break from the forty years leading up to 2019. Over the last four years, middle-wage women, Black and Hispanic workers, young workers, workers with lower levels of education attainment, and parents experienced faster wage growth. Nevertheless, low-wage workers continue to suffer from grossly inadequate wages and middle-wage workers face significant gaps across demographic groups.
Implications: Policymakers responded to the pandemic recession with actions that made a real difference in people’s lives: Wages grew for those who needed it most. Thoughtful policymaking going forward can help ensure that low- and middle-wage workers continue to see improvements in their standard of living.
Recommendations: The recent gains in low-end wage growth may be short-lived if policymakers curtail the recovery. The most immediate threat to the continued recovery is if the Federal Reserve keeps rates higher than is needed to normalize inflation. Even a mild recession resulting from these actions will do significant harm to low-wage workers and their families. In addition, policymakers should:
-
- raise the federal minimum wage;
- make long-term investments in our unemployment insurance system;
- strengthen and enforce labor standards; and
- remove obstacles to workers forming unions.
Wage growth strongest for low-wage workers between 2019 and 2023
In this analysis, we divide the wage distribution into roughly five groups to uncover recent wage trends at different wage levels. Figure A displays wage growth at the 10th percentile (“low-wage”), the average of the 20th–40th percentiles (“lower-middle-wage”), the average of the 40th–60th percentiles (“middle-wage”), the average of the 60th–80th percentiles (“upper-middle-wage”), and the 90th percentile (“high-wage”) using Current Population Survey (CPS) Outgoing Rotation Group microdata (EPI 2024a). Gould and deCourcy (2023) provide a more detailed discussion of these data measures and their robustness. Note that the 90th percentile as “high-wage” does not capture the earnings of those at the very top, and is better captured with other data sets which are discussed briefly later on.
Our analysis focuses on changes in real wages between 2019 and 2023, as well as historical comparisons of real wage changes between 1979 and 2019. Our focus on 2019 and 2023 allows us to largely ignore the dramatic swings in employment and wages in 2020 and 2021, which were most impacted by the pandemic recession and initial recovery.1
Real wage growth at the 10th percentile was exceptionally strong—even in the face of high inflation
Between 2019 and 2023, hourly wage growth was strongest at the bottom of the wage distribution. The 10th-percentile real hourly wage grew 13.2% over the four-year period. To be clear, these are real (inflation-adjusted) wage changes. Overall inflation grew nearly 20%, or about 4.5% annually, between 2019 and 2023. Even with this historically fast inflation, particularly in the immediate aftermath of the pandemic recession, low-end wages grew substantially faster than price growth. Nominal wages (i.e., not inflation-adjusted) rose by roughly 34% cumulatively since 2019.
Across the wage distribution, we see the pace of wage growth declining for each successive wage group until the 90th percentile. Compared with the 13.2% wage growth at the bottom, growth was less than half as fast for lower-middle-wage workers (5.0%) and less than one-third as fast for middle-wage workers (3.0%) between 2019 and 2023. Upper-middle wages grew 2.0% over the four-year period, while the 90th-percentile wage grew 4.4%.
Figure AThe lowest-wage workers had the strongest wage growth during the pandemic: Real wage growth across the wage distribution, 2019–2023
Wage group
Wage change
Low-wage<br>(10th percentile)
13.2%
Lower-middle-wage<br>(avg 20th–40th)
5.0%
Middle-wage<br>(avg 40th–60th)
3.0%
Upper-middle-wage<br>(avg 60th–80th)
2.0%
High-wage<br>(90th percentile)
4.4%

Notes: Low-wage is represented by the 10th percentile and high-wage is represented by the 90th percentile. The lower-middle, middle, and upper-middle-wages are the averages of the 20th–40th percentiles, the 40th–60th percentiles, and the 60th–80th percentiles, respectively.
Source: EPI analysis of the Current Population Survey Outgoing Rotation Group microdata, EPI Current Population Survey Extracts, Version 1.0.48 (2024a), https://microdata.epi.org.
The lowest-wage workers had the strongest wage growth during the pandemic: Real wage growth across the wage distribution, 2019–2023
| Wage group | Wage change |
|---|---|
| Low-wage<br>(10th percentile) | 13.2% |
| Lower-middle-wage<br>(avg 20th–40th) | 5.0% |
| Middle-wage<br>(avg 40th–60th) | 3.0% |
| Upper-middle-wage<br>(avg 60th–80th) | 2.0% |
| High-wage<br>(90th percentile) | 4.4% |
Notes: Low-wage is represented by the 10th percentile and high-wage is represented by the 90th percentile. The lower-middle, middle, and upper-middle-wages are the averages of the 20th–40th percentiles, the 40th–60th percentiles, and the 60th–80th percentiles, respectively.
Source: EPI analysis of the Current Population Survey Outgoing Rotation Group microdata, EPI Current Population Survey Extracts, Version 1.0.48 (2024a), https://microdata.epi.org.
Wage compression in the most recent period contrasts sharply with prior 40 years
Because wages grew much faster at the 10th percentile than at the other four points we measure within the 20th to 90th percentiles, wage compression has occurred. These findings—disproportionately strong wage growth at the bottom leading to wage compression—are consistent with the other research (see, for instance, Autor, Dube, and McGrew 2023).
This wage compression between 2019 and 2023 is in stark contrast with the experience of workers in the prior four decades. Figure B displays wage growth between 2019 and 2023 compared to wage growth between 1979 and 2019 for the same five wage groupings: low-wage, lower-middle-wage, middle-wage, upper-middle-wage, and high-wage. This time we report annualized wage changes in wages—which allow for comparison across periods which span different numbers of years, e.g. a four-year span versus a forty-year span.2
The differences in wage growth between these periods are striking. Whereas in the most recent period wage growth was stronger among each successive lower wage group starting with upper-middle-wage workers on down, the opposite pattern occurs in the earlier forty-year period. Each successive higher wage group displays wage growth at least as fast as the previous one, except for between the lower-middle to the middle-wage group where there’s a small decrease. In the most recent period, middle-wage workers experience growth nearly two-thirds (63.6%) as fast as high wage workers, but in the 1979-2019 period their wage growth was one-third as fast. The difference is even more extreme for the lowest wage workers: close to zero growth over the forty-year period versus more than 3% annualized growth over the past four years. All wage groups experienced wage growth at least as fast in the most recent period as between 1979 and 2019, and much faster among roughly the bottom half of the wage distribution.
Figure BWage compression in the most recent period is in stark contrast to the forty-years prior: Annualized real wage growth across the distribution, 1979–2019 and 2019–2023
Wage group
Annualized wage change, 1979-2019
Annualized wage change, 2019-2023
Low-wage<br>(10th percentile)
0.1%
3.1%
Lower-middle-wage<br>(avg 20th–40th)
0.4%
1.2%
Middle-wage<br>(avg 40th–60th)
0.3%
0.7%
Upper-middle-wage<br>(avg 60th–80th)
0.5%
0.5%
High-wage<br>(90th percentile)
0.9%
1.1%
Notes: Low-wage is represented by the 10th percentile and high-wage is represented by the 90th percentile. The lower-middle, middle, and upper-middle-wages are the averages of the 20th–40th percentiles, the 40th–60th percentiles, and the 60th–80th percentiles, respectively.
Source: EPI analysis of the Current Population Survey Outgoing Rotation Group microdata, EPI Current Population Survey Extracts, Version 1.0.48 (2024a), https://microdata.epi.org.
Wage compression in the most recent period is in stark contrast to the forty-years prior: Annualized real wage growth across the distribution, 1979–2019 and 2019–2023
| Wage group | Annualized wage change, 1979-2019 | Annualized wage change, 2019-2023 |
|---|---|---|
| Low-wage<br>(10th percentile) | 0.1% | 3.1% |
| Lower-middle-wage<br>(avg 20th–40th) | 0.4% | 1.2% |
| Middle-wage<br>(avg 40th–60th) | 0.3% | 0.7% |
| Upper-middle-wage<br>(avg 60th–80th) | 0.5% | 0.5% |
| High-wage<br>(90th percentile) | 0.9% | 1.1% |
Notes: Low-wage is represented by the 10th percentile and high-wage is represented by the 90th percentile. The lower-middle, middle, and upper-middle-wages are the averages of the 20th–40th percentiles, the 40th–60th percentiles, and the 60th–80th percentiles, respectively.
Source: EPI analysis of the Current Population Survey Outgoing Rotation Group microdata, EPI Current Population Survey Extracts, Version 1.0.48 (2024a), https://microdata.epi.org.
The very top continues to amass larger shares of the overall pie
Changes at the very top of the wage distribution cannot be measured using the CPS, but Social Security Administration (SSA) data reveal what’s happening within the top 10%, 5%, 1%, and even 0.1% of the annual earnings distribution. Between 1979 and 2019, the bottom 90% grew 0.6% on an annualized basis, while the top 5% grew 2.0% and the top 0.1% grew 3.8% (Gould and Kandra 2023). There are vast differences not only between the top and the vast majority, but also within the top of the earnings distribution.
The latest SSA data only extends to 2022. The 2019–2022 period is characterized by relatively even growth, primarily because stock market declines in 2022 drove losses among the highest earners. After dropping significantly in 2022, the stock market rebounded greatly in 2023 (Trackinsight 2024). Therefore, very top earnings are likely to show a solid rebound in 2023, continuing the concentration of wages at the high end.
The bounceback low-wage workers experienced was stronger than in any business cycle since 1979—and smart policy was a key factor
Figure C shows just how exceptional this recovery has been in achieving strong wage growth for low-wage workers. The figure presents the real changes in the 10th-percentile wage and the middle wage four years from the prior peak in each business cycle since 1979. Wage growth at the 10th percentile in the current business cycle is more than twice as fast as the next closest period over the last 40 years.
Middle-wage workers—workers between the 40th and 60th percentiles of the wage distribution—experienced slower gains in the recent business cycle compared to low-wage workers. However, the slower middle-wage growth over the last four years was significantly faster than that found in the four prior business cycles.
Figure CLow-wage workers have experienced stronger-than-usual wage growth in the pandemic business cycle: Real wage changes at the 10th percentile and average of 40–60th, four years from prior peak, in current and last four business cycles, 1979–2023
Business cycle
10th percentile
Middle-wage<br>(avg 40th–60th)
1979–1983
-13.7%
-3.5%
1989–1993
5.7%
-1.0%
2001–2005
-1.7%
0.2%
2007–2011
0.1%
-0.9%
2019–2023
13.2%
3.0%
Note: Because there was a double dip recession in the early 1980's, we tested the robustness of our results using different business cycles dates and find that our initial results still hold.
Source: EPI analysis of the Current Population Survey Outgoing Rotation Group microdata, EPI Current Population Survey Extracts, Version 1.0.48 (2024a), https://microdata.epi.org.
Low-wage workers have experienced stronger-than-usual wage growth in the pandemic business cycle: Real wage changes at the 10th percentile and average of 40–60th, four years from prior peak, in current and last four business cycles, 1979–2023
| Business cycle | 10th percentile | Middle-wage<br>(avg 40th–60th) |
|---|---|---|
| 1979–1983 | -13.7% | -3.5% |
| 1989–1993 | 5.7% | -1.0% |
| 2001–2005 | -1.7% | 0.2% |
| 2007–2011 | 0.1% | -0.9% |
| 2019–2023 | 13.2% | 3.0% |
Note: Because there was a double dip recession in the early 1980's, we tested the robustness of our results using different business cycles dates and find that our initial results still hold.
Source: EPI analysis of the Current Population Survey Outgoing Rotation Group microdata, EPI Current Population Survey Extracts, Version 1.0.48 (2024a), https://microdata.epi.org.
Faster growth for low-wage workers was driven by policy decisions and a tight labor market
The fast growth over the last four years, particularly for low-wage workers, didn’t happen by luck: It was largely the result of intentional policy decisions that addressed the pandemic and subsequent recession at the scale of the problem. Policymakers learned from the aftermath of the Great Recession, in which the pursuit of austerity led to a slow and prolonged economic recovery.
Several large spending bills were passed in the first year of the pandemic, which provided enhanced and expanded unemployment insurance, economic impact payments, aid to states and localities, child tax credits, and temporary protection from eviction, among other measures (Gould and Shierholz 2022). These actions provided relief to workers and their families to help them weather the recession. These measures also fed the surge in employment, which gave low-wage workers better job opportunities and leverage to see strong wage growth.
Unemployment fell to 3.6% in 2022 and held steady in 2023 as both the labor force and employment grew. The share of the population ages 25-54 with a job—the prime-working-age employment to population ratio (EPOP)—rose to 80.7% in 2023, surpassing even the pre-pandemic high of 80.0% in 2019. In fact, we have to go back to 2000 to find a prime-working-age EPOP that exceeds the level reached in 2023.
This tightening labor market further bolstered workers’ leverage. Low unemployment means that workers are relatively scarce, which requires employers to work harder to attract and retain workers and lessens their discretion to discriminate without facing a profitability penalty. In low-unemployment labor markets, lower-wage and historically marginalized workers experience better labor market outcomes and faster wage growth (Bivens and Zipperer 2018; Wilson and Darity 2022).
In addition, the sudden loss of millions of low-wage jobs at the start of the pandemic, followed by the extraordinarily fast employment recovery, meant that the frictions that tie workers to particular jobs—that is, the barriers that would normally keep workers from searching for better employment opportunities—were not constraining workers looking for work in this period. This “severed monopsony” in a time of furious re-hiring reduced the normal drag on wage growth imposed by these frictions (Bivens 2023). High numbers of low-wage workers quit and found better jobs, increasing churn in the low-wage labor market. This phenomenon increased low-wage workers’ leverage, which further contributed to faster wage growth. Employers simply had to work harder to attract and retain the workers they wanted.
Higher minimum wages can lock in the gains made by low-wage workers
The minimum wage is a crucial labor standard that serves as a valuable wage floor; bolsters the bargaining power of low-wage workers; and narrows wage gaps between workers by gender, race, and ethnicity. Strong labor standards—such as the minimum wage—work hand-in-hand with tight labor markets to provide faster wage growth for lower-wage workers. Higher minimum wages lock in the gains made in tight labor markets and bolster low wages in downturns as well as in expansionary periods.
While the federal minimum wage has been stuck at $7.25 an hour since 2009, over half of states have increased their minimum wage since then (EPI 2024c). We can see if there is a relationship between these state-level minimum wage increases and low-end wage growth by comparing differences in wage growth between states with and without changes to their minimum wage.
In past years, state minimum wage increases have done more to bolster wages at the bottom
Between 2016 and 2017, 10th-percentile wage growth was twice as fast in states with minimum wage increases as in states without (Gould 2017); wage growth was 2.5 times as fast for a woman at the 10th percentile in states that raised their minimum wage compared with a 10th-percentile woman in states that didn’t. This growth at the bottom helped to narrow the gender wage gap between 10th percentile workers.
Over the entire period from 2013 to 2019 leading up to the peak before the pandemic recession, low-end wage growth was 17.6% in states that increased their minimum wage at least once over that period, compared with 9.3% in states that didn’t (Gould 2020). The differential in wage growth isn’t as large when we look at just the period from 2017 to 2019; that’s because the labor market was tightening over those two years. When the unemployment rate is low, the minimum wage is less likely to bind—that is, employers already have to pay higher wages to attract and retain workers, so fewer workers are directly affected by minimum wage increases.
In the pandemic recovery, a tight labor market and state minimum wage increases were important for the tremendous low-end wage growth
We turn now to the current period. Twenty-nine states and the District of Columbia raised their minimum wages between 2019 and 2023, either through legislation, referendum, or indexing. To analyze the relationship between these state-level increases and wage growth at the bottom, we group all 50 states (plus D.C.) into two categories, as shown in Figure D: states with and without a minimum wage increase over the entire period.
Figure DThe minimum wage increased in 29 states and the District of Columbia between 2019 and 2023: States minimum wage increases, 2019–2023
State
Increase
Percent change key
Alabama
No increase
0
Alaska
Minimum wage increase
1
Arizona
Minimum wage increase
1
Arkansas
Minimum wage increase
1
California
Minimum wage increase
1
Colorado
Minimum wage increase
1
Connecticut
Minimum wage increase
1
Delaware
Minimum wage increase
1
Washington D.C.
Minimum wage increase
1
Florida
Minimum wage increase
1
Georgia
No increase
0
Hawaii
Minimum wage increase
1
Idaho
No increase
0
Illinois
Minimum wage increase
1
Indiana
No increase
0
Iowa
No increase
0
Kansas
No increase
0
Kentucky
No increase
0
Louisiana
No increase
0
Maine
Minimum wage increase
1
Maryland
Minimum wage increase
1
Massachusetts
Minimum wage increase
1
Michigan
Minimum wage increase
1
Minnesota
Minimum wage increase
1
Mississippi
No increase
0
Missouri
Minimum wage increase
1
Montana
Minimum wage increase
1
Nebraska
Minimum wage increase
1
Nevada
Minimum wage increase
1
New Hampshire
No increase
0
New Jersey
Minimum wage increase
1
New Mexico
Minimum wage increase
1
New York
Minimum wage increase
1
North Carolina
No increase
0
North Dakota
No increase
0
Ohio
Minimum wage increase
1
Oklahoma
No increase
0
Oregon
Minimum wage increase
1
Pennsylvania
No increase
0
Rhode Island
Minimum wage increase
1
South Carolina
No increase
0
South Dakota
Minimum wage increase
1
Tennessee
No increase
0
Texas
No increase
0
Utah
No increase
0
Vermont
Minimum wage increase
1
Virginia
Minimum wage increase
1
Washington
Minimum wage increase
1
West Virginia
No increase
0
Wisconsin
No increase
0
Wyoming
No increase
0
Note: These minimum wage categories are based on changes in the nominal value of the minimum wage, not adjusted for inflation. In states with no changes, their minimum wage fell in real terms.
Source: EPI analysis of state minimum wage laws. See EPI’s minimum wage tracker for the most current state-level minimum wage information.
The minimum wage increased in 29 states and the District of Columbia between 2019 and 2023: States minimum wage increases, 2019–2023
| State | Increase | Percent change key |
|---|---|---|
| Alabama | No increase | 0 |
| Alaska | Minimum wage increase | 1 |
| Arizona | Minimum wage increase | 1 |
| Arkansas | Minimum wage increase | 1 |
| California | Minimum wage increase | 1 |
| Colorado | Minimum wage increase | 1 |
| Connecticut | Minimum wage increase | 1 |
| Delaware | Minimum wage increase | 1 |
| Washington D.C. | Minimum wage increase | 1 |
| Florida | Minimum wage increase | 1 |
| Georgia | No increase | 0 |
| Hawaii | Minimum wage increase | 1 |
| Idaho | No increase | 0 |
| Illinois | Minimum wage increase | 1 |
| Indiana | No increase | 0 |
| Iowa | No increase | 0 |
| Kansas | No increase | 0 |
| Kentucky | No increase | 0 |
| Louisiana | No increase | 0 |
| Maine | Minimum wage increase | 1 |
| Maryland | Minimum wage increase | 1 |
| Massachusetts | Minimum wage increase | 1 |
| Michigan | Minimum wage increase | 1 |
| Minnesota | Minimum wage increase | 1 |
| Mississippi | No increase | 0 |
| Missouri | Minimum wage increase | 1 |
| Montana | Minimum wage increase | 1 |
| Nebraska | Minimum wage increase | 1 |
| Nevada | Minimum wage increase | 1 |
| New Hampshire | No increase | 0 |
| New Jersey | Minimum wage increase | 1 |
| New Mexico | Minimum wage increase | 1 |
| New York | Minimum wage increase | 1 |
| North Carolina | No increase | 0 |
| North Dakota | No increase | 0 |
| Ohio | Minimum wage increase | 1 |
| Oklahoma | No increase | 0 |
| Oregon | Minimum wage increase | 1 |
| Pennsylvania | No increase | 0 |
| Rhode Island | Minimum wage increase | 1 |
| South Carolina | No increase | 0 |
| South Dakota | Minimum wage increase | 1 |
| Tennessee | No increase | 0 |
| Texas | No increase | 0 |
| Utah | No increase | 0 |
| Vermont | Minimum wage increase | 1 |
| Virginia | Minimum wage increase | 1 |
| Washington | Minimum wage increase | 1 |
| West Virginia | No increase | 0 |
| Wisconsin | No increase | 0 |
| Wyoming | No increase | 0 |
Note: These minimum wage categories are based on changes in the nominal value of the minimum wage, not adjusted for inflation. In states with no changes, their minimum wage fell in real terms.
Source: EPI analysis of state minimum wage laws. See EPI’s minimum wage tracker for the most current state-level minimum wage information.
All states with a higher minimum wage than the federal minimum of $7.25 experienced an increase in their minimum wage in the last four years.3 The average nominal increase in the minimum wage between 2019 and 2023 among states with any increase was 28.6%. To be clear, this is a nominal increase, not a real increase. Again, inflation grew just under 20% over this period. Still, these minimum wage increases are, on average, about 6.5% annualized over the four-year period.
In Figure E, we compare real wage increases at the 10th percentile across these two sets of states. The key result is clear: Low-wage workers experienced fast wage growth in all states, regardless of changes to their minimum wage.4 Even in states without an increase to their minimum wage, low-wage workers experienced a 7.3% wage increase between 2019 and 2023. Also, low-end wages grew about 50% faster in states with minimum wage changes compared to states without any change in their minimum wage, 11.0% versus 7.3%.5
Figure EWage growth was strong at the bottom regardless of minimum wage changes: Real wage growth at the 10th percentile among states grouped by presence of minimum wage increase, 2019–2023
Presence of change
10th percentile
No minimum wage change
7.3%
Any minimum wage change
11.0%
Notes: Figure D details the list of states in each category. See EPI’s minimum wage tracker for the most current state-level minimum wage information. We exclude workers whose wages were allocated or imputed. The wage allocation model does not include state (Census 2021). This can mute or flatten differences in wages between states.
Source: EPI analysis of the Current Population Survey Outgoing Rotation Group microdata, EPI Current Population Survey Extracts, Version 1.0.48 (2024a), https://microdata.epi.org, and EPI analysis of state minimum wage laws.
Wage growth was strong at the bottom regardless of minimum wage changes: Real wage growth at the 10th percentile among states grouped by presence of minimum wage increase, 2019–2023
| Presence of change | 10th percentile |
|---|---|
| No minimum wage change | 7.3% |
| Any minimum wage change | 11.0% |
Notes: Figure D details the list of states in each category. See EPI’s minimum wage tracker for the most current state-level minimum wage information. We exclude workers whose wages were allocated or imputed. The wage allocation model does not include state (Census 2021). This can mute or flatten differences in wages between states.
Source: EPI analysis of the Current Population Survey Outgoing Rotation Group microdata, EPI Current Population Survey Extracts, Version 1.0.48 (2024a), https://microdata.epi.org, and EPI analysis of state minimum wage laws.
It is the case that a tightening labor market on its own leads to stronger wage growth among lower-wage workers (Bivens and Zipperer 2018). Further, as discussed above, enhanced relief measures and reduced frictions boosted low-wage workers’ leverage, thereby increasing the 10th-percentile wage across all states regardless of changes in state minimum wages. It is also the case that low-wage workers in states with minimum wage increases saw significantly faster growth than low-wage workers in states without minimum wage increases.
Minimum wage increases are crucial to lock in low-wage workers’ gains and build on them
We need to lock in the real wage gains that occurred for low-wage workers over the last four years. Increasing the federal minimum wage is the best way to do that. Unfortunately, Congress has failed to increase the federal minimum wage in the last 14 years, and it is now at its lowest value in real terms in 67 years (Cooper, Hickey, and Zipperer 2022).6
In response to sustained inaction at the federal level, many states and localities have continued to increase their minimum wages, as 22 states did on January 1, 2024 (Hickey 2023). Nearly 10 million workers benefited from those increases in their state’s minimum wage (Hickey 2023). Among those affected, 19.7% are in families with incomes below the poverty line, while nearly half (47.4%) have incomes below twice the poverty line (Hickey 2023).
The tight labor market along with legislative measures earlier in the pandemic recovery provided vital gains to low-wage workers. However, these workers need the support of strong labor standards, including a higher minimum wage, to keep from falling behind when the labor market weakens.
Despite historic wage growth, low-wage workers continue to suffer from grossly inadequate wages
Despite the meaningful impact of minimum wage hikes at the state and local levels, wage rates remain insufficient for individuals and families working to make ends meet across the United States. Federal policy action is needed.
In 2023, the 10th-percentile wage was $13.66. While this was a 13.2% increase from 2019, it is still far from sufficient to make ends meet: Even if that 10th-percentile worker worked full time, their annual pay would be only $28,410. In states that saw increases in the minimum wage between 2019 and 2023, the average 10th-percentile wage was $14.59 in 2023, almost 20% more than in states that saw no minimum wage increase ($12.19).7
Even with 13.2% wage growth since 2019, it is still difficult—if not impossible—for a 10th-percentile worker to make ends meet. According to EPI’s Family Budget Calculator, whether a worker is making $12.19 an hour or $14.59 an hour, they are still not earning enough to attain a modest yet adequate standard of living—a basic family budget for a single individual with no children—in any county or metro area in the United States (EPI 2024b). In fact, any wage rate below $15 an hour is insufficient to meet a one-person basic family budget in any county or metro area in the United States (Gould, Mokhiber, and DeCourcy 2024).
Wage compression meant faster growth for historically marginalized workers
Women and Black and Hispanic workers remain disproportionately represented in the low-wage labor market relative to their shares within the overall workforce due to long-standing patterns of discrimination and occupational segregation (Bahn and Cumming 2020; Wilson and Darity 2022). Young workers and workers with lower levels of education attainment also face higher unemployment and lower wages than their more experienced or more educated counterparts. Further, parents—particularly mothers—face barriers to maintaining work and decent wages and working conditions, particularly in the face of the pandemic (Aaronson, Hu, and Rajan 2021; Landivar and deWolf 2022).
Table 1 provides wage levels at the middle of the wage distribution—average of the 40th-60th deciles—for select demographic groups in 1979, 2019, and 2023. This allows us to look at how wages within groups have changed in the last four years compared to the prior forty. At the bottom of the chart, we compare wage levels between groups to measure changes in wage gaps for middle wage workers across demographic groups.
Faster wage growth for Black men, young workers, and mothers
Historically disadvantaged demographic groups experienced far faster wage growth over the last four years compared to the prior forty. Both men and women experienced faster growth than in prior years, though women notably experienced significant increases between 1979 and 2019 as their opportunities in the labor market expanded. Middle-wage Black workers saw the biggest boost in wage growth, particularly Black men. After not at all increasing between 1979 and 2019, Black men’s wages increased at an annualized rate of 1.5%, twice the overall rate, between 2019 and 2023.
Table 1Wages and wage gaps for select demographic groups, 1979, 2019, and 2023 ($2023)
Annualized percent change
Middle wage (avg. 40th-60th)
1979
2019
2023
1979-2019
2019-2023
All
$20.41
$23.27
$23.96
0.3%
0.7%
Men
$25.39
$25.40
$25.92
0.0%
0.5%
Women
$16.02
$21.28
$22.05
0.7%
0.9%
White
$21.10
$25.71
$26.25
0.5%
0.5%
Black
$17.47
$19.54
$20.66
0.3%
1.4%
Hispanic
$17.17
$19.04
$19.76
0.3%
0.9%
AAPI
$29.13
$30.42
1.1%
Race/ethnicity and gender
White Women
16.25
23.04
23.79
0.9%
0.8%
White Men
26.44
28.49
28.64
0.2%
0.1%
Black Women
15.09
18.98
19.99
0.6%
1.3%
Black Men
20.33
20.18
21.43
0.0%
1.5%
Hispanic Women
14.19
17.60
18.49
0.5%
1.2%
Hispanic Men
19.61
20.19
20.94
0.1%
0.9%
AAPI Women
25.84
27.07
1.2%
AAPI Men
32.93
34.04
0.8%
Age
Young workers, 16-24
14.31
14.64
15.90
0.1%
2.1%
Workers, 25+
23.09
25.38
26.12
0.2%
0.7%
Education
Less than a Bachelor’s
18.79
19.01
19.49
0.0%
0.6%
Bachelor’s degree+
29.11
35.77
35.92
0.5%
0.1%
Parents
Parents (child under 18)
26.03
27.36
1.3%
Mothers (child under 18)
22.56
24.09
1.7%
Annualized percentage point change
Wage gaps
1979
2019
2023
1979-2019
2019-2023
Race/ethnicity
Black-white
20.8%
31.6%
27.1%
0.3
-1.1
Hispanic-white
22.9%
35.0%
32.9%
0.3
-0.5
Gender
Gender wage gap
58.5%
19.4%
17.5%
-1.0
-0.5
Race/ethnicity and gender
Black and white men
30.1%
41.2%
33.6%
0.3
-1.9
Hispanic and white men
34.8%
41.1%
36.8%
0.2
-1.1
Black women-white men
75.2%
50.1%
43.3%
-0.6
-1.7
Hispanic women-white men
86.3%
61.9%
54.9%
-0.6
-1.7
Education
BA and non-college
54.9%
88.2%
84.3%
0.8
-1.0
Note: AAPI refers to Asian American and Pacific Islander. Race/ethnicity categories are mutually exclusive (i.e., white non-Hispanic, Black non-Hispanic, AAPI non-Hispanic, and Hispanic any race).
Source: EPI analysis of the Current Population Survey Outgoing Rotation Group microdata, EPI Current Population Survey Extracts, Version 1.0.48 (2024a), https://microdata.epi.org.
Wages and wage gaps for select demographic groups, 1979, 2019, and 2023 ($2023)
| Annualized percent change | |||||
|---|---|---|---|---|---|
| Middle wage (avg. 40th-60th) | 1979 | 2019 | 2023 | 1979-2019 | 2019-2023 |
| All | $20.41 | $23.27 | $23.96 | 0.3% | 0.7% |
| Men | $25.39 | $25.40 | $25.92 | 0.0% | 0.5% |
| Women | $16.02 | $21.28 | $22.05 | 0.7% | 0.9% |
| White | $21.10 | $25.71 | $26.25 | 0.5% | 0.5% |
| Black | $17.47 | $19.54 | $20.66 | 0.3% | 1.4% |
| Hispanic | $17.17 | $19.04 | $19.76 | 0.3% | 0.9% |
| AAPI | $29.13 | $30.42 | 1.1% | ||
| Race/ethnicity and gender | |||||
| White Women | 16.25 | 23.04 | 23.79 | 0.9% | 0.8% |
| White Men | 26.44 | 28.49 | 28.64 | 0.2% | 0.1% |
| Black Women | 15.09 | 18.98 | 19.99 | 0.6% | 1.3% |
| Black Men | 20.33 | 20.18 | 21.43 | 0.0% | 1.5% |
| Hispanic Women | 14.19 | 17.60 | 18.49 | 0.5% | 1.2% |
| Hispanic Men | 19.61 | 20.19 | 20.94 | 0.1% | 0.9% |
| AAPI Women | 25.84 | 27.07 | 1.2% | ||
| AAPI Men | 32.93 | 34.04 | 0.8% | ||
| Age | |||||
| Young workers, 16-24 | 14.31 | 14.64 | 15.90 | 0.1% | 2.1% |
| Workers, 25+ | 23.09 | 25.38 | 26.12 | 0.2% | 0.7% |
| Education | |||||
| Less than a Bachelor’s | 18.79 | 19.01 | 19.49 | 0.0% | 0.6% |
| Bachelor’s degree+ | 29.11 | 35.77 | 35.92 | 0.5% | 0.1% |
| Parents | |||||
| Parents (child under 18) | 26.03 | 27.36 | 1.3% | ||
| Mothers (child under 18) | 22.56 | 24.09 | 1.7% | ||
| Annualized percentage point change | |||||
| Wage gaps | 1979 | 2019 | 2023 | 1979-2019 | 2019-2023 |
| Race/ethnicity | |||||
| Black-white | 20.8% | 31.6% | 27.1% | 0.3 | -1.1 |
| Hispanic-white | 22.9% | 35.0% | 32.9% | 0.3 | -0.5 |
| Gender | |||||
| Gender wage gap | 58.5% | 19.4% | 17.5% | -1.0 | -0.5 |
| Race/ethnicity and gender | |||||
| Black and white men | 30.1% | 41.2% | 33.6% | 0.3 | -1.9 |
| Hispanic and white men | 34.8% | 41.1% | 36.8% | 0.2 | -1.1 |
| Black women-white men | 75.2% | 50.1% | 43.3% | -0.6 | -1.7 |
| Hispanic women-white men | 86.3% | 61.9% | 54.9% | -0.6 | -1.7 |
| Education | |||||
| BA and non-college | 54.9% | 88.2% | 84.3% | 0.8 | -1.0 |
Note: AAPI refers to Asian American and Pacific Islander. Race/ethnicity categories are mutually exclusive (i.e., white non-Hispanic, Black non-Hispanic, AAPI non-Hispanic, and Hispanic any race).
Source: EPI analysis of the Current Population Survey Outgoing Rotation Group microdata, EPI Current Population Survey Extracts, Version 1.0.48 (2024a), https://microdata.epi.org.
Middle wages for young workers—disproportionately found at the lower end of the wage distribution—experienced tremendous growth between 2019 and 2023. After growing 0.1% annualized between 1979 and 2019, their wages grew a whopping 2.1% annualized between 2019 and 2023. Similarly, workers with lower levels of educational attainment—specifically those with less than a four-year bachelor’s degree—saw zero wage growth between 1979 and 2019, then experienced a striking 0.6% growth in wages over the last four years.
Parents—particularly mothers—also experienced strong wage growth between 2019 and 2023. Women with a child under 18 years old saw 1.7% annualized wage growth between 2019 and 2023.
Key wage gaps narrowed but remain large
The wage gaps at the bottom of the chart are simple comparisons of wage levels between each of the demographic groups listed. After worsening between 1979 and 2019, both the Black-white and Hispanic-white wage gaps narrowed between 2019 and 2023. The gender wage gap narrowed at a fast pace between 1979 and 2019 because of educational upgrading and expanding labor market opportunities for women; it did continue to narrow between 2019 and 2023, albeit at a slower pace.
After widening between 1979 and 2019, the wage gap between Black and white men narrowed sharply between 2019 and 2023, making a significantly dent in the gap between those groups. There were similar gains for Hispanic men vis-à-vis white men. Black and Hispanic women experienced equal narrowing in both periods, though they saw much faster narrowing in the last four years compared to the prior forty.
As with the gains in wages for workers without a college degree, it’s not surprising that the education wage gap also narrowed. After widening between 1979 and 2019, the narrowing over the last four years indicates promising opportunities for these less credentialed workers.
Policy matters
The recent gains in low-end wage growth may be short-lived if policymakers curtail the recovery. The most immediate threat to the continued recovery is if the Federal Reserve keeps rates higher than is needed to normalize inflation. This policy failure could not only constrain the full recovery but also cause a recession. Even a mild recession would be highly regressive, hitting the most vulnerable and historically disadvantaged groups the hardest. If policy mistakes or unforeseen shocks do lead to a downturn, only congressional policymakers have the tools to shelter those harmed. This is worrying given the current state of U.S. politics.
While great strides were made during the pandemic recession and in its immediate aftermath with vital relief and recovery measures, divided partisan control of the House and Senate means that there is not any easy path to countercyclical measures being legislated if a recession hits again soon. It seems the lessons from the pandemic recession have been all but forgotten. Necessary long-term investments in our unemployment insurance system have not been made and many of the relief measures that increased economic security during the pandemic, such as the child tax credits, have long since lapsed.
Policymakers can and should ensure that low-wage workers lock in the gains made over the past four years and continue to increase their ability to make ends meet. We also need policy measures to boost wages for middle-wage workers, such as making it easier for workers to collectively bargain and bolstering public-sector employment.
In short, we need robust wage growth and worker power at the center of economic policymaking. To stem inequality and see healthy wage growth for the vast majority of workers, we need to use all the tools in our toolbox to reverse these policy trends—including prioritizing full employment, strengthening and enforcing labor standards, and removing obstacles to workers forming unions. This policy agenda would provide more broadly shared prosperity so that low- and middle-wage workers alike have opportunities to improve their standard of living.
Notes
1. In 2020, the bottom dropped out of the labor market as low-wage and low-hours workers lost their jobs in disproportionate numbers (Gould and Kandra 2021; Gould and Kassa 2021). As the recovery took hold in 2021, swings in the composition of the workforce by gender, race/ethnicity, education, work hours, industry, and occupation made it necessary to account for these differences in measuring wage changes in the pandemic labor market (Gould and Kandra 2022). By 2022, the dramatic compositional shifts in the pandemic labor market had mostly resolved (Gould and DeCourcy 2023). In the latest year of data, most measurable spikes in the workforce by demographic and job characteristics normalized in the last year. As a percent of the workforce, white workers, workers with lower levers of educational attainment, and leisure and hospitality workers are found at slightly lower rates in 2023 than in 2019.
2. Appendix Figure A provides a look at cumulative real wage changes over the entire period, 1979 to 2023, to get a sense of overall wage trends. Even though the most recent period exhibited wage compression, it’s clear that the much longer forty-year period of unequal growth remains the most striking finding from the overall period.
3. West Virginia is the one exception; their minimum is higher than the federal, but they last increased it in 2015 (EPI 2024c).
4. For state-based analysis, we exclude workers whose wages were allocated or imputed. The wage allocation model does not include a state indicator (Census 2021). This can mute or flatten differences in wages between states. When imputed wages are included, the wage differential shrinks to 2.5 percentage points as the estimates 10th percentile wage increase in state without minimum wage increases is measured as 7.6% and the 10th percentile wage increase in state with minimum wage increases is measured as 10.1%.
5. In case there’s any confusion, the 10th percentile nationally is not just a weighted sum of states with and without state minimum wage increases, which is why both growth rates can be lower than the overall reported earlier in this report.
6. Although the report referenced only provides evidence through 2022, it is clear from the lack of federal minimum wage increases and rising prices that minimum wage has hit a 67-year low.
7. EPI analysis of Current Population Survey Outgoing Rotation Group microdata (EPI 2024a). The 10th-percentile wage in each state group is a weighted average of the states’ 10th-percentile wages.
Appendix
Appendix Figure AHigh earners experienced the fastest wage growth since 1979: Cumulative percent change in real hourly wages by wage group, 1979–2023
Low-wage<br>(10th percentile)
Lower-middle-wage<br>(avg 20th–40th)
Middle-wage<br>(avg 40th–60th)
Upper-middle-wage<br>(avg 60th–80th)
High-wage<br>(90th percentile)
1979
0.0%
0.0%
0.0%
0.0%
0.0%
1980
-4.4%
-2.0%
-2.5%
-1.7%
0.3%
1981
-6.6%
-3.4%
-3.2%
-1.7%
1.4%
1982
-10.4%
-4.4%
-2.7%
-1.2%
0.6%
1983
-13.7%
-5.5%
-3.5%
-1.3%
3.3%
1984
-15.8%
-5.0%
-3.2%
-1.1%
5.7%
1985
-17.2%
-4.6%
-2.2%
0.3%
3.1%
1986
-17.0%
-3.0%
0.0%
2.4%
7.8%
1987
-16.2%
-2.9%
0.3%
2.3%
9.2%
1988
-14.3%
-2.8%
0.1%
2.1%
9.9%
1989
-17.2%
-3.4%
-0.4%
1.2%
8.5%
1990
-15.4%
-3.5%
-1.6%
0.6%
8.8%
1991
-15.3%
-3.5%
-1.6%
1.0%
10.3%
1992
-13.4%
-3.7%
-1.8%
0.9%
8.1%
1993
-12.4%
-3.8%
-1.5%
1.6%
9.1%
1994
-12.1%
-4.6%
-2.2%
1.6%
11.8%
1995
-13.7%
-4.4%
-2.0%
1.5%
11.4%
1996
-15.2%
-4.0%
-2.1%
1.5%
12.9%
1997
-13.0%
-2.3%
-0.9%
2.8%
14.3%
1998
-7.3%
1.1%
2.3%
5.8%
18.4%
1999
-5.2%
3.7%
4.3%
8.2%
19.4%
2000
-6.0%
4.7%
5.2%
8.9%
21.1%
2001
-2.8%
6.6%
7.4%
10.4%
25.7%
2002
-0.1%
7.9%
8.6%
12.1%
26.7%
2003
0.8%
8.2%
9.1%
13.1%
26.5%
2004
-2.8%
7.4%
9.1%
12.8%
28.1%
2005
-4.5%
6.0%
7.5%
11.8%
27.1%
2006
-5.2%
6.0%
7.8%
11.7%
29.4%
2007
-4.3%
6.3%
8.2%
13.0%
30.5%
2008
-1.2%
6.2%
8.4%
13.1%
30.5%
2009
-0.7%
7.7%
10.9%
15.9%
34.3%
2010
-2.3%
6.2%
9.7%
14.9%
35.2%
2011
-4.2%
3.9%
7.3%
12.8%
31.9%
2012
-6.1%
2.6%
6.5%
12.6%
32.9%
2013
-6.4%
2.6%
6.4%
12.8%
33.8%
2014
-4.9%
2.7%
6.2%
12.4%
33.0%
2015
-1.2%
5.1%
8.3%
15.2%
38.1%
2016
0.4%
8.0%
9.8%
17.1%
40.8%
2017
5.0%
9.8%
11.1%
18.2%
43.7%
2018
5.8%
11.4%
11.9%
18.8%
46.0%
2019
4.5%
15.1%
14.0%
21.0%
45.4%
2020
12.6%
22.3%
22.1%
29.3%
57.5%
2021
14.2%
20.7%
18.8%
25.4%
50.3%
2022
13.2%
19.2%
16.4%
22.8%
51.4%
2023
18.3%
20.8%
17.4%
23.4%
51.7%
Note: Shaded areas denote recessions.
Source: EPI analysis of the Current Population Survey Outgoing Rotation Group microdata, EPI Current Population Survey Extracts, Version 1.0.48 (2024a), https://microdata.epi.org.
High earners experienced the fastest wage growth since 1979: Cumulative percent change in real hourly wages by wage group, 1979–2023
| Low-wage<br>(10th percentile) | Lower-middle-wage<br>(avg 20th–40th) | Middle-wage<br>(avg 40th–60th) | Upper-middle-wage<br>(avg 60th–80th) | High-wage<br>(90th percentile) | |
|---|---|---|---|---|---|
| 1979 | 0.0% | 0.0% | 0.0% | 0.0% | 0.0% |
| 1980 | -4.4% | -2.0% | -2.5% | -1.7% | 0.3% |
| 1981 | -6.6% | -3.4% | -3.2% | -1.7% | 1.4% |
| 1982 | -10.4% | -4.4% | -2.7% | -1.2% | 0.6% |
| 1983 | -13.7% | -5.5% | -3.5% | -1.3% | 3.3% |
| 1984 | -15.8% | -5.0% | -3.2% | -1.1% | 5.7% |
| 1985 | -17.2% | -4.6% | -2.2% | 0.3% | 3.1% |
| 1986 | -17.0% | -3.0% | 0.0% | 2.4% | 7.8% |
| 1987 | -16.2% | -2.9% | 0.3% | 2.3% | 9.2% |
| 1988 | -14.3% | -2.8% | 0.1% | 2.1% | 9.9% |
| 1989 | -17.2% | -3.4% | -0.4% | 1.2% | 8.5% |
| 1990 | -15.4% | -3.5% | -1.6% | 0.6% | 8.8% |
| 1991 | -15.3% | -3.5% | -1.6% | 1.0% | 10.3% |
| 1992 | -13.4% | -3.7% | -1.8% | 0.9% | 8.1% |
| 1993 | -12.4% | -3.8% | -1.5% | 1.6% | 9.1% |
| 1994 | -12.1% | -4.6% | -2.2% | 1.6% | 11.8% |
| 1995 | -13.7% | -4.4% | -2.0% | 1.5% | 11.4% |
| 1996 | -15.2% | -4.0% | -2.1% | 1.5% | 12.9% |
| 1997 | -13.0% | -2.3% | -0.9% | 2.8% | 14.3% |
| 1998 | -7.3% | 1.1% | 2.3% | 5.8% | 18.4% |
| 1999 | -5.2% | 3.7% | 4.3% | 8.2% | 19.4% |
| 2000 | -6.0% | 4.7% | 5.2% | 8.9% | 21.1% |
| 2001 | -2.8% | 6.6% | 7.4% | 10.4% | 25.7% |
| 2002 | -0.1% | 7.9% | 8.6% | 12.1% | 26.7% |
| 2003 | 0.8% | 8.2% | 9.1% | 13.1% | 26.5% |
| 2004 | -2.8% | 7.4% | 9.1% | 12.8% | 28.1% |
| 2005 | -4.5% | 6.0% | 7.5% | 11.8% | 27.1% |
| 2006 | -5.2% | 6.0% | 7.8% | 11.7% | 29.4% |
| 2007 | -4.3% | 6.3% | 8.2% | 13.0% | 30.5% |
| 2008 | -1.2% | 6.2% | 8.4% | 13.1% | 30.5% |
| 2009 | -0.7% | 7.7% | 10.9% | 15.9% | 34.3% |
| 2010 | -2.3% | 6.2% | 9.7% | 14.9% | 35.2% |
| 2011 | -4.2% | 3.9% | 7.3% | 12.8% | 31.9% |
| 2012 | -6.1% | 2.6% | 6.5% | 12.6% | 32.9% |
| 2013 | -6.4% | 2.6% | 6.4% | 12.8% | 33.8% |
| 2014 | -4.9% | 2.7% | 6.2% | 12.4% | 33.0% |
| 2015 | -1.2% | 5.1% | 8.3% | 15.2% | 38.1% |
| 2016 | 0.4% | 8.0% | 9.8% | 17.1% | 40.8% |
| 2017 | 5.0% | 9.8% | 11.1% | 18.2% | 43.7% |
| 2018 | 5.8% | 11.4% | 11.9% | 18.8% | 46.0% |
| 2019 | 4.5% | 15.1% | 14.0% | 21.0% | 45.4% |
| 2020 | 12.6% | 22.3% | 22.1% | 29.3% | 57.5% |
| 2021 | 14.2% | 20.7% | 18.8% | 25.4% | 50.3% |
| 2022 | 13.2% | 19.2% | 16.4% | 22.8% | 51.4% |
| 2023 | 18.3% | 20.8% | 17.4% | 23.4% | 51.7% |
Note: Shaded areas denote recessions.
Source: EPI analysis of the Current Population Survey Outgoing Rotation Group microdata, EPI Current Population Survey Extracts, Version 1.0.48 (2024a), https://microdata.epi.org.
References
Aaronson, Daniel, Luojia Hu, and Aastha Rajan. 2021. Did Covid-19 Disproportionately Affect Mothers’ Labor Market Activity? Federal Reserve Bank of Chicago, January 2021.
Autor, David, Arindrajit Dube, and Annie McGrew. 2023. “The Unexpected Compression: Competition at Work in the Low Wage Labor Market.” National Bureau of Economic Research Working Paper no. 31010, March 2023.
Bahn, Kate, and Carmen Sanchez Cumming. 2020. Four Graphs on U.S. Occupational Segregation by Race, Ethnicity, Gender. Washington Center for Equitable Growth, July 2020.
Bivens, Josh. 2023. “Learning the Right Lessons from Recent Inflation.” American Prospect, January 10, 2023.
Bivens, Josh, and Ben Zipperer. 2018. The Importance of Locking in Full Employment for the Long Haul. Economic Policy Institute, August 2018.
Census Bureau. 2021. “Imputation of Unreported Data Items” (web page). Accessed February 2024.
Cooper, David, Sebastian Martinez Hickey, and Ben Zipperer. 2022. “The Value of the Federal Minimum Wage Is at Its Lowest Point in 66 Years.” Working Economics Blog (Economic Policy Institute), July 14, 2022.
Economic Policy Institute (EPI). 2024a. Current Population Survey Extracts, Version 1.0.48, https://microdata.epi.org.
Economic Policy Institute (EPI). 2024b. Family Budget Calculator. Last modified January 2024.
Economic Policy Institute (EPI). 2024c. Minimum Wage Tracker. Last updated January 1, 2024.
Gould, Elise. 2017. The State of American Wages 2016: Lower Unemployment Finally Helps Working People Make Up Some Lost Ground on Wages. Economic Policy Institute, March 2017.
Gould, Elise. 2020. State of Working America Wages 2019: A Story of Slow, Uneven, and Unequal Wage Growth over the Last 40 Years. Economic Policy Institute, February 2020.
Gould, Elise, and Katherine deCourcy. 2023. Low-wage Workers Have Seen Historically Fast Real Wage Growth in the Pandemic Business Cycle. Economic Policy Institute, March 2023.
Gould, Elise, and Jori Kandra. 2021. Wages Grew in 2020 Because the Bottom Fell Out of the Low-Wage Labor Market. Economic Policy Institute, February 2021.
Gould, Elise, and Jori Kandra. 2022. State of Working America 2021: Measuring Wages in the Pandemic Labor Market. Economic Policy Institute, April 2022.
Gould, Elise, and Jori Kandra. 2023. “Wage Inequality Fell in 2022 Because Stock Market Declines Brought Down Pay of the Highest Earners.” Working Economics Blog (Economic Policy Institute), December 11, 2023.
Gould, Elise, and Melat Kassa. 2021. Low-Wage, Low-Hours Workers Were Hit Hardest in the COVID-19 Recession. Economic Policy Institute, May 2021.
Gould, Elise, Zane Mokhiber, and Katherine deCourcy. 2024. What Constitutes a Living Wage? Economic Policy Institute, January 2024.
Gould, Elise, and Heidi Shierholz. 2022. “The Economy Is Recovering Fast. But We Need to Ensure It Works for Everyone.” CNN Business Perspectives, March 3, 2022.
Hickey, Sebastian Martinez. 2023. “Twenty-two States Will Increase Their Minimum Wages on January 1, Raising Pay for Nearly 10 Million Workers.” Working Economics Blog (Economic Policy Institute), December 21, 2023.
Landivar, Liana Christin, and Mark deWolf. 2022. Mothers’ Employment Two Years Later: An Assessment of Employment Loss and Recovery During the COVID-19 Pandemic. Economic Policy Institute, May 2022.
Trackinsight. 2024. “The Year of the Rebound” (website). Accessed February 2024.
Wilson, Valerie, and William Darity Jr. 2022. Understanding Black–White Disparities in Labor Market Outcomes Requires Models That Account for Persistent Discrimination and Unequal Bargaining Power. Economic Policy Institute, March 2022.