Briefing Paper #371
Earlier this year, EPI released an analysis of the Fair Minimum Wage Act of 2013, a bill introduced by Sen. Tom Harkin (D-Iowa) and Rep. George Miller (D-Calif.) that would raise the federal minimum wage in three incremental increases of $0.95 from its current level of $7.25 per hour to $10.10 per hour (see Cooper and Hall 2013). The Harkin-Miller proposal would then index the minimum wage to inflation, so that as prices rise in subsequent years, the minimum would automatically be adjusted to preserve its real value. At the same time, the bill would raise the base wage paid to tipped workers from the current $2.13 per hour—where it has stood since 1991—in incremental increases over six years until it equals 70 percent of the full minimum wage.
Since that analysis was released, five states have raised their state minimum wages: California, Connecticut, New Jersey, New York, and Rhode Island.1 The increases in these states underscore the broad recognition that the current federal minimum wage is too low. These increases slightly alter our earlier estimates of the impact of a federal minimum-wage increase to $10.10 because workers in these states who would have been affected by the federal increase will now have higher wages as a result of their higher state minimums. Yet the conclusion of our previous analysis remains unchanged: Raising the federal minimum wage to $10.10 by 2016 would lift incomes for millions of American workers and provide a modest boost to U.S. GDP.
This paper provides an update to our original analysis that reflects these higher state minimum wages, and changes in economic conditions over the past year. It begins by providing some context for the current minimum wage and the Harkin-Miller proposal, describing how today’s minimum and the proposed new minimum compare with historical benchmarks. It then provides a demographic overview of the workers who would be affected (both directly and indirectly) by raising the federal minimum wage to $10.10. Finally, it details the GDP and job creation effects that would occur as a result of such an increase.
Key findings include:
- Raising the federal minimum wage to $10.10 by 2016 would return the federal minimum wage to roughly the same inflation-adjusted value it had in the late 1960s.
- An increase to $10.10 would either directly or indirectly raise the wages of 27.8 million workers, who would receive about $35 billion in additional wages over the phase-in period.
- Across the phase-in period of the increase, GDP would grow by about $22 billion, resulting in the creation of roughly 85,000 net new jobs over that period.
- The workers who would receive a raise do not fit the stereotypes of low-wage workers:
- Among affected workers, the average age is 35 years old, nearly 88 percent are at least 20 years old, and more than a third (34.5 percent) are at least 40 years old.
- Of affected workers, about 54 percent work full time, about 69 percent come from families with family incomes less than $60,000, and more than a quarter have children.
- The average affected worker earns half of his or her family’s total income.
The minimum wage in context
Every year that the minimum wage remains the same in nominal dollars, inflation slowly erodes its real (i.e., inflation-adjusted) value, leaving minimum-wage workers with a paycheck that cannot buy as much as it did in years past. This, of course, threatens the material well-being of minimum-wage workers in low-income families who rely on every dollar of income just to afford basic necessities.
At the current federal minimum wage of $7.25, a parent who works full time, year round, does not earn enough to be above the federal poverty line. This was not always the case. As shown in Figure A, throughout the 1960s and 1970s, a full-time, full-year minimum-wage income was above the poverty line for a family of two. At its high point in real value in the late 1960s, a full-time, full-year minimum-wage income was enough to keep a family of three above the poverty line, although it still fell shy of the poverty line for a family of four.
Annual minimum-wage earnings and poverty line for families of two to four, 1964–2013 and projected for 2013–2016 under proposal to raise the federal minimum wage to $10.10 by 2016 (2013 dollars)
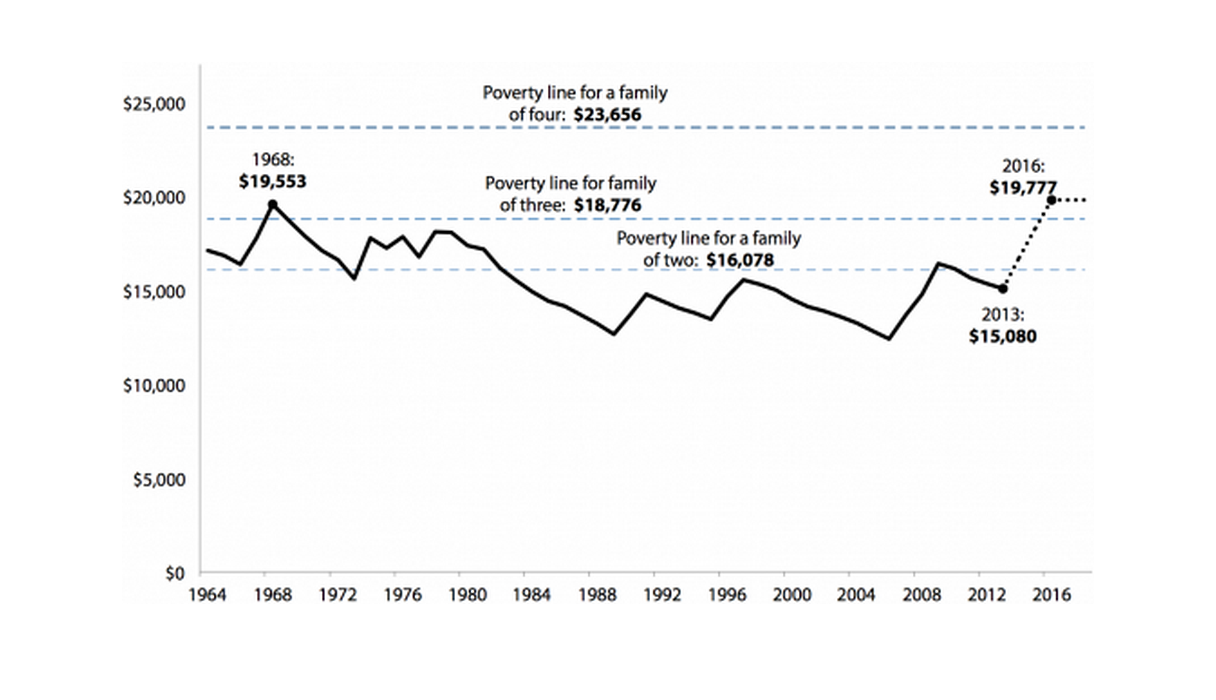

Note: Poverty thresholds for 2013 for family of two (one adult, one child) and three (two adults, one child) and four (two adults, two children) are inflated from 2012 U.S. Census Bureau thresholds by CBO-projected inflation for 2013. The poverty threshold for one adult, two children is slightly higher ($18,794) than for the family of three configuration shown here. Projections are based upon CBO inflation projections and the proposal to raise the minimum wage to $10.10 by 2016. Annual earnings are calculated assuming workers work 40 hours per week, 52 weeks per year.
Source: Author's analysis of Harkin-Miller proposal, U.S. Census Bureau (2012), CBO (2013), and U.S. Department of Labor Wage and Hour Division (2013)
The black dotted line in the figure shows what a full-time minimum-wage worker would earn if the minimum wage were raised to $10.10 by 2016, as the Harkin-Miller bill proposes. Such an increase would return a full-time minimum-wage income to a level sufficient to protect a family of three from poverty. Because the Harkin-Miller bill would also index the minimum wage to inflation, full-time minimum-wage workers would never again fall below this threshold.
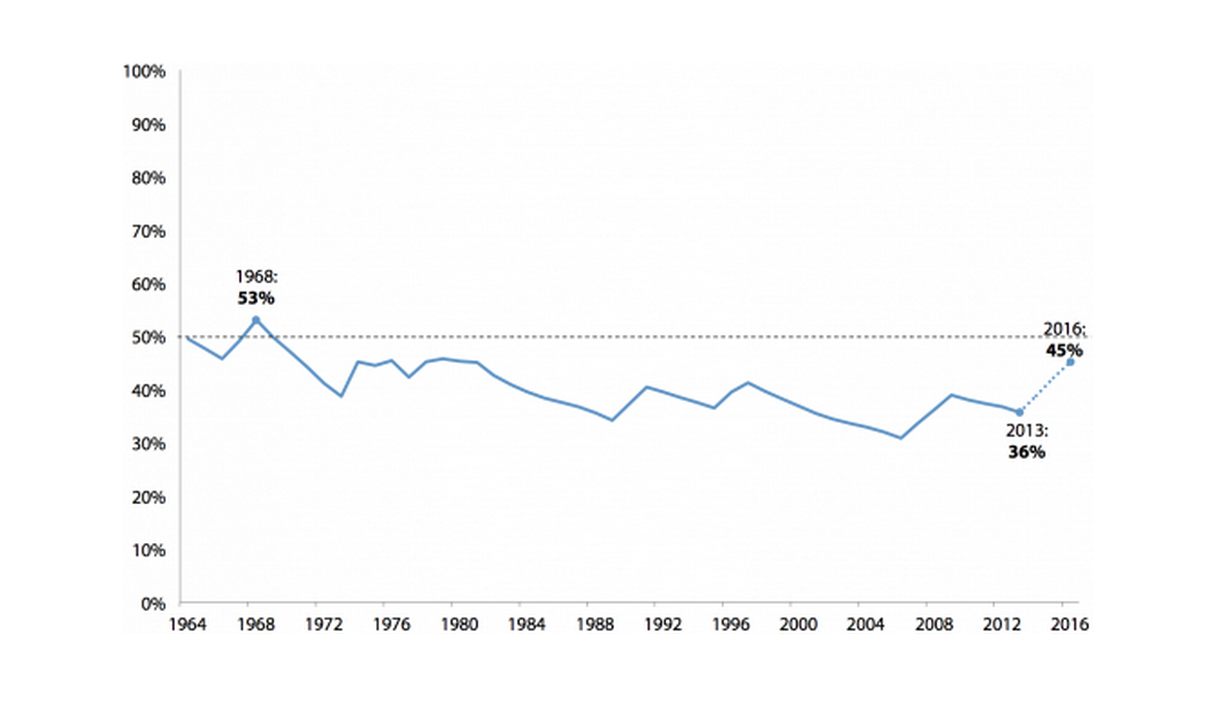
The declining real value of the minimum wage has also significantly contributed to the enormous growth in U.S. income inequality (Mishel 2013). The gap between the minimum wage and the average wage of typical American workers used to be much smaller than it is today. Figure B depicts the value of the minimum wage as a percentage of the average wage of production, non-supervisory workers. From the mid-1960s up until the early 1980s, minimum-wage workers earned a wage equal to roughly half that of the typical American worker. Today’s minimum wage is equal to only 36 percent of the average production, non-supervisory worker wage. Raising the minimum wage to $10.10 by 2016 would return the minimum wage to roughly 50 percent of the average production worker wage.
Federal minimum wage as a percentage of the average U.S. wage of production/nonsupervisory workers, 1964–2013 and projected for 2013–2016 under proposal to raise the federal minimum wage to $10.10 by July 2016
Source: Author's analysis of Harkin-Miller proposal, Current Population Survey Outgoing Rotation Group microdata, and U.S. Department of Labor Wage and Hour Division (2013)
It is important to also recognize that today’s minimum wage has not fallen to exceptional lows out of economic necessity. Over the past 45 years, the U.S. economy has vastly expanded, and productivity (our ability to produce goods and services for the same amount of work) has more than doubled. Yet the minimum wage—our agreed-upon standard for the minimum amount a worker in our society should be paid—has been left to stagnate and decline. Figure C shows the value of the minimum wage since 1968, compared with what it might have been had it grown at the same rate as average wages or total economy productivity (i.e., how much we can produce for an hour’s worth of work).
Real value of the federal minimum wage, 1968–2013 and 2013–2016 under proposed increase to $10.10 by 2016, compared with its value had it grown at the rate of productivity or average worker wages (2013 dollars)
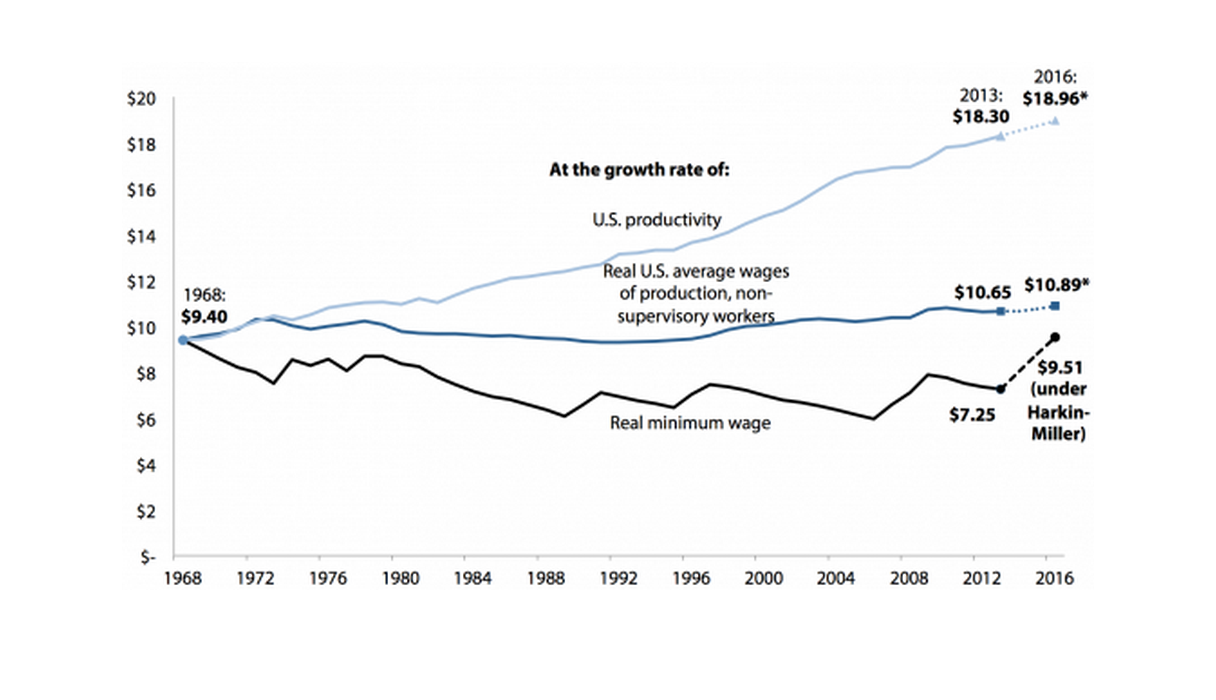
* Productivity and average wage projections from 2013 to 2016 do not include the Harkin-Miller proposal.
Note: Dollars are deflated using CPI-U-RS and CBO inflation projections. Projected wage values are based on CBO inflation projections, average wage and productivity growth from 2002 to 2006 (the last full regular business cycle), and, in the case of the "real minimum wage" line, the proposal to raise the federal minimum wage to $10.10 by 2016.
Source: Author's analysis of Total Economy Productivity data from the Bureau of Labor Statistics (BLS) Labor Productivity and Costs program, BLS Current Employment Statistics, Current Population Survey Outgoing Rotation Group microdata, CBO (2013), U.S. Department of Labor Wage and Hour Division (2013), and the Harkin-Miller proposal
As the figure shows, the minimum wage in 1968 equaled roughly $9.40 in today’s dollars. Had it grown from that point at the same rate as growth in wages for the typical American worker, it would be about $10.65 today, and projected to be about $10.89 by 2016. If the minimum wage had grown at the same rate as productivity, it would be $18.30 today, and close to $19 per hour by 2016 (under reasonable expectations for productivity growth). As depicted by the dotted black line, the Harkin-Miller proposal to raise the minimum wage to $10.10 by 2016 would lift the minimum to just above its real value from 1968 (in 2013 dollars)—a worthwhile improvement, yet still well below what the economy could sustain, given economic growth and technological progress since that time.
Demographic characteristics of affected workers
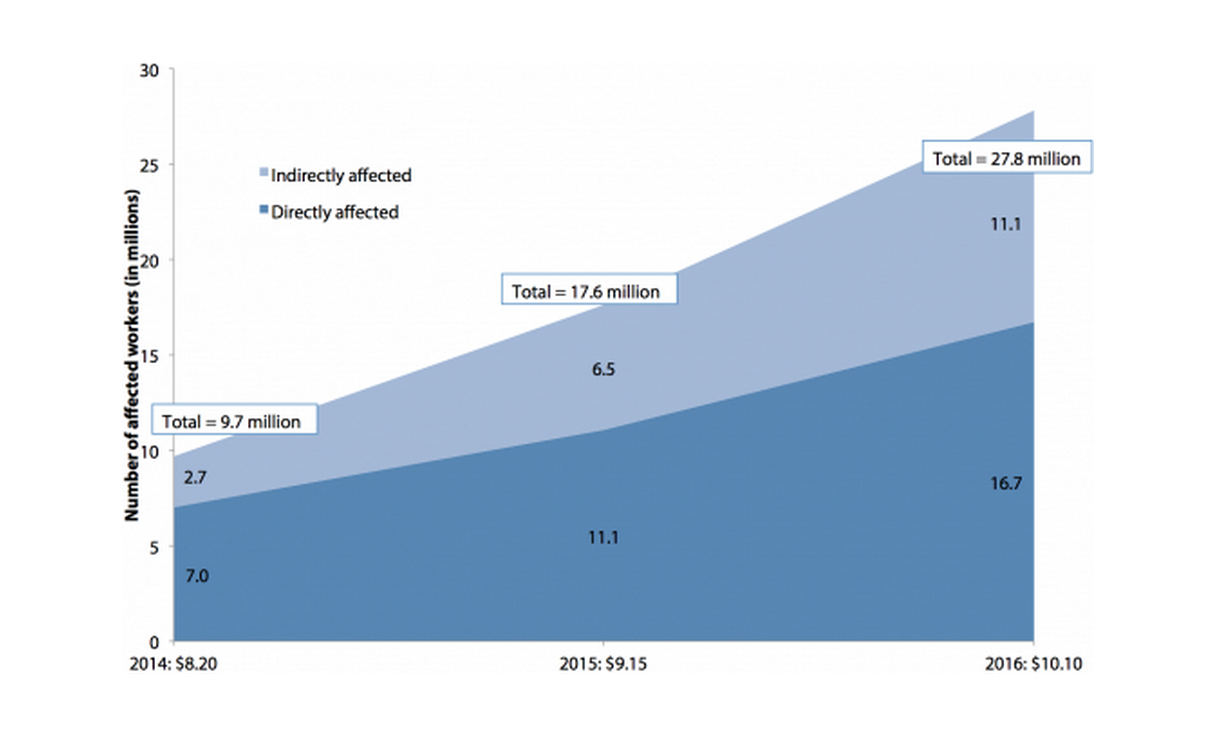
Increasing the minimum wage to $10.10 per hour by 2016 would lift incomes for millions of American workers, most of whom do not fit the prevailing impressions of low-wage workers as teenagers working part-time jobs for extra spending money. Figure D shows the number of workers who would be directly and indirectly affected in each year of the proposed incremental increases.
Number of workers (in millions) affected by raising the federal minimum wage to $10.10 by July 2016
| Year | Directly affected | Indirectly affected |
|---|---|---|
| 2014: $8.20 | 7 | 2.7 |
| 2015: $9.15 | 11.1 | 6.5 |
| 2016: $10.10 | 16.7 | 11.1 |
Source: Author's analysis of Harkin-Miller proposal using Current Population Survey Outgoing Rotation Group microdata
With the initial increase to $8.20 per hour, 7.0 million workers would be directly affected. These are workers who currently earn between $7.25 and $8.20 per hour. Another 2.7 million workers with wages just above $8.20 per hour would be indirectly affected by the “ripple effect” of the increase, receiving a raise as employers adjust their overall pay ladders (Shierholz 2009). In the second year, as the federal minimum wage is increased to $9.15 per hour, 11.1 million workers would be directly affected, and another 6.5 million would be indirectly affected. In the final increase to $10.10 one year later, a total of 27.8 million American workers would see their pay increase, with 16.7 million workers directly affected and another 11.1 million indirectly affected.
We now examine the demographic characteristics—in terms of gender, age, work hours, family income, and family composition—of the workers who would be directly and indirectly affected.
Gender
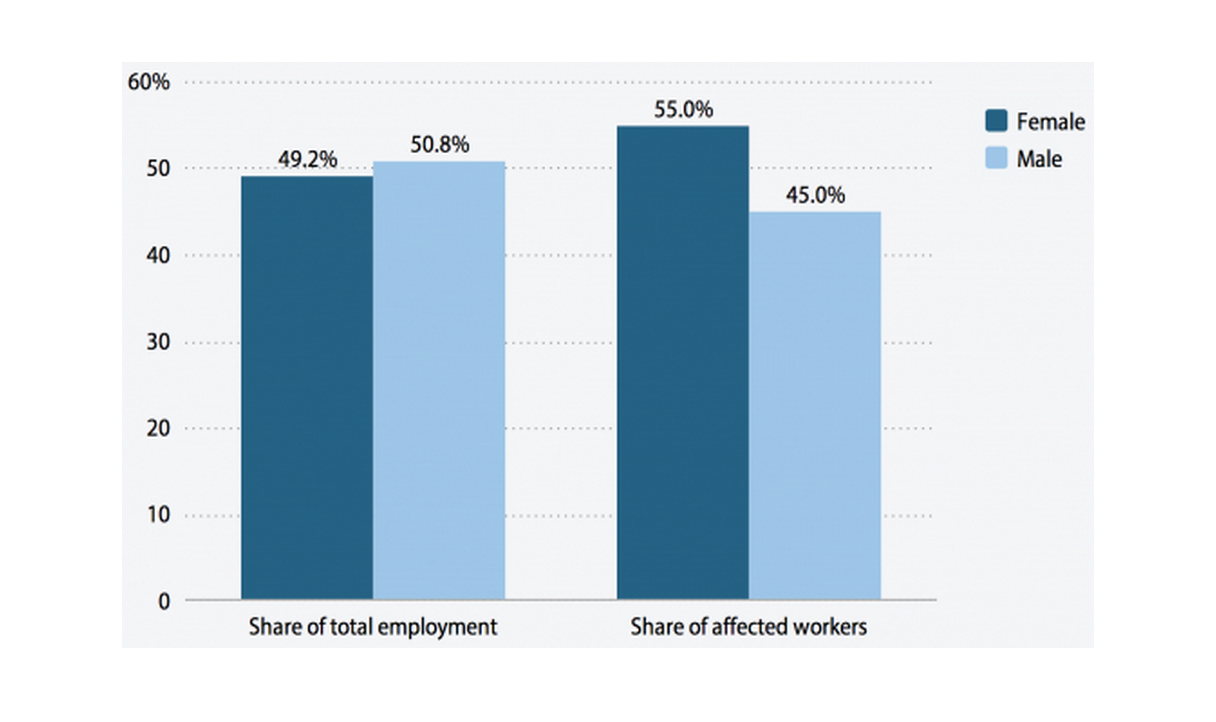
While raising the minimum wage would benefit both men and women, it would disproportionately affect women. As depicted in Figure E, women account for 49.2 percent of total U.S. employment, yet comprise 55.0 percent of the workers whose incomes would rise by increasing the minimum wage to $10.10. The share of those affected who are women varies somewhat by state, from a low of 47.7 percent in California to a high of 63.3 percent in Mississippi.
Gender distribution of workers affected by raising the federal minimum wage to $10.10 by July 2016, and of total employment
| Female | Male | |
|---|---|---|
| Share of total employment | 49.2% | 50.8% |
| Share of affected workers | 55.0% | 45.0% |
Source: Author's analysis of Harkin-Miller proposal using Current Population Survey Outgoing Rotation Group microdata and BLS Current Employment Statistics (2013)
Age
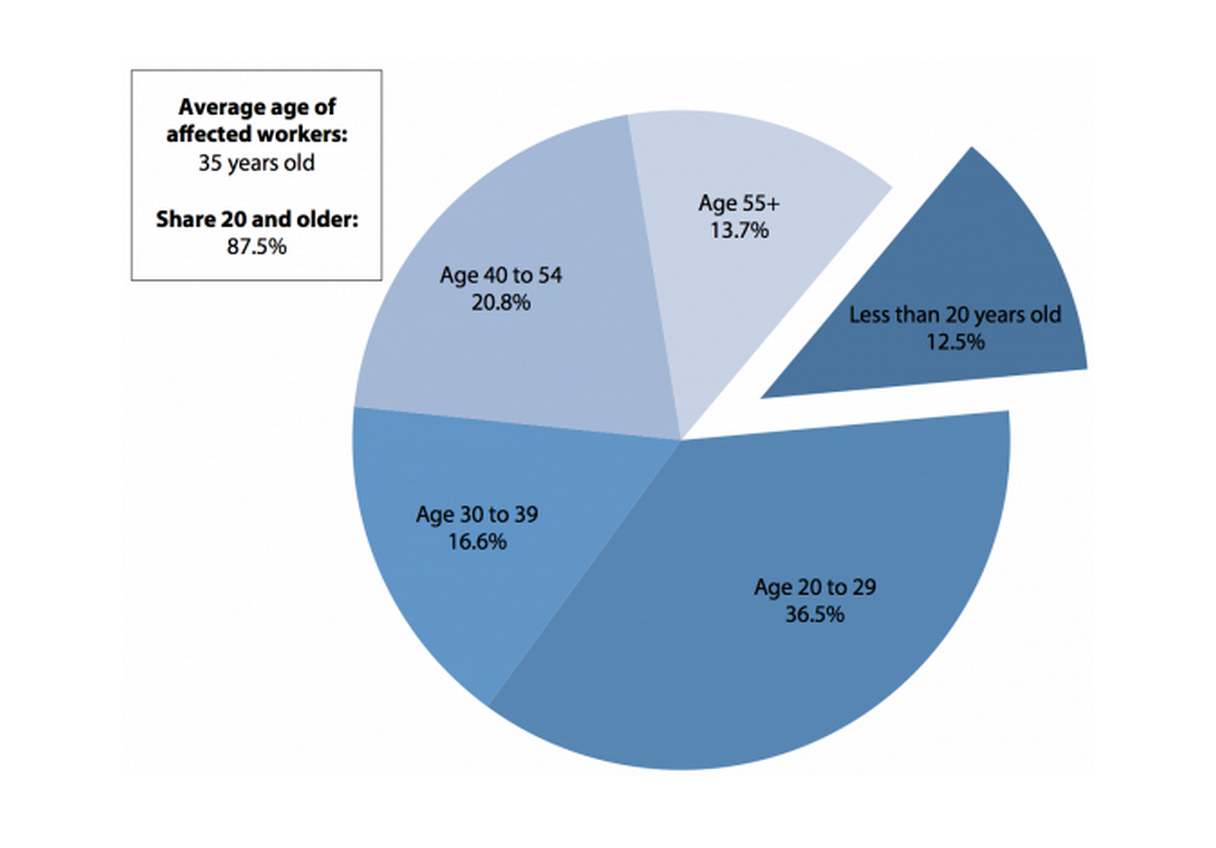
Perhaps the most common incorrect perception of low-wage workers is that they are largely teenagers and almost entirely young people. While there certainly are a number of low-wage workers who fit this description, young workers comprise only a small fraction of the workers who would be affected by an increase to $10.10. Of the workers who would receive a raise if the minimum wage were lifted to $10.10 by 2016, only 12.5 percent are teens. In fact, of those affected, more are age 55 or older than are teenagers. The average age among affected workers is 35 years old, more than half of all affected workers are at least 30, and more than a third (34.5 percent) are at least 40 (see Figure F).
Work hours
Among those who would be affected by increasing the minimum wage to $10.10, only 14.2 percent work fewer than 20 hours per week. As seen in Figure G, more than half (53.8 percent) work full time (35 or more hours per week), and 32.0 percent work between 20 and 34 hours per week.
Work status of workers affected by raising the federal minimum wage to $10.10 by July 2016
| Share of affected workers | |
|---|---|
| Part time (< 20 hours) | 14.2% |
| Mid time (20-34 hours) | 32.0% |
| Full time (35+ hours) | 53.8% |
Source: Author's analysis of Harkin-Miller proposal using Current Population Survey Outgoing Rotation Group microdata
The report’s supplementary state tables (available at http://www.epi.org/files/2013/minimum-wage-state-tables.pdf) provide demographic information on affected workers by state. The data show that Southern states tend to have higher shares of affected workers who work full time. Arkansas (66.1 percent), Louisiana (65.4 percent), Texas (64.0 percent), and Georgia (62.2 percent) have the highest shares, with more than 60 percent of affected individuals working full time. States in New England and the Midwest have the smallest shares of affected workers who work full time, with Connecticut (36.4 percent), Minnesota (38.3 percent), and New Hampshire (39.3 percent) having shares below 40 percent.
Family income
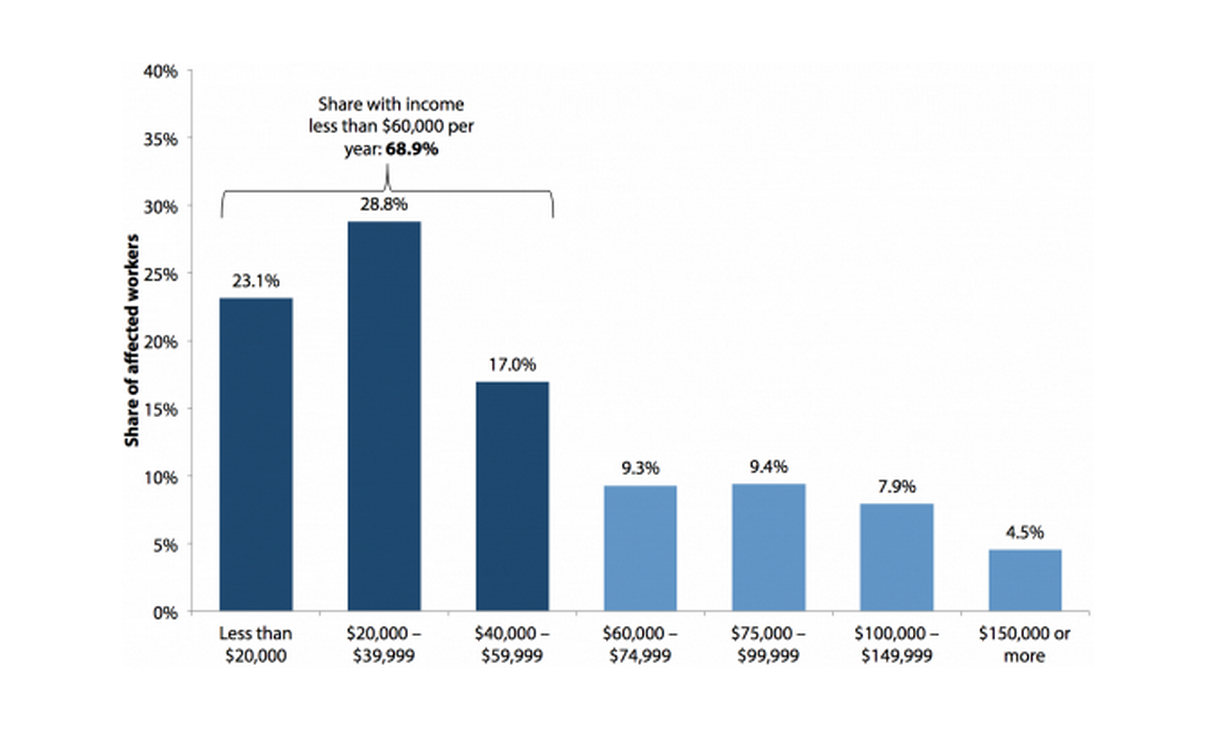
Those who would be affected come largely from families with low to moderate income levels. As shown in Figure H, 68.9 percent of affected workers have total family incomes of less than $60,000 per year, and nearly a quarter (23.1 percent) have family incomes below $20,000 per year. Among all U.S. families, the median family income in 2012 was $62,527 (according to data from the American Community Survey), which means that nearly 70 percent of affected workers come from families in the bottom half of the income distribution.
Family income of workers affected by raising the federal minimum wage to $10.10 by July 2016
| Family Income level | Share |
|---|---|
| Less than $20,000 | 23.1% |
| $20,000 – $39,999 | 28.8% |
| $40,000 – $59,999 | 17.0% |
| $60,000 – $74,999 | 9.3% |
| $75,000 – $99,999 | 9.4% |
| $100,000 – $149,999 | 7.9% |
| $150,000 or more | 4.5% |
Source: Author's analysis of Harkin-Miller proposal using Current Population Survey Outgoing Rotation Group microdata
The share of workers affected by increasing the federal minimum wage to $10.10 with family income below $60,000 varies considerably by state, ranging from a low of 46.9 percent in New Hampshire to a high of 80.2 percent in Montana (and 80.4 percent in the District of Columbia).
Low- and minimum-wage workers are often dismissed as “secondary earners,” implying that the income earned by these workers is primarily discretionary income, unessential to their family’s well-being. This is patently false: The workers who would be affected by increasing the minimum wage to $10.10 earn, on average, 50 percent of their family’s total income. As shown in Figure I, this percentage varies from a low of 32.9 percent in New Hampshire to a high of 60.3 percent in Louisiana.
Average share of family income provided by worker affected by raising the federal minimum wage to $10.10 by 2016, by state
| State | Share |
|---|---|
| New Hampshire | 32.9% |
| Connecticut | 35.6% |
| New Jersey | 38.7% |
| Maryland | 39.1% |
| Vermont | 39.3% |
| Alaska | 39.5% |
| Massachusetts | 39.8% |
| Minnesota | 41.0% |
| Rhode Island | 41.3% |
| Pennsylvania | 41.7% |
| Maine | 42.6% |
| Hawaii | 42.9% |
| Utah | 43.4% |
| Wisconsin | 43.9% |
| Washington | 45.4% |
| Ohio | 45.8% |
| Iowa | 45.9% |
| Michigan | 46.0% |
| Illinois | 46.1% |
| Nebraska | 46.3% |
| New York | 46.8% |
| Delaware | 46.8% |
| Virginia | 46.8% |
| North Dakota | 47.1% |
| Colorado | 47.4% |
| Indiana | 48.0% |
| Nevada | 48.7% |
| United States | 50.0% |
| Oregon | 50.1% |
| Missouri | 50.2% |
| Arizona | 51.7% |
| Idaho | 51.7% |
| Wyoming | 52.2% |
| New Mexico | 53.2% |
| California | 53.2% |
| South Dakota | 53.4% |
| South Carolina | 54.0% |
| Tennessee | 54.1% |
| Florida | 54.4% |
| West Virginia | 54.6% |
| Kentucky | 55.0% |
| Kansas | 55.1% |
| Alabama | 55.2% |
| Montana | 55.4% |
| Georgia | 55.5% |
| Texas | 55.7% |
| North Carolina | 56.3% |
| Mississippi | 57.0% |
| Oklahoma | 57.1% |
| Arkansas | 58.9% |
| District of Columbia | 59.8% |
| Louisiana | 60.3% |
Source: Author's analysis of Harkin-Miller proposal using Current Population Survey Outgoing Rotation Group microdata
Family composition
Nationally, more than a quarter (26.5 percent) of those who would be affected by increasing the minimum wage to $10.10 are parents. In fact, of the nation’s roughly 75 million children, nearly one-fifth (18.7 percent) have at least one parent who would receive a raise if the minimum wage were increased to $10.10. This percentage varies from 10.8 percent in Alaska (and 9.7 percent in the District of Columbia) to 25.7 percent in Texas, as shown in Figure J. Including Texas, there are 12 states where more than one-fifth of children have a parent who would benefit from the minimum-wage increase: Idaho (25.0 percent), Arkansas (24.6 percent), South Carolina (24.1 percent), Louisiana (23.3 percent), Kentucky (22.3 percent), North Carolina (21.9 percent), Florida (21.3 percent), Alabama (21.0 percent), Tennessee (20.9 percent), Utah (20.7 percent), and Nevada (20.3 percent). Of these 12 states, all but Idaho, Utah, and Nevada had child poverty rates of 25 percent or more in 2012 (Annie E. Casey Foundation 2013).
Share of children with at least one parent affected by raising the federal minimum wage to $10.10 by July 2016, by state
| State name | Share of state kids |
|---|---|
| District of Columbia | 9.7% |
| Alaska | 10.8% |
| Connecticut | 11.0% |
| Maine | 11.9% |
| Vermont | 12.1% |
| Washington | 12.3% |
| New Hampshire | 12.8% |
| Minnesota | 13.0% |
| Maryland | 13.4% |
| Wyoming | 13.7% |
| North Dakota | 13.8% |
| New Jersey | 13.9% |
| Massachusetts | 14.3% |
| Oregon | 14.7% |
| Michigan | 14.9% |
| Hawaii | 15.0% |
| Oklahoma | 15.3% |
| New York | 15.9% |
| New Mexico | 16.3% |
| Iowa | 16.8% |
| Colorado | 17.0% |
| Nebraska | 17.0% |
| Wisconsin | 17.2% |
| West Virginia | 17.6% |
| California | 17.6% |
| Arizona | 17.9% |
| Rhode Island | 18.2% |
| Pennsylvania | 18.4% |
| United States | 18.7% |
| Delaware | 18.9% |
| Indiana | 18.9% |
| Illinois | 18.9% |
| Kansas | 19.0% |
| South Dakota | 19.1% |
| Virginia | 19.1% |
| Georgia | 19.3% |
| Ohio | 19.4% |
| Montana | 19.6% |
| Mississippi | 19.6% |
| Missouri | 19.9% |
| Nevada | 20.3% |
| Utah | 20.7% |
| Tennessee | 20.9% |
| Alabama | 21.0% |
| Florida | 21.3% |
| North Carolina | 21.9% |
| Kentucky | 22.3% |
| Louisiana | 23.3% |
| South Carolina | 24.1% |
| Arkansas | 24.6% |
| Idaho | 25.0% |
| Texas | 25.7% |
Source: Author's analysis of Harkin-Miller proposal using Current Population Survey Outgoing Rotation Group microdata
Raising the minimum wage to spur economic growth
As explained in our original analysis of the Harkin-Miller proposal (Cooper and Hall 2013), raising the minimum wage would provide immediate benefits not only to affected workers (whose incomes would rise), but to the broader economy as well. Research over the past two decades has shown that, despite skeptics’ claims, modest increases in the minimum wage have little to no negative impact on jobs2 (Schmitt 2013). In fact, under current labor market conditions, where tepid consumer demand is a major factor holding businesses back from expanding their payrolls, raising the minimum wage can provide a catalyst for new hiring.
Economists generally agree that low-wage workers are more likely than any other income group to spend any additional earnings they receive, largely because they must in order to meet their basic needs. Higher-income individuals, corporations, and beneficiaries of corporate profits are more likely to save at least a portion of any additional income. Thus, in a period of depressed consumer demand, raising the minimum wage can provide a modest boost to overall economic activity because it shifts income to workers who are very likely to spend it immediately. Indeed, recent research from the Federal Reserve Bank of Chicago finds that raising the federal minimum wage to $10 could increase U.S. GDP by up to 0.3 percentage points in the near term3 (Aaronson and French 2013).
Our research shows that raising the federal minimum wage to $10.10 by 2016 would provide an additional $35 billion in wages over the phase-in period to directly and indirectly affected workers, who are likely to then spend that additional income. This projected rise in consumer spending would provide a modest boost to U.S. GDP, even after accounting for the increased labor cost to businesses and the potential for small price increases for consumers. Using standard fiscal multipliers, we would expect that increasing the federal minimum wage from $7.25 to $10.10 would generate a net increase in economic activity of $22.1 billion over the phase-in period. This additional GDP would support roughly 85,000 new jobs.4 As shown in Appendix Table 1, increasing the federal minimum wage would generate jobs in every state. (As noted previously, detailed state-level demographic information on each state’s affected workers is available at http://www.epi.org/files/2013/minimum-wage-state-tables.pdf.) Appendix Table 2 details the economic effects of each of the three incremental increases.
Conclusion
Since our original analysis of the Harkin-Miller proposal, five states—California, Connecticut, New Jersey, New York, and Rhode Island—have adopted higher state minimum wages. By 2014, 21 states plus the District of Columbia will have set minimum wages above the federal minimum of $7.25. At that point, roughly half the U.S. workforce will be in jurisdictions with minimum wages above the federal minimum. These increases in these states, along with those in several cities and counties that have also implemented higher local minimum wages, underscore the growing recognition that the federal minimum wage of $7.25 is no longer an adequate wage floor. While these recent state-level increases—particularly California’s increase to $10 in 2015—slightly alter our original estimates, our conclusion remains the same: Raising the federal minimum wage to $10.10 by 2016 would lift the incomes of millions of working families, boosting their spending power at a time when the U.S. economy is in dire need of increased consumer spending.
About the author
David Cooper joined the Economic Policy Institute in July 2011. He conducts national and state-level research on a variety of issues, including employment and unemployment, poverty, the minimum wage, and wage and income trends. He also provides support to the Economic Analysis and Research Network (EARN) on data-related inquiries and quantitative analyses. David has been interviewed and cited for his research on the minimum wage, poverty, and U.S. economic trends by local and national media, including The New York Times, The Washington Post, The Los Angeles Times, U.S. News and World Report, CNBC, and NPR. His graduate research focused on international development policy and intergenerational social mobility. He has a master’s in public policy from Georgetown University.
Endnotes
1. California’s increase is particularly noteworthy: The California state minimum wage will rise from $8 per hour today to $9 per hour in January 2014, and then to $10 per hour in January 2015. Connecticut’s minimum wage will rise to $8.40 in 2014 and $9 in 2015. New York’s minimum wage will be $8 in 2014, $8.75 in 2015, and $9 in 2016. New Jersey’s minimum wage will become $8.25 in 2014 and grow with inflation thereafter. Rhode Island’s minimum wage will be $8 beginning in 2014.
2. It should be noted that the increases proposed under the Harkin-Miller bill are indeed “modest” in size, consistent with past minimum-wage increases. The proposed increases are smaller in percentage terms than the most recent minimum-wage hike in 2007–2009, both when evaluated in nominal or real dollars. In fact, the average of the single-year increases proposed in the Harkin-Miller bill are smaller percentage increases, than the average of all previous minimum-wage increases, both in nominal and real terms. This is true even excluding the increase in 1950, when the minimum wage was raised by 87.5 percent. (See Appendix Table 3.)
3. Aaronson and French’s estimates assume negative job elasticities that they describe as “at the high end of the literature.” They also assume that low-wage employers will pass 100 percent of any increase in labor costs onto consumers. In our view, both of these assumptions are more extreme than we think warranted. Nevertheless, employing them would suggest that even under highly negative assumptions about the potential employer response, increasing the minimum wage would still have a modest positive impact on the economy in the short term.
4. This analysis assumes that a $133,000 increase in economic activity results in the creation of one new full-time-equivalent job in the current economy. Our previous analysis assumed that only $115,000 in new economic activity would generate a full-time-equivalent job. We have revised this number to reflect more recent labor market conditions. For a more detailed explanation of how increasing the minimum wage can boost GDP and employment, and our methodology for estimating these effects, see Cooper and Hall (2013).
References
Aaronson, Daniel, and Eric French. 2013. How Does a Federal Minimum Wage Hike Affect Aggregate Household Spending? Federal Reserve Bank of Chicago. http://www.chicagofed.org/webpages/publications/chicago_fed_letter/2013/august_313.cfm
American Community Survey. 2012. “Table B19119 – Median Family Income in the Past 12 Months” [generated using American Fact Finder]. U.S. Census Bureau. http://factfinder2.census.gov/faces/tableservices/jsf/pages/productview.xhtml?pid=ACS_12_1YR_B19119&prodType=table
Annie E. Casey Foundation. 2013. 2013 KIDS COUNT Data Book: State Trends in Child Well-Being. Baltimore: Annie E. Casey Foundation.
Bivens, L. Josh. 2011. Method Memo on Estimating the Jobs Impact of Various Policy Changes. Economic Policy Institute. http://www.epi.org/publications/methodology-estimating-jobs-impact/
Bureau of Labor Statistics (U.S. Department of Labor) Current Employment Statistics program. Various years. Employment, Hours and Earnings—National [database]. http://www.bls.gov/ces/#data
Bureau of Labor Statistics (U.S. Department of Labor) Labor Productivity and Costs program. Various years. Major Sector Productivity and Costs and Industry Productivity and Costs [databases]. http://www.bls.gov/lpc/#data. (Unpublished data provided by program staff at EPI’s request.)
Congressional Budget Office (CBO). 2013. The Budget and Economic Outlook: Fiscal Years 2013 to 2023. http://www.cbo.gov/publication/43907
Cooper, David, and Doug Hall. 2013. Raising the Federal Minimum Wage to $10.10 Would Give Working Families, and the Overall Economy, a Much-Needed Boost. Economic Policy Institute, Issue Brief #357. http://www.epi.org/publication/bp357-federal-minimum-wage-increase/
Current Population Survey Outgoing Rotation Group microdata. Various years. Survey conducted by the Bureau of the Census for the Bureau of Labor Statistics [machine-readable microdata file]. Washington, D.C.: U.S. Census Bureau. http://www.bls.census.gov/cps_ftp.html#cpsbasic
Mishel, Lawrence. 2013. Declining Value of the Federal Minimum Wage Is a Major Factor Driving Inequality. Economic Policy Institute, Issue Brief #351. http://www.epi.org/publication/declining-federal-minimum-wage-inequality/
Schmitt, John. 2013. Why Does the Minimum Wage Have No Discernible Effect on Employment? Center for Economic and Policy Research. http://www.cepr.net/documents/publications/min-wage-2013-02.pdf
Shierholz, Heidi. 2009. Fix It and Forget It: Index the Minimum Wage to Growth in Average Wages. Economic Policy Institute, Briefing Paper #251. http://www.epi.org/publication/bp251/
U.S. Census Bureau. 2012. “Poverty Thresholds by Size of Family and Number of Children” [Excel file]. https://www.census.gov/hhes/www/poverty/data/threshld/index.html
U.S. Department of Labor, Wages and Hours Division. 2013. “History of Federal Minimum Wage Rates Under the Fair Labor Standards Act, 1938-2009” [chart]. http://www.dol.gov/whd/minwage/chart.htm
Estimated effects of proposed federal minimum-wage increase to $10.10 by 2016, fully phased in, by state
| State | Estimated workforce1 | Directly affected2 | Indirectly affected3 | Total affected | Share of workforce affected | Increased wages for all affected workers4 | GDP impact5 | Jobs impact: Full-time employment6 |
|---|---|---|---|---|---|---|---|---|
| United States | 130,635,000 | 16,718,000 | 11,101,000 | 27,819,000 | 21.3% | $34,987,008,000 | $22,146,777,000 | 84,800 |
| Alabama | 1,936,000 | 323,000 | 139,000 | 462,000 | 23.9% | $819,951,000 | $519,029,000 | 1,900 |
| Alaska | 303,000 | 28,000 | 16,000 | 44,000 | 14.5% | $68,073,000 | $43,089,000 | 200 |
| Arizona | 2,466,000 | 331,000 | 186,000 | 517,000 | 21.0% | $677,190,000 | $428,661,000 | 1,600 |
| Arkansas | 1,113,000 | 227,000 | 88,000 | 315,000 | 28.3% | $615,085,000 | $389,349,000 | 1,400 |
| California | 14,994,000 | 94,000 | 2,614,000 | 2,708,000 | 18.1% | $458,628,000 | $290,311,000 | 2,200 |
| Colorado | 2,260,000 | 269,000 | 141,000 | 410,000 | 18.1% | $578,138,000 | $365,962,000 | 1,500 |
| Connecticut | 1,540,000 | 140,000 | 87,000 | 227,000 | 14.7% | $158,511,000 | $100,337,000 | 500 |
| Delaware | 379,000 | 55,000 | 23,000 | 78,000 | 20.6% | $112,230,000 | $71,042,000 | 200 |
| District of Columbia | 317,000 | 23,000 | 12,000 | 35,000 | 11.0% | $48,045,000 | $30,412,000 | 100 |
| Florida | 7,705,000 | 1,067,000 | 710,000 | 1,777,000 | 23.1% | $2,178,731,000 | $1,379,137,000 | 5,400 |
| Georgia | 4,038,000 | 571,000 | 340,000 | 911,000 | 22.6% | $1,371,822,000 | $868,363,000 | 2,900 |
| Hawaii | 552,000 | 59,000 | 40,000 | 99,000 | 17.9% | $127,199,000 | $80,517,000 | 300 |
| Idaho | 615,000 | 112,000 | 51,000 | 163,000 | 26.5% | $269,464,000 | $170,571,000 | 600 |
| Illinois | 5,494,000 | 733,000 | 394,000 | 1,127,000 | 20.5% | $1,359,415,000 | $860,509,000 | 3,900 |
| Indiana | 2,726,000 | 436,000 | 201,000 | 637,000 | 23.4% | $954,820,000 | $604,401,000 | 2,200 |
| Iowa | 1,423,000 | 216,000 | 90,000 | 306,000 | 21.5% | $430,462,000 | $272,483,000 | 900 |
| Kansas | 1,285,000 | 201,000 | 88,000 | 289,000 | 22.5% | $423,441,000 | $268,038,000 | 1,000 |
| Kentucky | 1,794,000 | 304,000 | 158,000 | 462,000 | 25.8% | $664,748,000 | $ 420,786,000 | 1,400 |
| Louisiana | 1,745,000 | 320,000 | 143,000 | 463,000 | 26.5% | $773,419,000 | $489,574,000 | 1,700 |
| Maine | 573,000 | 84,000 | 37,000 | 121,000 | 21.1% | $153,746,000 | $97,321,000 | 400 |
| Maryland | 2,717,000 | 306,000 | 140,000 | 446,000 | 16.4% | $677,281,000 | $428,719,000 | 1,600 |
| Massachusetts | 2,969,000 | 303,000 | 205,000 | 508,000 | 17.1% | $596,401,000 | $377,522,000 | 1,600 |
| Michigan | 3,916,000 | 641,000 | 299,000 | 940,000 | 24.0% | $1,399,338,000 | $885,781,000 | 3,300 |
| Minnesota | 2,564,000 | 321,000 | 141,000 | 462,000 | 18.0% | $614,388,000 | $388,908,000 | 1,500 |
| Mississippi | 1,082,000 | 185,000 | 95,000 | 280,000 | 25.9% | $465,334,000 | $294,557,000 | 1,000 |
| Missouri | 2,549,000 | 373,000 | 205,000 | 578,000 | 22.7% | $821,404,000 | $519,948,000 | 1,900 |
| Montana | 400,000 | 60,000 | 28,000 | 88,000 | 22.0% | $101,452,000 | $64,219,000 | 300 |
| Nebraska | 897,000 | 122,000 | 68,000 | 190,000 | 21.2% | $237,626,000 | $150,417,000 | 500 |
| Nevada | 1,155,000 | 158,000 | 104,000 | 262,000 | 22.7% | $315,847,000 | $199,931,000 | 900 |
| New Hampshire | 637,000 | 77,000 | 36,000 | 113,000 | 17.7% | $143,575,000 | $90,883,000 | 400 |
| New Jersey | 3,899,000 | 469,000 | 255,000 | 724,000 | 18.6% | $584,498,000 | $369,987,000 | 1,800 |
| New Mexico | 780,000 | 104,000 | 43,000 | 147,000 | 18.8% | $201,561,000 | $127,588,000 | 500 |
| New York | 8,137,000 | 987,000 | 582,000 | 1,569,000 | 19.3% | $1,037,532,000 | $656,758,000 | 3,100 |
| North Carolina | 3,970,000 | 735,000 | 317,000 | 1,052,000 | 26.5% | $1,664,257,000 | $1,053,474,000 | 3,700 |
| North Dakota | 344,000 | 37,000 | 23,000 | 60,000 | 17.4% | $74,536,000 | $47,181,000 | 200 |
| Ohio | 4,863,000 | 815,000 | 332,000 | 1,147,000 | 23.6% | $1,544,047,000 | $977,382,000 | 3,900 |
| Oklahoma | 1,543,000 | 256,000 | 111,000 | 367,000 | 23.8% | $561,893,000 | $355,679,000 | 1,300 |
| Oregon | 1,523,000 | 173,000 | 96,000 | 269,000 | 17.7% | $169,537,000 | $107,317,000 | 800 |
| Pennsylvania | 5,540,000 | 721,000 | 353,000 | 1,074,000 | 19.4% | $1,611,687,000 | $1,020,198,000 | 3,800 |
| Rhode Island | 469,000 | 65,000 | 26,000 | 91,000 | 19.4% | $122,847,000 | $77,763,000 | 300 |
| South Carolina | 1,873,000 | 301,000 | 148,000 | 449,000 | 24.0% | $710,820,000 | $449,948,000 | 1,600 |
| South Dakota | 363,000 | 60,000 | 31,000 | 91,000 | 25.1% | $126,350,000 | $79,979,000 | 300 |
| Tennessee | 2,624,000 | 437,000 | 198,000 | 635,000 | 24.2% | $987,829,000 | $625,296,000 | 2,100 |
| Texas | 10,927,000 | 1,945,000 | 920,000 | 2,865,000 | 26.2% | $4,977,598,000 | $3,150,819,000 | 11,000 |
| Utah | 1,231,000 | 191,000 | 80,000 | 271,000 | 22.0% | $381,270,000 | $241,343,000 | 900 |
| Vermont | 291,000 | 29,000 | 18,000 | 47,000 | 16.2% | $38,409,000 | $24,313,000 | 100 |
| Virginia | 3,657,000 | 511,000 | 233,000 | 744,000 | 20.3% | $1,261,582,000 | $798,581,000 | 2,800 |
| Washington | 2,885,000 | 188,000 | 212,000 | 400,000 | 13.9% | $150,020,000 | $94,963,000 | 700 |
| West Virginia | 689,000 | 120,000 | 48,000 | 168,000 | 24.4% | $287,648,000 | $182,081,000 | 700 |
| Wisconsin | 2,622,000 | 404,000 | 183,000 | 587,000 | 22.4% | $816,060,000 | $516,566,000 | 1,800 |
| Wyoming | 262,000 | 33,000 | 15,000 | 48,000 | 18.3% | $61,263,000 | $38,779,000 | 100 |
1The estimated workforce includes CPS respondents who were 16 years old or older, employed but not self-employed, and for whom a valid hourly wage is reported or can be imputed from weekly earnings and average weekly hours. Consequently, this estimate represents the identifiable wage-earning workforce and tends to understate the size of the full workforce.
2Directly affected workers are those whose wages would rise because the new minimum wage rate would exceed their current hourly pay.
3Indirectly affected workers have an hourly wage just above the new minimum wage (between the new minimum wage and the new minimum wage plus the dollar amount of the increase over the preceding minimum wage). They would receive a raise as employers adjusted pay scales upward to reflect the new minimum wage.
4 The total annual amount of increased wages of directly and indirectly affected workers assumes they work 52 weeks per year.
5A national model is used to estimate the GDP impact of workers' increased earnings. The total state stimulus may be lower than this estimate because workers in each state will not necessarily spend all of their increased earnings in the state. However, we can assume that most of the increased earnings will be spent in-state, and thus most of the jobs created will be in-state. GDP figures are cumulative three-year totals.
6The increased economic activity from these additional wages adds not just jobs but also hours for people who already have jobs (work hours for people with jobs also dropped in the downturn). Full-time employment estimates take that into account, essentially by taking the number of total hours added (including both hours from new jobs and more hours for people who already have jobs) and dividing by 40, to get full-time-equivalent jobs added. The estimates reflect the jobs created or sustained in the final year of the increases and assume full-time employment requires $133,000 in additional GDP.
Note: State totals may not sum to national total due to rounding. GDP and jobs impact estimation methods can be found in Cooper and Hall (2013) and Bivens (2011).
Source: Author's analysis of 2013 Harkin-Miller proposal using Current Population Survey Outgoing Rotation Group microdata from 2012Q4 through 2013Q3
Effects of proposed federal minimum-wage increase to $10.10 by 2016, 2014–2016
| Size of increase | Estimated workforce1 | Directly affected2 | Indirectly affected3 | Total affected | Share of workforce affected | Increased wages for all affected workers4 | GDP impact5 | Jobs impact: Full-time employment6 | Three-year total: Job years | |
|---|---|---|---|---|---|---|---|---|---|---|
| Three-stage increase to $10.10/hour, modeled for July 2014, July 2015, and July 2016 | ||||||||||
| 2014: $8.20 | $0.95 | 128,637,000 | 7,023,000 | 2,670,000 | 9,693,000 | 7.5% | $4,912,718,000 | $3,109,750,000 | 23,400 | |
| 2015: $9.15 | $0.95 | 129,632,000 | 11,084,000 | 6,533,000 | 17,617,000 | 13.6% | $12,258,570,000 | $7,759,675,000 | 58,300 | |
| 2016: $10.10 | $0.95 | 130,635,000 | 16,718,000 | 11,101,000 | 27,819,000 | 21.3% | $17,815,720,000 | $11,277,351,000 | 84,800 | |
| Cumulative totals: | 27,819,000 | $34,987,008,000 | $22,146,776,000 | 84,800 | 166,500 | |||||
1The estimated workforce includes CPS respondents who were 16 years old or older, employed but not self-employed, and for whom a valid hourly wage is reported or can be imputed from weekly earnings and average weekly hours. Consequently, this estimate represents the identifiable wage-earning workforce and tends to understate the size of the full workforce.
2Directly affected workers are those whose wages would rise because the new minimum wage rate would exceed their current hourly pay.
3Indirectly affected workers have an hourly wage just above the new minimum wage (between the new minimum wage and the new minimum wage plus the dollar amount of the increase over the preceding minimum wage). They would receive a raise as employers adjusted pay scales upward to reflect the new minimum wage.
4 The total annual amount of increased wages of directly and indirectly affected workers assumes they work 52 weeks per year.
5A national model is used to estimate the GDP impact of workers' increased earnings. Estimations rely upon multipliers applicable to current economic conditions and periods of labor market slack.
6The increased economic activity from these additional wages adds not just jobs but also hours for people who already have jobs (work hours for people with jobs also dropped in the downturn). Full-time employment estimates take that into account, essentially by taking the number of total hours added (including both hours from new jobs and more hours for people who already have jobs) and dividing by 40, to get full-time-equivalent jobs added. The estimates reflect the jobs created or sustained in each year of the increases and assume full-time employment requires $133,000 in additional GDP.
Note: All estimates assume an annual population growth of 0.77 percent (U.S. projected average annual rate from 2014 to 2019, according to U.S. Census Bureau) and wage growth of 1.8 percent in the first year (U.S. average of the bottom 20 percent of wage earners in 2012) and 2.8 percent in the second and third years (U.S. annual average of the bottom 20 percent of wage earners from 2002 to 2006, according to CPS-ORG). Job-impact estimation methods can be found in Cooper and Hall (2013) and Bivens (2011).
Source: Author's analysis of Harkin-Miller proposal using Current Population Survey Outgoing Rotation Group public use microdata from 2012Q4 through 2013Q3
Historical increases in the federal minimum wage, and proposed increase to $10.10 by 2016, current-year and real 2013 dollars
| Nominal minimum wage | Nominal increase | Percentage increase | Real minimum wage (2013$) | Real increase (2013$) | Percentage increase | |
|---|---|---|---|---|---|---|
| 1938 | $0.25 | – | – | $3.61 | – | – |
| 1939 | $0.30 | $0.05 | 20.0% | $4.40 | $0.79 | 21.7% |
| 1945 | $0.40 | $0.10 | 33.3% | $4.53 | $1.06 | 30.4% |
| 1950 | $0.75 | $0.35 | 87.5% | $6.34 | $2.92 | 85.2% |
| 1956 | $1.00 | $0.25 | 33.3% | $7.49 | $1.79 | 31.4% |
| 1961 | $1.15 | $0.15 | 15.0% | $7.84 | $0.95 | 13.8% |
| 1963 | $1.25 | $0.10 | 8.7% | $8.33 | $0.56 | 7.3% |
| 1967 | $1.40 | $0.15 | 12.0% | $8.54 | $0.68 | 8.6% |
| 1968 | $1.60 | $0.20 | 14.3% | $9.40 | $0.86 | 10.0% |
| 1974 | $2.00 | $0.40 | 25.0% | $8.54 | $1.03 | 13.7% |
| 1975 | $2.10 | $0.10 | 5.0% | $8.28 | $(0.26) | -3.0% |
| 1976 | $2.30 | $0.20 | 9.5% | $8.58 | $0.30 | 3.6% |
| 1978 | $2.65 | $0.35 | 15.2% | $8.70 | $0.64 | 7.9% |
| 1979 | $2.90 | $0.25 | 9.4% | $8.68 | $(0.01) | -0.1% |
| 1980 | $3.10 | $0.20 | 6.9% | $8.36 | $(0.33) | -3.8% |
| 1981 | $3.35 | $0.25 | 8.1% | $8.24 | $(0.11) | -1.3% |
| 1990 | $3.80 | $0.45 | 13.4% | $6.57 | $0.49 | 8.0% |
| 1991 | $4.25 | $0.45 | 11.8% | $7.10 | $0.52 | 8.0% |
| 1996 | $4.75 | $0.50 | 11.8% | $7.03 | $0.57 | 8.9% |
| 1997 | $5.15 | $0.40 | 8.4% | $7.46 | $0.43 | 6.1% |
| 2007 | $5.85 | $0.70 | 13.6% | $6.58 | $0.62 | 10.5% |
| 2008 | $6.55 | $0.70 | 12.0% | $7.10 | $0.51 | 7.8% |
| 2009 | $7.25 | $0.70 | 10.7% | $7.89 | $0.79 | 11.1% |
| Sum 2007–2009: | 36.2% | 29.4% | ||||
| Average 2007–2009: | 12.1% | 9.8% | ||||
| Average of all increases: | 17.5% | 13.0% | ||||
| Average (excluding 1950): | 14.2% | 9.6% | ||||
Harkin-Miller proposal |
||||||
| 2014 | $8.20 | $0.95 | 13.1% | $8.05 | $0.80 | 11.0% |
| 2015 | $9.15 | $0.95 | 11.6% | $8.79 | $0.75 | 9.3% |
| 2016 | $10.10 | $0.95 | 10.4% | $9.51 | $0.71 | 8.1% |
| Sum: | 35.1% | 28.4% | ||||
| Average: | 11.7% | 9.5% | ||||
Note: The 1950 minimum-wage increase was particularly large. Nevertheless, the proposed increases are still smaller than the historical average even if the 1950 increase is excluded as an outlier. Real values are deflated using the CPI-U-RS. Inflation projections come from CBO (2013).
Source: Author's analysis of Fair Labor Standards Act and amendments and Harkin-Miller proposal