The Economic Policy Institute runs a series that estimates unemployment rates disaggregated by race and ethnicity at the state level on a quarterly basis.1 We developed this series in the absence of published government data providing unemployment rates by demographic group at the state level on a timely basis. This technical report details our new methodology for this series, which addresses a number of limitations with our previous methodology.
In both the new and previous methodologies, we construct unemployment rates by race and ethnicity at the state level on a quarterly basis with data from the Local Area Unemployment Statistics (LAUS) and the Current Population Survey (CPS). LAUS provides timely unemployment rate estimates at the state level but contains no demographic data. While the CPS does contain demographic data and is updated monthly, sample size volatility and seasonality of the data can obfuscate quarter-to-quarter unemployment trends.
While this fundamental structure remains, we have revamped our methodology to provide more consistent and reliable estimates for state-level unemployment rates, specifically for Asian American and Pacific Islander (AAPI), Black, and Hispanic workers. This technical report begins with an outline of the prior methodology and then provides a detailed explanation of the new methodology with examples throughout.
Data sources
Our quarterly state unemployment estimates by race and ethnicity use two sources of data, the CPS basic and LAUS. Details about these two surveys and how we currently use them are outlined below.
Current Population Survey
The CPS is a monthly household survey prepared by the U.S. Census Bureau for the Bureau of Labor Statistics (BLS). The sampling framework of the CPS is a “rolling panel,” in which approximately 60,000 probability-selected households are surveyed for four consecutive months, out for eight months, and then surveyed again for four additional months. The basic files provide labor force data on CPS respondents, in addition to measures of work activity, income, and other economic indicators. We analyze microdata files that contain a full year’s worth of basic monthly CPS data (BLS-CPS 2022a).
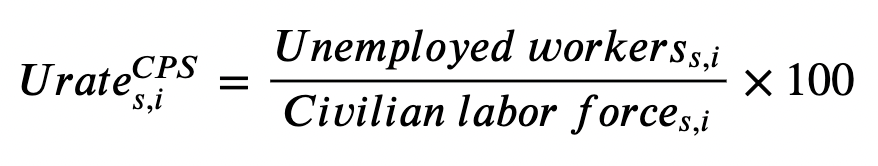
Our sample includes all workers ages 16+ who are in the labor force. This pool includes employed and unemployed workers. Workers who are retired, disabled, or not in the labor force for other reasons are excluded from the analysis. For those who meet these criteria, the unemployment rate is calculated as the unemployed share of the overall civilian labor force, i.e.,

Local Area Unemployment Statistics
Local Area Unemployment Statistics data are monthly labor force statistics produced from a nonsurvey methodology developed by the Bureau of Labor Statistics. LAUS state unemployment estimates are produced using CPS basic monthly data as a primary input, supplemented by payroll employment estimates from the Current Employment Statistics (CES) survey and unemployment insurance claims data from state agencies. As a result, LAUS and CPS labor force statistics track relatively closely. These inputs are fed into a signal-plus-noise model that is forced to sum to the national not-seasonally-adjusted unemployment estimates from the CPS. (See more detail at BLS 2022b.) State unemployment rates from LAUS are monthly data, which we then aggregate into quarterly data by taking the three-month quarterly average.
Overview of previous methodology
We begin by reviewing the main aspects of our previous methodology and the impetus for building a new one.
The motivation for combining CPS and LAUS data is that LAUS does not report demographic breakdowns of local area unemployment estimates, whereas the CPS state-level unemployment rate estimates are often afflicted by seasonality or sample size volatility.
Accordingly, we first calculated unemployment rates in each state for AAPI, Black, Hispanic, and white workers in the CPS, using LAUS as a benchmark, as follows:
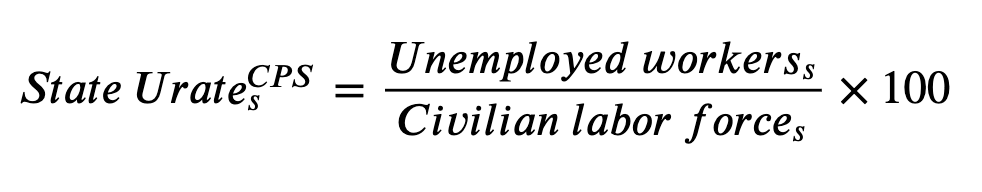
Where ![]() is the estimated unemployment rate calculated by dividing unemployed workers by the total civilian labor force, i is an indicator for demographic group, and s is an indicator for state. We then calculated the statewide unemployment rate in each state using the most recent six months of pooled CPS data.
is the estimated unemployment rate calculated by dividing unemployed workers by the total civilian labor force, i is an indicator for demographic group, and s is an indicator for state. We then calculated the statewide unemployment rate in each state using the most recent six months of pooled CPS data.
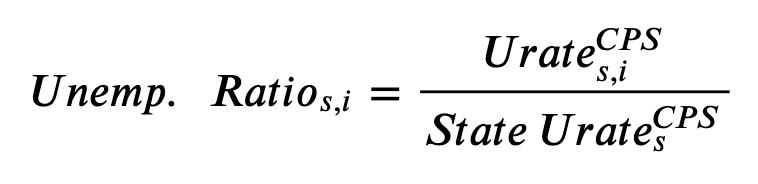
Next, using these demographic group and statewide unemployment rates, we produce a ratio for each demographic groups relative to the overall state unemployment rates using the same period of CPS data like so:
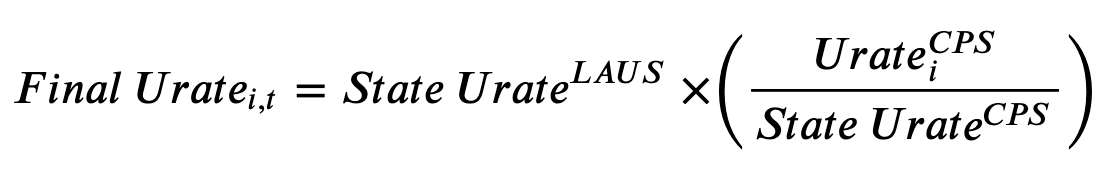
Lastly, we produce a final unemployment rate for each demographic group by multiplying the LAUS three-month average state unemployment rate and the CPS unemployment ratio for each respective group as shown below:
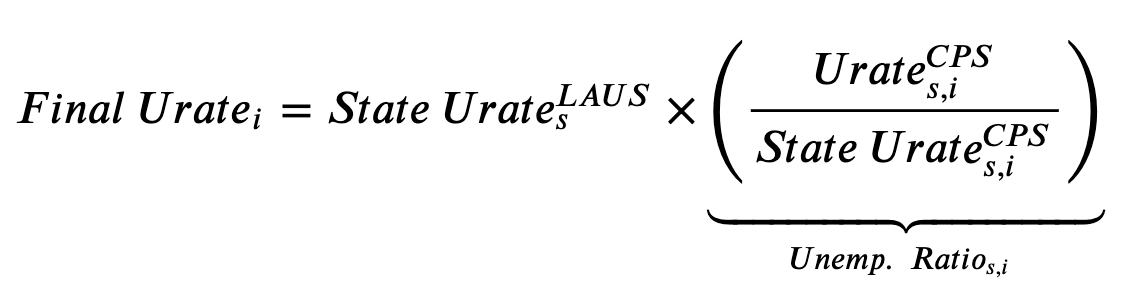
Here, ![]() is the final estimated unemployment rate for group i reported on a quarterly basis.
is the final estimated unemployment rate for group i reported on a quarterly basis.
This provided us with an estimate of how the demographic group unemployment rates compared with the state’s overall unemployment rate. For example, Black workers in California in 2009Q1 had an unemployment rate that was about 1.6 times as high as the overall state unemployment rate according to the preceding six months of CPS data. We then take this ratio and multiply it by the LAUS unemployment rate for that state found by averaging the latest three months of monthly LAUS data. Given the LAUS rate of 10.6% in California, and the 1.6 ratio found earlier, we estimate that Black workers had an unemployment rate of 16.5% for 2009Q1.
In this previous methodology, for many states, the sample size of some demographic groups within the CPS was not large enough to create a reliable estimate of their unemployment rate. We reported data for groups that had, on average, a sample size of at least 700 in the labor force for each six-month period. Assuming an unemployment rate of 8%, this resulted in a 95% margin of error of 2 percentage points. With an unemployment rate of 20%, the 95% margin of error was 3 percentage points.
The crucial pitfalls of this previous methodology included inconsistent availability of unemployment rates for demographic groups from quarter to quarter and a higher degree of variability in six-month CPS demographic group unemployment rate estimates. These and other issues and the steps taken to address them within our new methodology are discussed below.
New methodology
Our new methodology seeks to address a number of issues with our previous approach and to meet goals to report statistics for more demographic groups. Our methodological revamp has the following three overarching goals:
- Report unemployment rates in more states for AAPI, Black, and Hispanic workers;
- More consistently produce estimates for the selected race/ethnicity groups from one quarter to the next;
- Have our reported unemployment rates meet a standardized level of precision.
Our new methodology shares some broad commonalities with our previous methodology. As detailed below, we still use data from LAUS and the CPS. We also calculate ratios in the CPS data that are obtained by estimating unemployment rates by race and ethnicity and comparing them with statewide (or national-level) unemployment rates. We then multiply these ratios to current state-level unemployment rates from LAUS to obtain a final quarterly unemployment rate for a given race/ethnicity group in a specific state. While this broader structure remains, we make a number of critical changes.
We begin by expanding the amount of CPS data used to construct our ratios from six months to a full year of data. This increases our sample sizes for race/ethnicity groups at the state level and reduces volatility previously driven by seasonality.
We also construct a tiered scheme in which our ratios calculated from the CPS are weighted averages that utilize the ratio of the unemployment rate for a specific race/ethnicity group to the corresponding economywide unemployment rate at both the national level and the state level. The national race/ethnicity-specific unemployment rate ratios help stabilize our final ratios in places where using only state-level data for a demographic group results in a lot of data volatility. The higher the volatility of racialized data in a state, the bigger the weight given to the national-level ratio for that group. Our new weighted ratios are then multiplied with the statewide unemployment rate as measured by averaging the latest three months of LAUS data to produce a final quarterly unemployment rate estimate for a demographic group in that state.
This scheme of leveraging national-level ratios, unlike our previous methodology, allows us to estimate an unemployment rate for each of our race/ethnicity groups of concern (AAPI, Black, and Hispanic workers) in each state for every quarter. For white workers, no weight is given to their national-level ratio, i.e., all estimates for white workers are based solely on state-level data. This is because we apply the same approach to white workers and their sample sizes meet our criteria for using only state-level data in every state.
The remainder of this methodology paper details some specifics about our data sources, the new methodological steps previewed here and how we arrived at them, and the weight given to national-level ratios for each of our demographic groups. We conclude with some summary points about the new methodology.
Using 12 months of CPS data
We now turn to detailing the primary methodological changes we have made. In an effort to better understand data volatility and assess the performance of new proposals, we sample 10 years of quarterly data (2012Q2–2022Q1), as well as a longer period of more than three decades from 1989Q4 through 2022Q1. The decades-long data are used primarily to assess how the main methodological changes affect resulting estimates relative to the previous methodology across multiple recessionary periods. The changes detailed in this and subsequent sections are informed by these analyses.
Our first main methodological change is to use 12 months of CPS data instead of six months. This change was prompted by analysis showing that most of the variation in the final unemployment rate for a group in our previous methodology is driven by calculations done in the CPS data. Specifically, much of the variation is driven by changes in the unemployment rate for a given race/ethnicity group calculated in the CPS. This in turn drives changes in the ratio of the demographic group unemployment rate to the statewide employment rate calculated in the CPS. The resulting ratio is then applied to the quarterly LAUS data. To see this, we can write the final demographic group unemployment rate into decomposable parts as follows:
Here,
 is the statewide unemployment rate calculated by averaging the latest three months of LAUS monthly state-level unemployment rates;
 is the estimated unemployment rate for demographic group i calculated using CPS data;
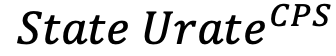 is the statewide unemployment rate using CPS data; and
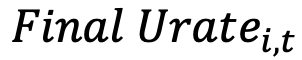 is the final estimated unemployment rate for group i reported for quarter t.
The parenthetical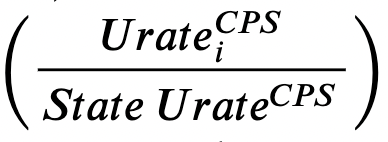
is the ratio of the race/ethnicity-specific unemployment rate to the overall state unemployment rate.
Outside of periods of economic crises, the LAUS unemployment rate for a given state ![]() changes little from one quarter to the next. The same is true for the statewide unemployment rates calculated in the CPS
changes little from one quarter to the next. The same is true for the statewide unemployment rates calculated in the CPS ![]() , though to a lesser extent. Hence, what tends to drive fluctuations in the ratios is the numerator,
, though to a lesser extent. Hence, what tends to drive fluctuations in the ratios is the numerator,![]() , and the ratios then in turn drive most of the variation in the final Urate for a given group.
, and the ratios then in turn drive most of the variation in the final Urate for a given group.
Using a full year of CPS data increases sample sizes and reduces noise previously being driven by seasonality and volatility from smaller sample sizes. Looking across our surveyed period of 1989–2022, using 12 months of CPS data results in smoother final unemployment rate estimates and less volatile ratios. These comparisons reveal that when six months of CPS data are used, the demographic group unemployment rates calculated using CPS data, the CPS-based ratios, and the resulting final unemployment rates for a demographic group are particularly noisy in many instances. Furthermore, using 12 months of CPS data results in more states meeting one of our criteria for assessing volatility discussed below, namely quarterly estimates meeting a coefficient of variation of 0.15.
Building a coefficient of variation–based benchmark
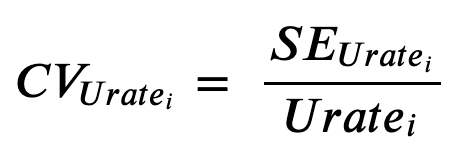
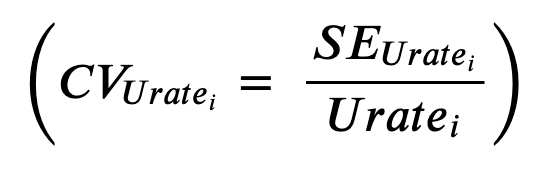
Another main methodological change we make is to use coefficient of variation (CV) to set a benchmark for assessing estimate volatility. This replaces the previous step of using 700 observations as the cutoff point to determine whether to report or suppress the estimated unemployment rate for any race/ethnicity group. The coefficient of variation of a statistic is calculated by dividing the standard error (SE) by the mean value of a variable.
The primary strength of moving to using CVs is that we will be taking into account the actual unemployment rates in question for a given demographic group. Furthermore, we will have a better sense of error rather than a flat threshold uniformly applied to demographic groups with vastly different unemployment rates.
The formula for the calculation of the coefficient of variation for the estimated unemployment rate (Urate) for a group is as follows:
 Here,
Here, ![]() is the estimated unemployment rate for group i and
is the estimated unemployment rate for group i and ![]() is the estimated standard error (SE) for that calculated Urate.
is the estimated standard error (SE) for that calculated Urate.
The standard error is calculated as follows:
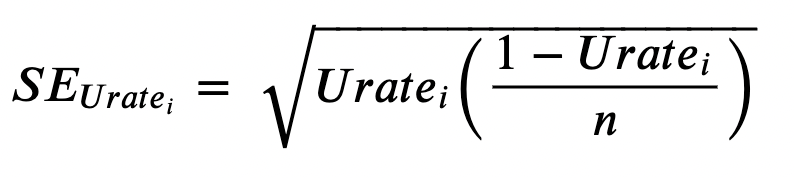
Here, n is the sample size of group i within the CPS data and, as noted above, ![]() is the estimated unemployment rate for group i.
is the estimated unemployment rate for group i.
Building a benchmark criterion using coefficient of variation
Our use of coefficient of variation is multifold. First, we use a CV of 0.15 as a benchmark for the level of error for an unemployment rate estimate that best meets our overarching goals. We complete analysis (not detailed here) to see which combination of state and race/ethnicity groups generates estimates that meet various CV benchmarks over a 10-year period. This analysis shows that a CV benchmark of 0.15 is restrictive enough to maintain consistency in the select states that regularly meet it for a specific race/ethnicity group, yet lax enough to allow reporting for more groups. A CV threshold of 0.15 says that the standard error for an estimated unemployment rate is no more than 15% of the estimate.
We create a tiered system for incorporating national data into estimating quarterly state unemployment rates by race/ethnicity by building upon a CV of 0.15 benchmark. Our primary goal is to stabilize state-level estimates by utilizing national-level data to various extents depending on how volatile estimates are for a specific race/ethnicity group in a given state within CPS data. We do this via the ratio of the race/ethnicity-specific unemployment rate to the overall state unemployment rate calculated in the CPS data. As noted earlier, this ratio is applied to the three months of averaged statewide unemployment rates from LAUS to obtain the final quarterly unemployment rate reported for a race/ethnicity group.
Recall from the discussion above—about why we switched to using 12 months of CPS data—that most of the variation in our final estimates is driven by these ratios. In states where members of a certain demographic group are not well represented in the CPS data, these ratios can be quite volatile. While we want to reduce noise from these data, we simultaneously want to maintain useful information about the variation of labor market conditions faced by racialized groups in each state. To satisfy these twin goals, we formulate a layered scheme of utilizing weighted ratios that incorporate both national and state-level data. In states where the ratio for a certain demographic group is particularly noisy over our surveyed periods, we give a higher weight to the national-level ratio for that demographic group.
To construct the tiers, we turn to insights from surveyed data. For each race/ethnicity group in each of the 50 states and the District of Columbia, we calculate the median unemployment rate and sample size on a quarterly basis across three years (2019Q2–2022Q1). We use median values to dampen the effects of any outlier sample sizes and unemployment rate estimates, especially since our examined period includes the height of the COVID-19 pandemic. We focus on a shorter period of time to get these median values to accurately capture recent demographic trends for some race/ethnicity groups across states. Note that for each quarter, the sample size is the number of observations for a specific demographic group who were in the labor force in the past 12 months of CPS monthly data at the state level. As a reminder, these quarterly unemployment rates for a demographic group are calculated by multiplying the LAUS unemployment rate for a state (calculated by averaging the latest three months of monthly LAUS data) by the ratio of that group’s unemployment rate for the past 12 months (as calculated in the CPS) to the statewide unemployment rate calculated over the same period.
In the first step of constructing the estimation tiers, we use the median unemployment rate for each demographic group at the state level over the three-year period to calculate the minimum sample size needed for the estimate to meet a CV of 0.15. Using the formulas for standard error and coefficient of variation detailed above, we can substitute and rearrange to obtain the following expression:
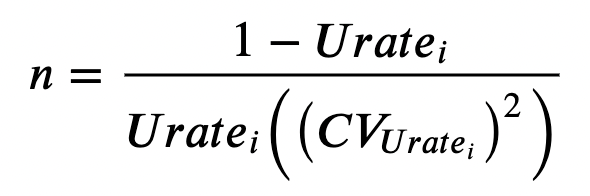
Examples of marginal sample sizes needed to meet a CV of 0.15
To elaborate on the marginal sample size formula above, Table 1 lists, for different unemployment rates, the minimum sample sizes they would need to meet a CV of 0.15. For example, for an unemployment rate of 5%, the sample size for a demographic group needs to be at least 844 for that estimate to have a CV of no more than 0.15. An unemployment rate estimate of 5% with a sample size of 844 has a standard error of approximately 0.008. Mechanically, a higher unemployment rate has a bigger effect on the denominator of the CV equation
than on its numerator via the standard error formula
![]()
Thus, the higher the unemployment rate, the smaller the corresponding sample size needed to meet a CV of 0.15.
Scenarios of different unemployment rates and the corresponding minimum sample size needed to marginally meet a coefficient of variation of 0.15, with their accompanying standard errors
| Unemployment rate | Sample size | Standard error |
|---|---|---|
| 2% | 2,178 | 0.003 |
| 4% | 1,067 | 0.006 |
| 5% | 844 | 0.008 |
| 6% | 696 | 0.009 |
| 8% | 511 | 0.012 |
| 10% | 400 | 0.015 |
| 12% | 326 | 0.018 |
| 14% | 273 | 0.021 |
| 15% | 252 | 0.023 |
| 16% | 233 | 0.024 |
| 18% | 202 | 0.027 |
| 20% | 178 | 0.030 |

Building a tiered sample size benchmark and utilizing national-level data
Next, we set a sample size threshold that is twice the calculated sample size needed to marginally meet a CV of 0.15 for each of the median unemployment rates. Then we express the median sample size calculated from the three years of quarterly data as a share of this sample size threshold. The weight given to the national-level ratio for a demographic group is based on how far away the state-level median sample size during the examined period (2019Q2–2022Q1) is from the benchmark sample size for the median unemployment rate for that demographic group during that same period.
We use a sample size benchmark that is twice the marginal sample size to meet a CV of 0.15 for a number of reasons. First, the comparison data we use for each race/ethnicity and state combination are medians over a surveyed period. We know that half the time, the sample size and quarterly unemployment rates are below their median values. Recall from Table 1 above that the smaller an unemployment rate, the higher the sample size needed to meet a CV of 0.15. We want to leave room for these instances. Second, estimates for demographic groups that always only marginally meet the CV threshold tend to have noisier ratios across time. This is the case even in big states and even when the sample sizes would otherwise seem reasonably high. While using national-level data to various degrees helps stabilize the group-specific ratios, the final step in our calculations of multiplying the ratios with quarterly LAUS data helps incorporate more state specificities and variation in our final estimates.
Table 2 details the exact mixtures used for the given ranges. In instances where the state-level median sample size for a demographic group meets or exceeds the benchmark sample size number, the ratio used is fully based on state-level data and gives no weight to the national-level ratio for the demographic group in question. At the other extreme, if the median sample size is less than 30% of the benchmark, the national-level ratio is used alone and no weight is given to the state-level ratio. For the cases in between, the weight given to the national ratio increases as the median sample size falls further below the benchmark.
Criteria for the weight given to national-level ratios
| Median sample size as share of benchmark | Weight of state-level ratio | Weight of national-level ratio |
|---|---|---|
| Share ≥ 1.00 | 1 | 0 |
| 0.80 ≤ share < 1.00 | 0.8 | 0.2 |
| 0.60 ≤ share < 0.80 | 0.6 | 0.4 |
| 0.50 ≤ share < 0.60 | 0.4 | 0.6 |
| 0.40 ≤ share < 0.50 | 0.3 | 0.7 |
| 0.30 ≤ share < 0.40 | 0.2 | 0.8 |
| Share < 0.30 | 0 | 1 |
Examples of sample size benchmarks by race/ethnicity and state
To make the description more concrete, Table 3 details the information needed to determine the mix of national- and state-level data used to construct a ratio for AAPI, Black, and Hispanic workers in a select number of states. We focus on these three demographic groups since the sample size for white workers in every state meets our criteria for utilizing only state-level data. The general trend is that the smaller the unemployment rate used to evaluate, the bigger the sample size benchmark.
For example, for AAPI workers in Massachusetts, the median estimated sample size is 1,190 during the examined three-year period, and the median quarterly unemployment rate is 5.8%. Each of the quarterly unemployment rates was obtained by first calculating the ratio of the estimated unemployment rate for AAPI workers in Massachusetts to the statewide unemployment rate using 12 months of CPS data. That ratio was applied to the quarterly unemployment rate for Massachusetts, calculated by averaging the latest three months of monthly LAUS unemployment rate estimates. The sample size benchmark is twice the marginal sample size needed to meet a 0.15 CV threshold. For an unemployment rate of 5.8%, this comes out to a sample size benchmark of 1,447. Because the median sample size for AAPI workers in Massachusetts was about 82% of this benchmark, our estimates for AAPI workers in Massachusetts will now be based on a weighted ratio that gives a weight of 0.2 to the national ratio for AAPI workers and 0.8 to the state-level ratio.
Because Black workers tend to have higher unemployment rates, their benchmark sample sizes are generally lower. For example, for Black workers in Kentucky, the median quarterly unemployment rate of 8.4% corresponds to a sample size benchmark of 968. With a median sample size that came out to 60% of this benchmark, we will now give a weight of 0.4 to the national Black ratio when calculating the unemployment rate for Black workers in Kentucky. Hispanic workers generally have unemployment rates in between those for AAPI and Black workers, and so the benchmark sample sizes needed for their corresponding median unemployment rates generally also fall in between.
Examples of sample benchmarks and corresponding weight given to national-level ratio by race/ethnicity and state
| Race/ethnicity group | State | Median sample size (2019Q2–2022Q1) | Median quarterly unemployment rate (2019Q2–2022Q1) | Sample size benchmark |
Median sample size as share of benchmark |
Weight of national-level ratio |
|---|---|---|---|---|---|---|
| AAPI workers | New York | 2,384 | 6.5% | 1,270 | 1.88 | 0 |
| AAPI workers | Massachusetts | 1,190 | 5.8% | 1,447 | 0.82 | 0.2 |
| AAPI workers | Washington | 1,484 | 4.2% | 2,010 | 0.74 | 0.4 |
| AAPI workers | Alaska | 779 | 5.3% | 1,582 | 0.49 | 0.6 |
| AAPI workers | Florida | 1,025 | 3.5% | 2,442 | 0.42 | 0.7 |
| AAPI workers | Arizona | 530 | 4.9% | 1,709 | 0.31 | 0.8 |
| AAPI workers | South Dakota | 172 | 1.2% | 7,153 | 0.02 | 1 |
| Black workers | Massachusetts | 1,107 | 7.5% | 1,098 | 1.01 | 0 |
| Black workers | Indiana | 935 | 7.1% | 1,166 | 0.80 | 0.2 |
| Black workers | Kentucky | 585 | 8.4% | 968 | 0.60 | 0.4 |
| Black workers | Arizona | 516 | 6.8% | 1,215 | 0.42 | 0.7 |
| Black workers | Kansas | 420 | 6.0% | 1,386 | 0.30 | 0.8 |
| Black workers | Utah | 122 | 5.2% | 1,626 | 0.08 | 1 |
| Hispanic workers | North Carolina | 1,495 | 5.8% | 1,448 | 1.03 | 0 |
| Hispanic workers | Connecticut | 960 | 6.9% | 1,208 | 0.79 | 0.2 |
| Hispanic workers | Wyoming | 788 | 6.4% | 1,297 | 0.61 | 0.4 |
| Hispanic workers | Virginia | 1,229 | 3.7% | 2,299 | 0.53 | 0.6 |
| Hispanic workers | Kansas | 1,021 | 3.3% | 2,608 | 0.39 | 0.7 |
| Hispanic workers | Delaware | 558 | 4.6% | 1,835 | 0.30 | 0.8 |
| Hispanic workers | Vermont | 110 | 3.5% | 2,445 | 0.04 | 1 |
Note: AAPI stands for Asian American and Pacific Islander.
Source: EPI analysis of Bureau of Labor Statistics Local Area Unemployment Statistics (LAUS) data and Current Population Survey (CPS) data.
Affixing weight given to national-level ratios by race/ethnicity and state
The insights from the analysis described above lead us to affix the weighted composition of state- and national-level data to construct ratios for each of our race and ethnicity groups of concern, i.e., AAPI, Black, and Hispanic, at the state level. We detail the weight of national-level data assigned to each race and ethnicity group in Table 4 and Figure A. Weights for state-level ratios can be deduced by subtracting 1 minus the weight of the national-level ratios. (The ratios for white workers will be fully based on state-level data calculated within the CPS. As previously noted, the sample sizes for white workers in every state meet our criteria for using only state-level data.)
Thus, for each state, our new calculation for quarterly unemployment rates by race/ethnicity uses a ratio that is a weighted sum of the state-level calculated ratio and the national ratio for the race/ethnicity group in question. The weight given to national and state-specific ratios will remain constant across quarters. This scheme allows us to report a state unemployment rate for each of our race/ethnicity groups for every quarter.
Weight given to national-level ratio for each race/ethnicity group by state
| State | AAPI workers | Black workers | Hispanic workers | White workers |
|---|---|---|---|---|
| Alabama | 1 | 0 | 1 | 0 |
| Alaska | 0.6 | 1 | 0.8 | 0 |
| Arizona | 0.8 | 0.7 | 0 | 0 |
| Arkansas | 1 | 0.2 | 0.8 | 0 |
| California | 0 | 0 | 0 | 0 |
| Colorado | 1 | 0.8 | 0 | 0 |
| Connecticut | 1 | 0.7 | 0.2 | 0 |
| Delaware | 1 | 0 | 0.8 | 0 |
| District of Columbia | 1 | 0 | 0.2 | 0 |
| Florida | 0.7 | 0 | 0 | 0 |
| Georgia | 1 | 0 | 0.7 | 0 |
| Hawaii | 0 | 1 | 0.7 | 0 |
| Idaho | 1 | 1 | 0.4 | 0 |
| Illinois | 0.6 | 0 | 0 | 0 |
| Indiana | 1 | 0.2 | 0.8 | 0 |
| Iowa | 1 | 0.8 | 0.8 | 0 |
| Kansas | 1 | 0.8 | 0.7 | 0 |
| Kentucky | 1 | 0.4 | 1 | 0 |
| Louisiana | 1 | 0 | 0.6 | 0 |
| Maine | 1 | 1 | 1 | 0 |
| Maryland | 0.8 | 0 | 0.7 | 0 |
| Massachusetts | 0.2 | 0 | 0 | 0 |
| Michigan | 1 | 0 | 0.6 | 0 |
| Minnesota | 1 | 0.8 | 1 | 0 |
| Mississippi | 1 | 0 | 1 | 0 |
| Missouri | 1 | 0.2 | 1 | 0 |
| Montana | 1 | 1 | 1 | 0 |
| Nebraska | 1 | 1 | 0.7 | 0 |
| Nevada | 0.4 | 0 | 0 | 0 |
| New Hampshire | 1 | 1 | 1 | 0 |
| New Jersey | 0.2 | 0 | 0 | 0 |
| New Mexico | 1 | 0.8 | 0 | 0 |
| New York | 0 | 0 | 0 | 0 |
| North Carolina | 1 | 0 | 0 | 0 |
| North Dakota | 1 | 0.8 | 1 | 0 |
| Ohio | 1 | 0 | 0.7 | 0 |
| Oklahoma | 1 | 0.7 | 0.6 | 0 |
| Oregon | 0.8 | 1 | 0.2 | 0 |
| Pennsylvania | 1 | 0 | 0 | 0 |
| Rhode Island | 1 | 1 | 0.4 | 0 |
| South Carolina | 1 | 0 | 1 | 0 |
| South Dakota | 1 | 1 | 1 | 0 |
| Tennessee | 1 | 0 | 0.7 | 0 |
| Texas | 0.2 | 0 | 0 | 0 |
| Utah | 1 | 1 | 0.6 | 0 |
| Vermont | 1 | 1 | 1 | 0 |
| Virginia | 0.8 | 0 | 0.6 | 0 |
| Washington | 0.4 | 0.8 | 0 | 0 |
| West Virginia | 1 | 0.7 | 1 | 0 |
| Wisconsin | 1 | 0.7 | 0.8 | 0 |
| Wyoming | 1 | 1 | 0.4 | 0 |
Notes: AAPI stands for Asian American and Pacific Islander. Boldfaced values indicate a national-level ratio of 0.5 or higher. As described in the technical methodology, the national-level ratio is given greater weight in the final unemployment rate calculation when the unemployment rate for a particular race/ethnicity group within a specific state as calculated in the CPS is more volatile based on our sample size benchmark criteria.
Weight given to national-level ratio for each race/ethnicity group by state
| State | AAPI workers | Black workers | Hispanic workers | White workers |
|---|---|---|---|---|
| Alabama | 1 | 0 | 1 | 0 |
| Alaska | 0.6 | 1 | 0.8 | 0 |
| Arizona | 0.8 | 0.7 | 0 | 0 |
| Arkansas | 1 | 0.2 | 0.8 | 0 |
| California | 0 | 0 | 0 | 0 |
| Colorado | 1 | 0.8 | 0 | 0 |
| Connecticut | 1 | 0.7 | 0.2 | 0 |
| Delaware | 1 | 0 | 0.8 | 0 |
| Washington D.C. | 1 | 0 | 0.2 | 0 |
| Florida | 0.7 | 0 | 0 | 0 |
| Georgia | 1 | 0 | 0.7 | 0 |
| Hawaii | 0 | 1 | 0.7 | 0 |
| Idaho | 1 | 1 | 0.4 | 0 |
| Illinois | 0.6 | 0 | 0 | 0 |
| Indiana | 1 | 0.2 | 0.8 | 0 |
| Iowa | 1 | 0.8 | 0.8 | 0 |
| Kansas | 1 | 0.8 | 0.7 | 0 |
| Kentucky | 1 | 0.4 | 1 | 0 |
| Louisiana | 1 | 0 | 0.6 | 0 |
| Maine | 1 | 1 | 1 | 0 |
| Maryland | 0.8 | 0 | 0.7 | 0 |
| Massachusetts | 0.2 | 0 | 0 | 0 |
| Michigan | 1 | 0 | 0.6 | 0 |
| Minnesota | 1 | 0.8 | 1 | 0 |
| Mississippi | 1 | 0 | 1 | 0 |
| Missouri | 1 | 0.2 | 1 | 0 |
| Montana | 1 | 1 | 1 | 0 |
| Nebraska | 1 | 1 | 0.7 | 0 |
| Nevada | 0.4 | 0 | 0 | 0 |
| New Hampshire | 1 | 1 | 1 | 0 |
| New Jersey | 0.2 | 0 | 0 | 0 |
| New Mexico | 1 | 0.8 | 0 | 0 |
| New York | 0 | 0 | 0 | 0 |
| North Carolina | 1 | 0 | 0 | 0 |
| North Dakota | 1 | 0.8 | 1 | 0 |
| Ohio | 1 | 0 | 0.7 | 0 |
| Oklahoma | 1 | 0.7 | 0.6 | 0 |
| Oregon | 0.8 | 1 | 0.2 | 0 |
| Pennsylvania | 1 | 0 | 0 | 0 |
| Rhode Island | 1 | 1 | 0.4 | 0 |
| South Carolina | 1 | 0 | 1 | 0 |
| South Dakota | 1 | 1 | 1 | 0 |
| Tennessee | 1 | 0 | 0.7 | 0 |
| Texas | 0.2 | 0 | 0 | 0 |
| Utah | 1 | 1 | 0.6 | 0 |
| Vermont | 1 | 1 | 1 | 0 |
| Virginia | 0.8 | 0 | 0.6 | 0 |
| Washington | 0.4 | 0.8 | 0 | 0 |
| West Virginia | 1 | 0.7 | 1 | 0 |
| Wisconsin | 1 | 0.7 | 0.8 | 0 |
| Wyoming | 1 | 1 | 0.4 | 0 |
Notes: As described in the technical methodology, the national level-ratio is given greater weight in the final unemployment rate calculation when the unemployment rate for a particular race/ethnicity group within a specific state as calculated in the CPS is more volatile based on our sample size benchmark criteria. AAPI stands for Asian American and Pacific Islander.
Examples of unemployment rate estimates using our new methodology
This section provides a few examples, illustrated with charts, showing how unemployment rate estimates by race/ethnicity at the state level using the new methodology contrast with estimates based solely on state-level data. The examples given here correspond to a subset of the race/ethnicity-and-state combination examples given in Table 3. All the estimates are obtained by multiplying a demographic group-specific unemployment rate ratio from the last 12 months of CPS data with a statewide unemployment rate estimate from averaging the latest three months of LAUS data. The example estimates based on our new methodology use a ratio that is a weighted sum of the state-level unemployment rate for a given demographic group and the national-level ratio for the group in question. The contrasting estimates, which are presented here for illustration purposes only, use a ratio that is based solely on state-level data (i.e., no weight is given to the national-level ratio for the group in question).
As can be seen in the various graphs in Figures B–G, the estimates based on our new methodology are smoother than the estimates based only on state-level data. Nonetheless, the new estimates are often not drastically different from the estimates that give no weight to national ratios when looking across time. The sharpest contrast is the case in which a weight of 1.0 is given to the national ratio; the example given here, in Figure G, demonstrates this contrast for AAPI workers in South Dakota. As detailed in Table 3, the median sample size for AAPI workers in South Dakota within the CPS for the previous 12 months of data was only 172 during the examined period. These very small sample sizes are reflected in the volatility of the estimates in Figure G that are based solely on state-level data, i.e., they give weight only to the ratio of the unemployment rate for AAPI workers in South Dakota to the statewide unemployment rate. In contrast, the new methodology gives full weight to the ratio of the unemployment rate for AAPI workers across the U.S. to the national unemployment rate when calculating estimates for AAPI workers in South Dakota. The resulting estimates across the 10 years of quarterly data presented are a lot more stable. Again, the estimates using the South Dakota-based ratios are presented here for illustration purposes only. We would not report estimates that are this volatile.
Comparison of unemployment rate estimates for AAPI workers in Massachusetts: Estimates using state-level data only and using new methodology
| Quarter | Unemployment rate estimate using only state-level data | Unemployment rate estimate with weight of 0.2 for national AAPI ratio |
|---|---|---|
| 2012 Q2 | 3.4% | 3.8% |
| 2012 Q3 | 3.3% | 3.7% |
| 2012 Q4 | 3.8% | 4.1% |
| 2013 Q1 | 4.5% | 4.6% |
| 2013 Q2 | 4.6% | 4.7% |
| 2013 Q3 | 6.1% | 5.9% |
| 2013 Q4 | 6.1% | 5.8% |
| 2014 Q1 | 5.9% | 5.7% |
| 2014 Q2 | 6.9% | 6.5% |
| 2014 Q3 | 6.6% | 6.2% |
| 2014 Q4 | 6.7% | 6.3% |
| 2015 Q1 | 6.2% | 5.8% |
| 2015 Q2 | 5.1% | 4.8% |
| 2015 Q3 | 3.8% | 3.7% |
| 2015 Q4 | 3.1% | 3.2% |
| 2016 Q1 | 2.7% | 2.8% |
| 2016 Q2 | 3.0% | 3.0% |
| 2016 Q3 | 3.2% | 3.1% |
| 2016 Q4 | 3.2% | 3.1% |
| 2017 Q1 | 2.8% | 2.8% |
| 2017 Q2 | 2.5% | 2.6% |
| 2017 Q3 | 2.3% | 2.4% |
| 2017 Q4 | 2.8% | 2.8% |
| 2018 Q1 | 4.3% | 4.1% |
| 2018 Q2 | 4.2% | 3.9% |
| 2018 Q3 | 4.4% | 4.1% |
| 2018 Q4 | 3.9% | 3.7% |
| 2019 Q1 | 2.6% | 2.6% |
| 2019 Q2 | 2.6% | 2.6% |
| 2019 Q3 | 2.0% | 2.1% |
| 2019 Q4 | 1.5% | 1.7% |
| 2020 Q1 | 1.5% | 1.6% |
| 2020 Q2 | 13.9% | 14.1% |
| 2020 Q3 | 9.5% | 9.9% |
| 2020 Q4 | 7.9% | 8.1% |
| 2021 Q1 | 6.1% | 6.3% |
| 2021 Q2 | 5.8% | 5.9% |
| 2021 Q3 | 6.3% | 6.1% |
| 2021 Q4 | 5.7% | 5.5% |
| 2022 Q1 | 5.7% | 5.5% |
Note: AAPI stands for Asian American and Pacific Islander. These charts are for illustrative purposes only. They illustrate the difference between the previous methodology and the new (2022) methodology used by EPI to analyze quarterly state unemployment data by race and ethnicity. See description of methodology in text.
Source: EPI analysis of Bureau of Labor Statistics Local Area Unemployment Statistics (LAUS) data and Current Population Survey (CPS) data.
Comparison of unemployment rate estimates for Black workers in Kentucky: Estimates using state-level data only and using new methodology
| Quarter | Unemployment rate estimate using only state-level data | Unemployment rate estimate with weight of 0.4 for national Black ratio |
|---|---|---|
| 2012 Q2 | 16.1% | 15.3% |
| 2012 Q3 | 14.1% | 14.1% |
| 2012 Q4 | 14.0% | 14.0% |
| 2013 Q1 | 12.5% | 13.1% |
| 2013 Q2 | 11.8% | 12.8% |
| 2013 Q3 | 10.8% | 12.2% |
| 2013 Q4 | 10.3% | 11.7% |
| 2014 Q1 | 9.8% | 11.2% |
| 2014 Q2 | 9.8% | 10.8% |
| 2014 Q3 | 9.1% | 9.9% |
| 2014 Q4 | 8.2% | 9.1% |
| 2015 Q1 | 8.5% | 9.1% |
| 2015 Q2 | 8.7% | 9.1% |
| 2015 Q3 | 10.3% | 10.0% |
| 2015 Q4 | 10.8% | 10.3% |
| 2016 Q1 | 10.2% | 9.9% |
| 2016 Q2 | 10.0% | 9.6% |
| 2016 Q3 | 8.5% | 8.6% |
| 2016 Q4 | 7.5% | 8.1% |
| 2017 Q1 | 8.0% | 8.3% |
| 2017 Q2 | 7.8% | 8.0% |
| 2017 Q3 | 7.4% | 7.7% |
| 2017 Q4 | 7.6% | 7.6% |
| 2018 Q1 | 7.4% | 7.4% |
| 2018 Q2 | 6.9% | 7.0% |
| 2018 Q3 | 6.9% | 7.0% |
| 2018 Q4 | 7.3% | 7.2% |
| 2019 Q1 | 6.7% | 6.8% |
| 2019 Q2 | 6.7% | 6.8% |
| 2019 Q3 | 7.2% | 7.1% |
| 2019 Q4 | 6.3% | 6.5% |
| 2020 Q1 | 6.0% | 6.2% |
| 2020 Q2 | 18.2% | 17.4% |
| 2020 Q3 | 8.8% | 8.3% |
| 2020 Q4 | 9.2% | 8.3% |
| 2021 Q1 | 9.7% | 8.5% |
| 2021 Q2 | 9.6% | 8.7% |
| 2021 Q3 | 9.9% | 8.9% |
| 2021 Q4 | 8.0% | 7.8% |
| 2022 Q1 | 7.4% | 7.3% |
Note: These charts are for illustrative purposes only. They illustrate the difference between the previous methodology and the new (2022) methodology used by EPI to analyze quarterly state unemployment data by race and ethnicity. See description of methodology in text.
Source: EPI analysis of Bureau of Labor Statistics Local Area Unemployment Statistics (LAUS) data and Current Population Survey (CPS) data.
Comparison of unemployment rate estimates for Hispanic workers in Virginia: Estimates using state-level data only and using new methodology
| Quarter | Unemployment rate estimate using only state-level data | Unemployment rate estimate with weight of 0.6 for national Hispanic ratio |
|---|---|---|
| 2012 Q2 | 3.6% | 6.1% |
| 2012 Q3 | 3.9% | 6.1% |
| 2012 Q4 | 3.1% | 5.6% |
| 2013 Q1 | 3.5% | 5.6% |
| 2013 Q2 | 4.3% | 5.9% |
| 2013 Q3 | 4.5% | 5.9% |
| 2013 Q4 | 5.0% | 6.0% |
| 2014 Q1 | 5.8% | 6.2% |
| 2014 Q2 | 5.8% | 6.2% |
| 2014 Q3 | 5.3% | 5.8% |
| 2014 Q4 | 5.7% | 5.8% |
| 2015 Q1 | 5.3% | 5.5% |
| 2015 Q2 | 5.7% | 5.5% |
| 2015 Q3 | 5.6% | 5.4% |
| 2015 Q4 | 5.4% | 5.2% |
| 2016 Q1 | 4.9% | 4.9% |
| 2016 Q2 | 4.0% | 4.5% |
| 2016 Q3 | 4.3% | 4.6% |
| 2016 Q4 | 3.2% | 4.2% |
| 2017 Q1 | 3.3% | 4.2% |
| 2017 Q2 | 3.7% | 4.2% |
| 2017 Q3 | 3.9% | 4.1% |
| 2017 Q4 | 4.1% | 4.1% |
| 2018 Q1 | 3.6% | 3.7% |
| 2018 Q2 | 3.3% | 3.4% |
| 2018 Q3 | 3.6% | 3.4% |
| 2018 Q4 | 3.8% | 3.6% |
| 2019 Q1 | 4.1% | 3.8% |
| 2019 Q2 | 3.7% | 3.4% |
| 2019 Q3 | 3.3% | 3.2% |
| 2019 Q4 | 3.5% | 3.3% |
| 2020 Q1 | 3.8% | 3.5% |
| 2020 Q2 | 15.0% | 13.5% |
| 2020 Q3 | 9.9% | 9.4% |
| 2020 Q4 | 7.9% | 7.2% |
| 2021 Q1 | 6.2% | 6.1% |
| 2021 Q2 | 4.7% | 5.1% |
| 2021 Q3 | 3.6% | 4.2% |
| 2021 Q4 | 2.7% | 3.6% |
| 2022 Q1 | 2.9% | 3.5% |
Note: These charts are for illustrative purposes only. They illustrate the difference between the previous methodology and the new (2022) methodology used by EPI to analyze quarterly state unemployment data by race and ethnicity. See description of methodology in text.
Source: EPI analysis of Bureau of Labor Statistics Local Area Unemployment Statistics (LAUS) data and Current Population Survey (CPS) data.
Comparison of unemployment rate estimates for Black workers in Arizona: Estimates using state-level data only and using new methodology
| Quarter | Unemployment rate estimate using only state-level data | Unemployment rate estimate with weight of 0.7 for national Black ratio |
|---|---|---|
| 2012 Q2 | 9.5% | 13.2% |
| 2012 Q3 | 9.6% | 12.8% |
| 2012 Q4 | 7.8% | 12.1% |
| 2013 Q1 | 8.0% | 12.3% |
| 2013 Q2 | 9.6% | 12.7% |
| 2013 Q3 | 11.2% | 13.0% |
| 2013 Q4 | 13.2% | 13.3% |
| 2014 Q1 | 12.7% | 12.8% |
| 2014 Q2 | 10.2% | 11.8% |
| 2014 Q3 | 7.8% | 10.9% |
| 2014 Q4 | 6.5% | 10.5% |
| 2015 Q1 | 6.4% | 10.2% |
| 2015 Q2 | 6.7% | 10.0% |
| 2015 Q3 | 6.7% | 9.8% |
| 2015 Q4 | 7.1% | 9.6% |
| 2016 Q1 | 6.7% | 9.2% |
| 2016 Q2 | 7.7% | 9.3% |
| 2016 Q3 | 8.3% | 9.3% |
| 2016 Q4 | 7.7% | 8.8% |
| 2017 Q1 | 7.3% | 8.4% |
| 2017 Q2 | 7.7% | 8.3% |
| 2017 Q3 | 8.4% | 8.4% |
| 2017 Q4 | 9.5% | 8.8% |
| 2018 Q1 | 9.6% | 8.7% |
| 2018 Q2 | 9.3% | 8.5% |
| 2018 Q3 | 9.7% | 8.6% |
| 2018 Q4 | 8.1% | 8.3% |
| 2019 Q1 | 7.7% | 8.1% |
| 2019 Q2 | 6.9% | 7.8% |
| 2019 Q3 | 6.7% | 7.7% |
| 2019 Q4 | 6.8% | 7.7% |
| 2020 Q1 | 6.8% | 7.8% |
| 2020 Q2 | 15.6% | 16.0% |
| 2020 Q3 | 8.4% | 10.3% |
| 2020 Q4 | 7.1% | 8.6% |
| 2021 Q1 | 7.4% | 8.1% |
| 2021 Q2 | 6.8% | 7.8% |
| 2021 Q3 | 6.3% | 6.9% |
| 2021 Q4 | 5.7% | 6.1% |
| 2022 Q1 | 4.7% | 5.5% |
Note: These charts are for illustrative purposes only. They illustrate the difference between the previous methodology and the new (2022) methodology used by EPI to analyze quarterly state unemployment data by race and ethnicity. See description of methodology in text.
Source: EPI analysis of Bureau of Labor Statistics Local Area Unemployment Statistics (LAUS) data and Current Population Survey (CPS) data.
Comparison of unemployment rate estimates for Hispanic workers in Delaware: Estimates using state-level data only and using new methodology
| Quarter | Unemployment rate estimate using only state-level data | Unemployment rate estimate with weight of 0.8 for national Hispanic ratio |
|---|---|---|
| 2012 Q2 | 7.8% | 8.8% |
| 2012 Q3 | 8.4% | 9.0% |
| 2012 Q4 | 8.8% | 9.0% |
| 2013 Q1 | 8.0% | 8.7% |
| 2013 Q2 | 8.2% | 8.4% |
| 2013 Q3 | 7.3% | 7.9% |
| 2013 Q4 | 7.6% | 7.6% |
| 2014 Q1 | 7.9% | 7.5% |
| 2014 Q2 | 7.7% | 7.3% |
| 2014 Q3 | 8.5% | 7.1% |
| 2014 Q4 | 8.3% | 6.6% |
| 2015 Q1 | 6.8% | 6.1% |
| 2015 Q2 | 6.7% | 6.0% |
| 2015 Q3 | 6.5% | 6.0% |
| 2015 Q4 | 5.6% | 5.8% |
| 2016 Q1 | 5.4% | 5.5% |
| 2016 Q2 | 4.8% | 5.3% |
| 2016 Q3 | 4.8% | 5.3% |
| 2016 Q4 | 5.3% | 5.5% |
| 2017 Q1 | 4.6% | 5.4% |
| 2017 Q2 | 4.1% | 5.1% |
| 2017 Q3 | 3.6% | 4.9% |
| 2017 Q4 | 2.7% | 4.6% |
| 2018 Q1 | 3.5% | 4.6% |
| 2018 Q2 | 4.1% | 4.5% |
| 2018 Q3 | 3.7% | 4.2% |
| 2018 Q4 | 3.5% | 4.1% |
| 2019 Q1 | 2.2% | 3.9% |
| 2019 Q2 | 1.6% | 3.8% |
| 2019 Q3 | 1.7% | 3.9% |
| 2019 Q4 | 1.9% | 3.9% |
| 2020 Q1 | 2.8% | 4.5% |
| 2020 Q2 | 12.1% | 15.6% |
| 2020 Q3 | 8.9% | 9.5% |
| 2020 Q4 | 6.8% | 7.0% |
| 2021 Q1 | 7.4% | 7.5% |
| 2021 Q2 | 7.0% | 7.4% |
| 2021 Q3 | 5.1% | 6.5% |
| 2021 Q4 | 4.1% | 5.7% |
| 2022 Q1 | 4.1% | 5.4% |
Note: These charts are for illustrative purposes only. They illustrate the difference between the previous methodology and the new (2022) methodology used by EPI to analyze quarterly state unemployment data by race and ethnicity. See description of methodology in text.
Source: EPI analysis of Bureau of Labor Statistics Local Area Unemployment Statistics (LAUS) data and Current Population Survey (CPS) data.
Comparison of unemployment rate estimates for AAPI workers in South Dakota: Estimates using state-level data only and using new methodology
| Quarter | Unemployment rate estimate using only state-level data | Unemployment rate estimate with weight of 1.0 for national AAPI ratio |
|---|---|---|
| 2012 Q2 | 1.8% | 3.3% |
| 2012 Q3 | 5.0% | 3.2% |
| 2012 Q4 | 5.9% | 3.1% |
| 2013 Q1 | 6.5% | 3.0% |
| 2013 Q2 | 7.2% | 2.9% |
| 2013 Q3 | 3.2% | 2.8% |
| 2013 Q4 | 0.9% | 2.7% |
| 2014 Q1 | 1.7% | 2.6% |
| 2014 Q2 | 0.9% | 2.7% |
| 2014 Q3 | 1.3% | 2.7% |
| 2014 Q4 | 1.5% | 2.7% |
| 2015 Q1 | 3.7% | 2.6% |
| 2015 Q2 | 3.5% | 2.4% |
| 2015 Q3 | 2.8% | 2.4% |
| 2015 Q4 | 3.3% | 2.2% |
| 2016 Q1 | 3.6% | 2.2% |
| 2016 Q2 | 5.8% | 2.2% |
| 2016 Q3 | 5.3% | 2.5% |
| 2016 Q4 | 5.6% | 2.4% |
| 2017 Q1 | 3.6% | 2.4% |
| 2017 Q2 | 2.7% | 2.4% |
| 2017 Q3 | 2.4% | 2.5% |
| 2017 Q4 | 1.0% | 2.5% |
| 2018 Q1 | 2.0% | 2.4% |
| 2018 Q2 | 0.9% | 2.3% |
| 2018 Q3 | 1.5% | 2.2% |
| 2018 Q4 | 1.7% | 2.3% |
| 2019 Q1 | 1.3% | 2.3% |
| 2019 Q2 | 1.2% | 2.3% |
| 2019 Q3 | 1.1% | 2.3% |
| 2019 Q4 | 0.8% | 2.1% |
| 2020 Q1 | 0.7% | 2.0% |
| 2020 Q2 | 7.8% | 6.7% |
| 2020 Q3 | 4.7% | 4.7% |
| 2020 Q4 | 3.8% | 3.9% |
| 2021 Q1 | 3.5% | 3.5% |
| 2021 Q2 | 1.3% | 3.4% |
| 2021 Q3 | 1.1% | 3.1% |
| 2021 Q4 | 1.2% | 2.9% |
| 2022 Q1 | 1.1% | 2.5% |
Note: AAPI stands for Asian American and Pacific Islander. These charts are for illustrative purposes only. They illustrate the difference between the previous methodology and the new (2022) methodology used by EPI to analyze quarterly state unemployment data by race and ethnicity. See description of methodology in text.
Source: EPI analysis of Bureau of Labor Statistics Local Area Unemployment Statistics (LAUS) data and Current Population Survey (CPS) data.
Conclusion
This report details the new methodology used to generate estimates for EPI’s quarterly state unemployment by race and ethnicity series. We utilize two data sources, LAUS and the CPS, to estimate unemployment rates at the state level for AAPI, Black, and Hispanic workers in all 50 states plus D.C. With our previous methodology, we were limited in our ability to report estimates for these demographic groups across the states: Reporting for some groups was inconsistent from one quarter to the next; sample sizes were too small to generate estimates from in many states; and seasonality of CPS data can obscure long-run unemployment trends. Our new methodology builds a tiered system that utilizes, to various extents, national trends in the comparison of unemployment rates for a given demographic group relative to economywide unemployment rates.
For each state, our new calculation for quarterly unemployment rates by race and ethnicity uses a ratio that is a weighted sum of the state-level calculated ratio and the national ratio for the race/ethnicity group in question. This ratio is based on 12 months of CPS data and is multiplied with the statewide unemployment rate calculated from averaging the latest three months of LAUS data. The weight given to national and state-specific ratios will remain constant across quarters. Moreover, using national-level data to various degrees helps stabilize the group-specific ratios, and the final step in our calculations of multiplying the ratios with quarterly LAUS data allows us to report a quarterly state unemployment rate for each of our race/ethnicity groups for every quarter.
Note
1. See Economic Indicators: State Unemployment by Race and Ethnicity at https://www.epi.org/indicators/state-unemployment-race-ethnicity.
References
Bureau of Labor Statistics, Current Population Survey (BLS-CPS). 2022a. “Labor Force Statistics from the Current Population Survey, Technical Documentation” (web page). Accessed October 20, 2022.
Bureau of Labor Statistics, Local Area Unemployment Statistics (BLS-LAUS). 2022b. “Local Area Unemployment Statistics, Estimation Methodology” (web page). Accessed October 20, 2022.