What economic risks do older Americans face?
Americans face increasing economic risks as they age, including risks associated with poor health, job loss, and financial market downturns. Aging increases the risk of developing health conditions that are expensive to treat, affect a person’s ability to earn a living, or result in the need for assistance with daily activities (Tavares et al. 2022). Older workers are more likely than younger workers to assume caregiving responsibilities for aging family members that interfere with work. And older workers who lose their jobs are at greater risk of significant earnings losses than younger workers because they are likely to be unemployed longer, to accept a job with lower pay, or to take unplanned early retirement. The COVID-19 pandemic and the ensuing recession exacerbated many of these risks, though economic impact payments, expanded unemployment insurance benefits, and other temporary measures enacted by Congress helped cushion the financial blow.
The Older Workers and Retirement Chartbook

A joint project of EPI and the Schwartz Center for Economic Policy Analysis
Older households, especially those relying on 401(k) plans to fund retirement, are also exposed to risks associated with asset price volatility. Though older households may experience smaller percentage declines in net worth than younger households when stock and housing markets collapse, their losses are larger in dollar terms and have more of an impact on their future standard of living, which depends more on accrued assets and less on earnings than that of younger households (authors’ analysis of Federal Reserve 2022a, 2022b).
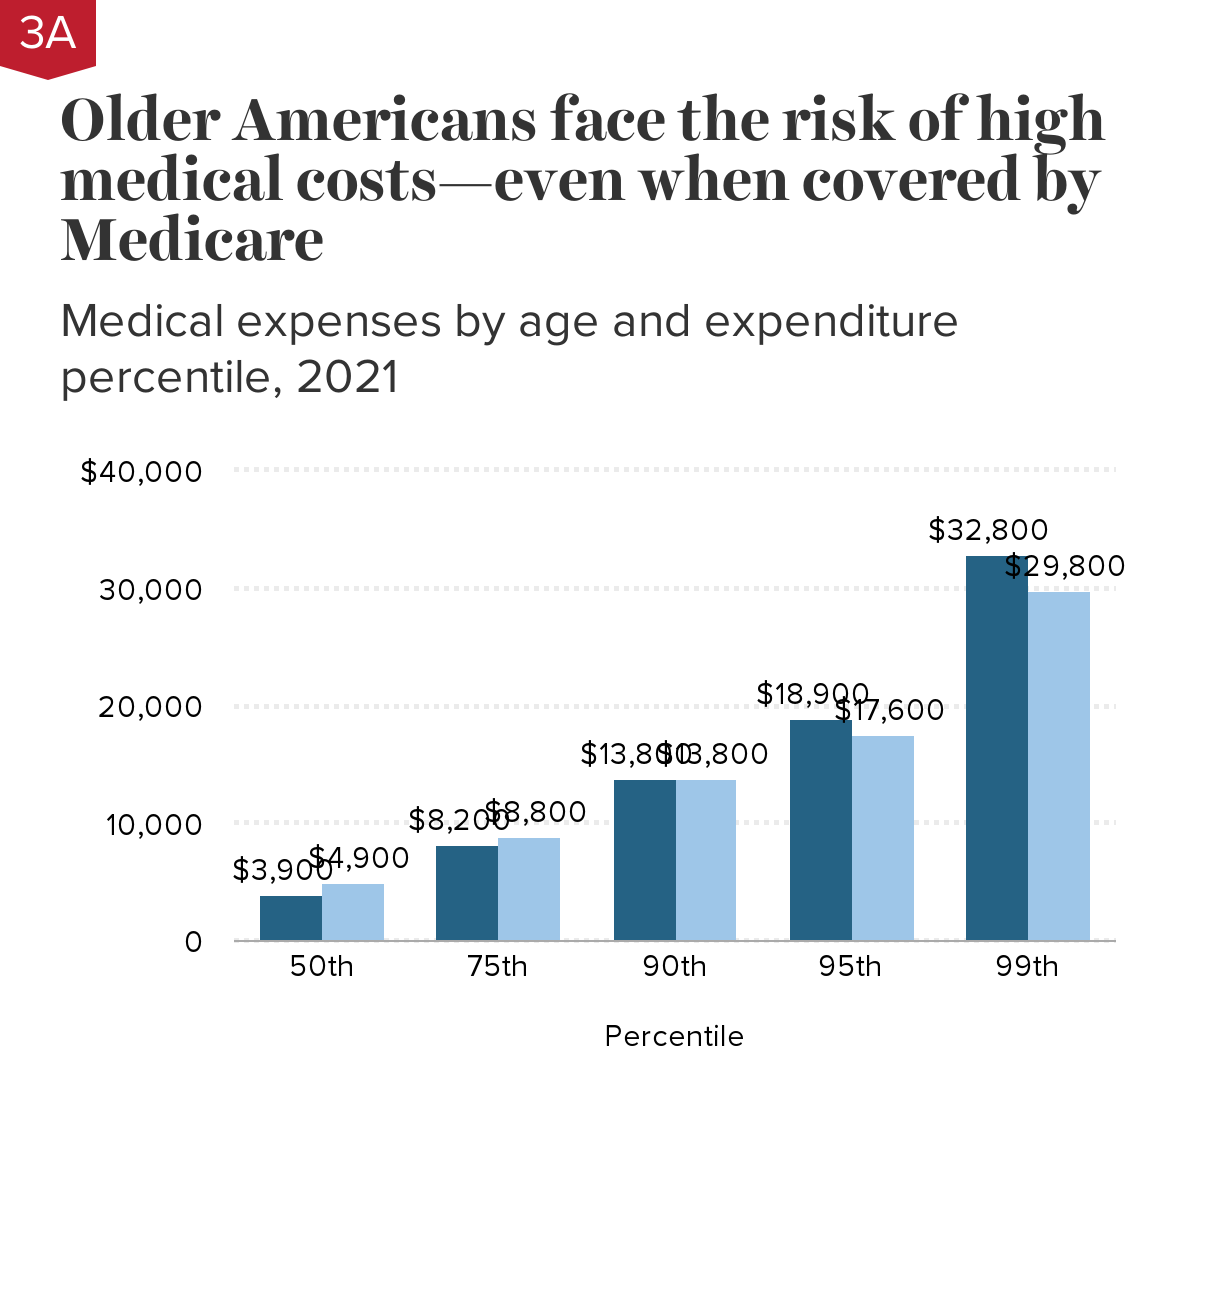
Older Americans face the risk of high medical costs—even when covered by Medicare: Medical expenses by age and expenditure percentile, 2021
| Percentile | Ages 55–64 | Age 65+ |
|---|---|---|
| 50th | $3,900 | $4,900 |
| 75th | $8,200 | $8,800 |
| 90th | $13,800 | $13,800 |
| 95th | $18,900 | $17,600 |
| 99th | $32,800 | $29,800 |
Notes: Households are ranked by the amount they spent on health insurance premiums and out-of-pocket medical expenses in 2021. The 50th percentile, or median, is the amount the typical household spends (50% spend less and 50% spend more). Medical expenses are based on estimates used for the Supplemental Poverty Measure (SPM), an alternative poverty measure published by the Census Bureau since 2010. This measure includes health insurance premiums, co-pays, prescriptions, medical supplies, and over-the-counter expenditures such as vitamins and pain relievers (Creamer 2022).
Source: Economic Policy Institute (EPI) and Schwartz Center for Economic Policy Analysis (SCEPA) analysis of IPUMS Current Population Survey microdata (Flood et al. 2021).
Americans of all ages, including older Americans, are underinsured against medical expenses, including premiums, co-pays, and other out-of-pocket costs. Most Americans are eligible for Medicare at age 65, leaving only 1.2% in the 65+ age group uninsured in 2021 (Keisler-Starkey and Bunch 2022). But Medicare coverage is no guarantee against high out-of-pocket costs. A typical Medicare-eligible senior still spends nearly $5,000 on health care in a year; 10% spend $13,800 or more; and the unluckiest 1% spend $29,800 or more.
Older Americans ages 55–64 have similarly high out-of-pocket costs. The average amount this group spends is $6,100, versus $6,600 for Medicare-eligible seniors (averages not shown in chart). Those with expensive conditions actually spend more than seniors—$18,900 or more for the unluckiest 10%, versus $17,600 or more for their 65 and older counterparts.
Older Americans ages 55–64 are healthier on average than those age 65 and older but are less likely to have government-provided health insurance. Most do not qualify for Medicare, and while the expansion of Medicaid eligibility under the Affordable Care Act reduced uninsured rates among lower-income older Americans, 9.4% of Americans ages 55–64 remained uninsured in 2021 (Katch, Wagner, and Aron-Dine 2018; Keisler-Starkey and Bunch 2022; authors’ analysis of IPUMS Current Population Survey microdata [Flood et al. 2021]). Though most out-of-pocket costs are capped for those with insurance (Rae, Amin, and Cox 2022), some still face high costs.
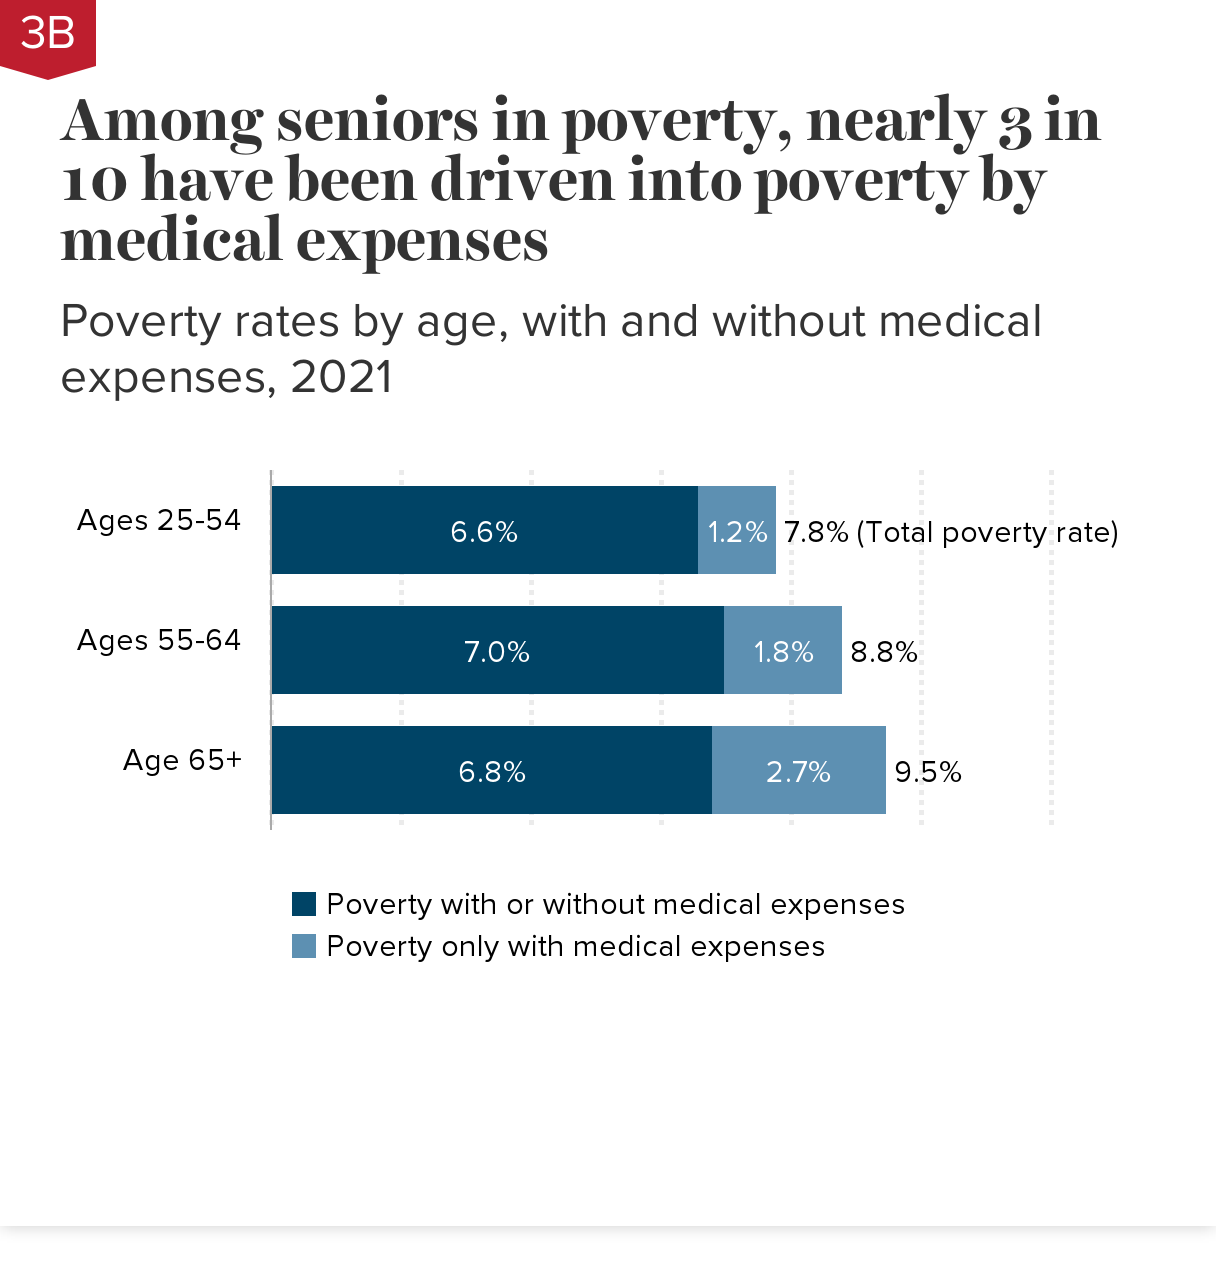
Among seniors in poverty, nearly 3 in 10 have been driven into poverty by medical expenses: Poverty rates by age, with and without medical expenses, 2021
| Supplemental Poverty Measure (SPM) poverty rates by age group, 2021 | Poverty with or without medical expenses | Poverty only with medical expenses | Total poverty rate |
|---|---|---|---|
| Ages 25–54 | 6.6% | 1.2% | 0 |
| Ages 55–64 | 7.0% | 1.8% | 0 |
| Age 65+ | 6.8% | 2.7% | 0 |
Notes: “Poverty only with medical expenses” is the share whose medical expenses push them into poverty (who would not otherwise be in poverty). “Poverty with or without medical expenses” is the share who are in poverty even without their medical expenses. Medical expenses are based on estimates of health insurance premiums and out-of-pocket health costs used to estimate the Supplemental Poverty Measure (SPM). The SPM is an alternative poverty measure published by the U.S. Census Bureau since 2010.
Notes: “Poverty only with medical expenses” is the share whose medical expenses push them into poverty (who would not otherwise be in poverty). “Poverty with or without medical expenses” is the share who are in poverty even without their medical expenses. Medical expenses are based on estimates of health insurance premiums and out-of-pocket health costs used to estimate the Supplemental Poverty Measure (SPM). The SPM is an alternative poverty measure published by the U.S. Census Bureau since 2010. In contrast to the Census Bureau’s “official” poverty threshold, which is benchmarked to three times the cost of a minimum food diet in 1963, the SPM takes into account the current cost of food, clothing, utilities, and shelter, as well as tax, work, medical, and child support expenses. The SPM also uses a broader resource measure that includes income and noncash benefits from both market sources and government programs (Fox and Burns 2021).
Source: Economic Policy Institute (EPI) and Schwartz Center for Economic Policy Analysis (SCEPA) analysis of IPUMS Current Population Survey data (Flood et al. 2021).
Higher medical expenses explain much of the higher poverty experienced by older Americans, based on the Census Bureau’s Supplemental Poverty Measure (see chart note). About 2% of Americans ages 55–64 fall into poverty after paying their health insurance premiums and other out-of-pocket medical expenses. The effects of health expenses are more severe for older Americans, as many retirees live on near-poverty incomes. Nearly three in 10 poor seniors age 65 and older are poor because of medical expenses.
Despite near-universal Medicare coverage, medical expenses have a big impact on senior poverty because aging is associated with an increase in conditions requiring medical attention and Medicare does not cap out-of-pocket expenses. Younger Americans ages 25–54 are less likely to experience poverty as a result of medical expenses as they are more likely to be healthy, to have sufficient income to keep them out of poverty, or to postpone costly health care which, while reducing expenses temporarily, can impact their health and financial status at older ages (Montero et al. 2022).
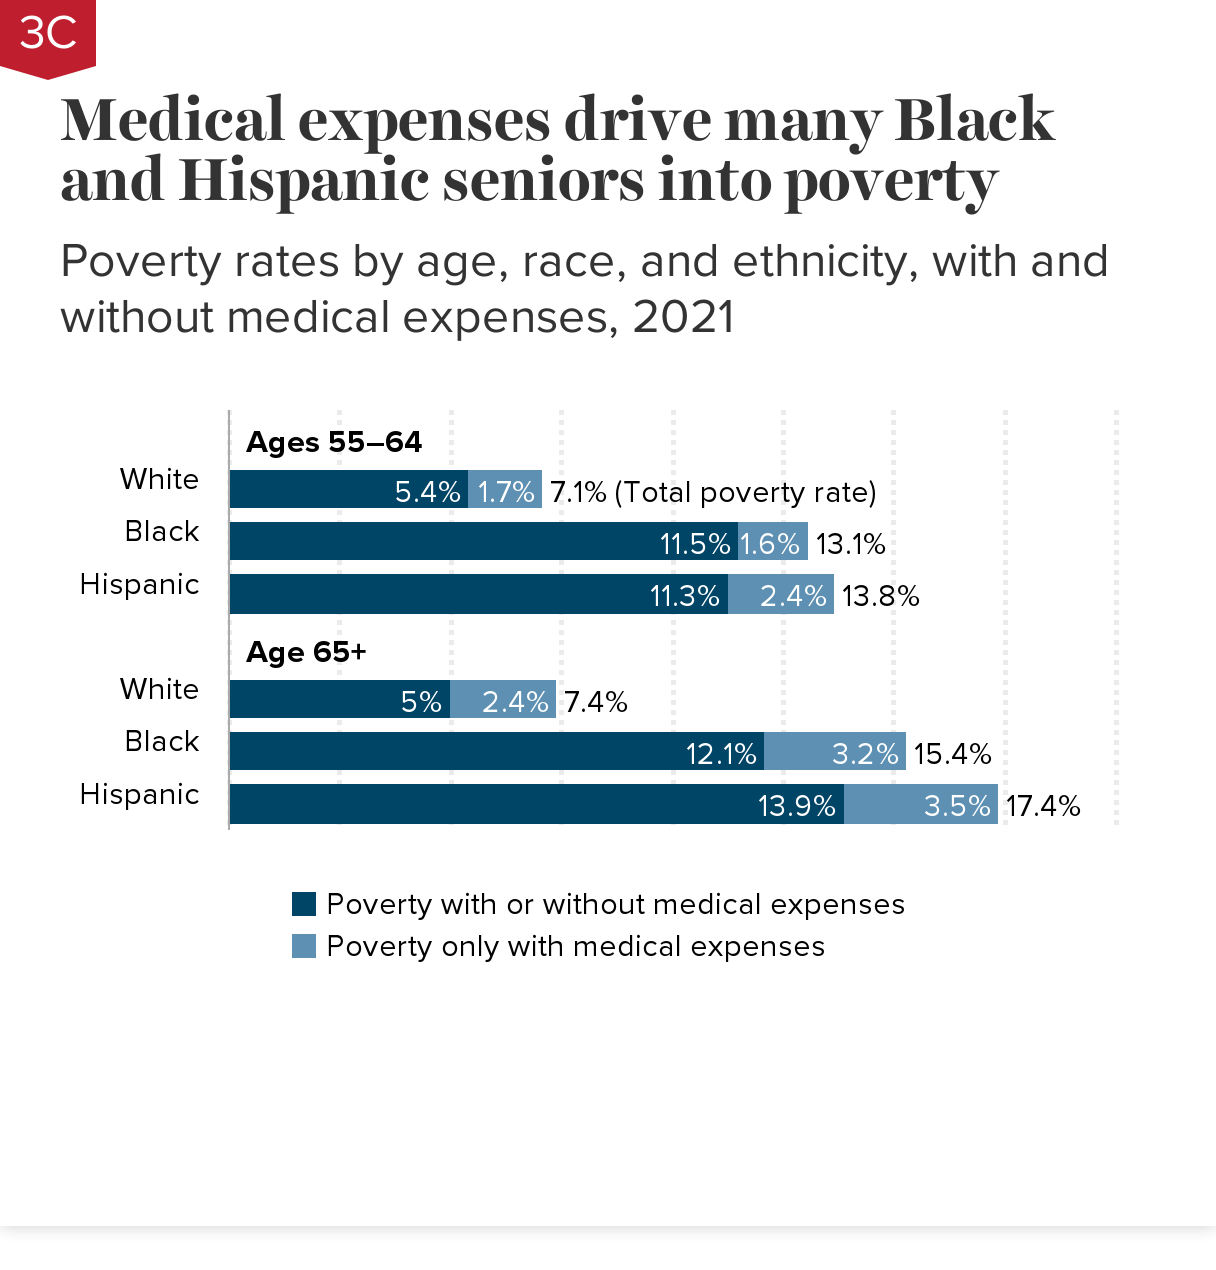
Medical expenses drive many Black and Hispanic seniors into poverty: Poverty rates by age, race, and ethnicity, with and without medical expenses, 2021
| Poverty with or without medical expenses | Poverty only with medical expenses | Total poverty rate | |
|---|---|---|---|
| White | 5.4% | 1.7% | 0 |
| Black | 11.5% | 1.6% | 0 |
| Hispanic | 11.3% | 2.4% | 0 |
| White | 5.0% | 2.4% | 0 |
| Black | 12.1% | 3.2% | 0 |
| Hispanic | 13.9% | 3.5% | 0 |
Notes: “Poverty only with medical expenses” is the share whose medical expenses push them into poverty (who would not otherwise be in poverty). “Poverty with or without medical expenses” is the share who are in poverty regardless of their medical expenses. Medical expenses are based on estimates of health insurance premiums and out-of-pocket health costs used to estimate the Supplemental Poverty Measure (SPM). The SPM is an alternative poverty measure published by the U.S. Census Bureau since 2010.
Notes: “Poverty only with medical expenses” is the share whose medical expenses push them into poverty (who would not otherwise be in poverty). “Poverty with or without medical expenses” is the share who are in poverty regardless of their medical expenses. Medical expenses are based on estimates of health insurance premiums and out-of-pocket health costs used to estimate the Supplemental Poverty Measure (SPM). The SPM is an alternative poverty measure published by the U.S. Census Bureau since 2010.
In contrast to the Census Bureau’s “official” poverty threshold, which is benchmarked to three times the cost of a minimum food diet in 1963, the SPM takes into account the current cost of food, clothing, utilities, and shelter, as well as tax, work, medical, and child support expenses. The SPM also uses a broader resource measure that includes income and noncash benefits from both market sources and government programs (Fox and Burns 2021).
Source: Economic Policy Institute (EPI) and Schwartz Center for Economic Policy Analysis (SCEPA) analysis of IPUMS Current Population Survey data (Flood et al. 2021).
Medical expenses contribute to very high poverty rates experienced by older Black and Hispanic Americans, based on the U.S. Census Bureau’s Supplemental Poverty Measure (see chart note). Black and Hispanic seniors age 65 and older are more than twice as likely to live in poverty as white seniors due to a combination of lower incomes and high medical expenses.
Among those ages 55–64, medical expenses have a larger impact on poverty for Hispanic Americans than for white or Black Americans because Hispanic Americans are more likely to be uninsured (Keisler-Starkey and Bunch 2022). Black Americans are more likely to have near-poverty incomes than white Americans, but higher Medicaid eligibility limits the impact of health expenses on the share of Black Americans living in poverty because Medicaid caps out-of-pocket costs (Guth, Ammula, and Hinton 2021).
Black and Hispanic Americans are more likely than white Americans to qualify for social insurance in the form of Medicare eligibility before age 65 (due to a long-term disability) and dual eligibility for Medicare and Medicaid (which covers some costs not covered by Medicare) (Ochieng et al. 2021). This helps to offset some—but not all—of the higher costs associated with poorer health.
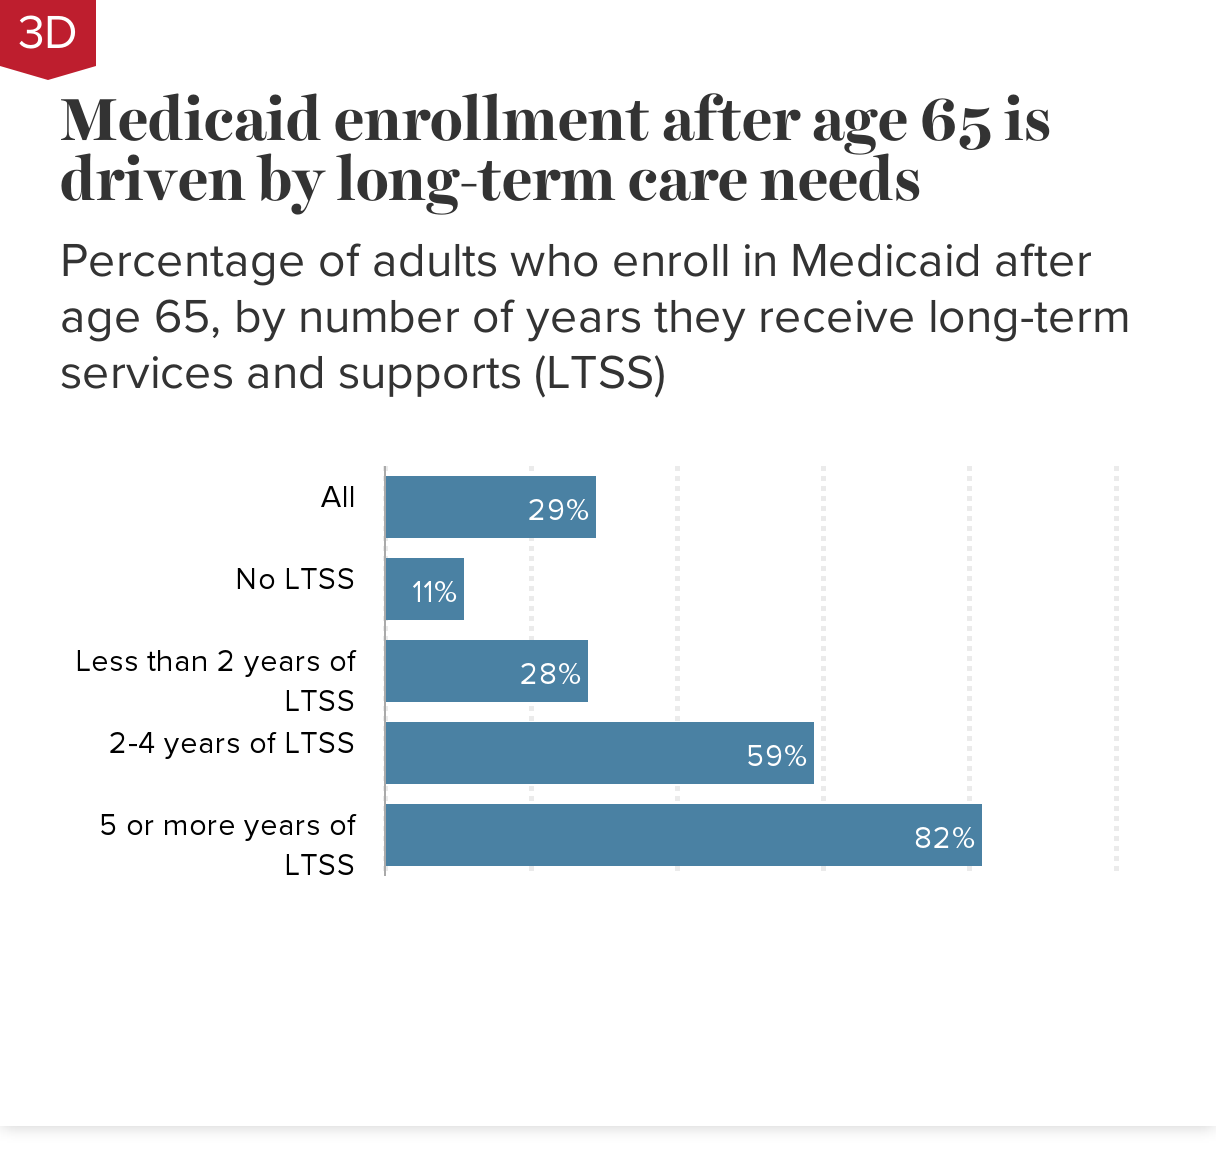
Medicaid enrollment after age 65 is driven by long-term care needs: Percentage of adults who enroll in Medicaid after age 65, by number of years they receive long-term services and supports (LTSS)
| Percentage who enroll in Medicaid after age 65 | |
|---|---|
| All | 29% |
| No LTSS | 11% |
| Less than 2 years of LTSS | 28% |
| 2-4 years of LTSS | 59% |
| 5 or more years of LTSS | 82% |
Notes: Simulated results for adults born between 1941 and 1975. Long-term services and supports (LTSS), also referred to as long-term care, are health and social services for seniors and others whose age or health conditions limit their ability to care for themselves. LTSS include services provided in people’s homes, in community-based settings, and in nursing facilities. Estimates do not include unpaid care provided by family members and other caregivers.
Simulated results for adults born between 1941 and 1975. Long-term services and supports (LTSS), also referred to as long-term care, are health and social services for seniors and others whose age or health conditions limit their ability to care for themselves. LTSS include services provided in people’s homes, in community-based settings, and in nursing facilities. Estimates do not include unpaid care provided by family members and other caregivers.
Estimates are based on research by the Urban Institute for the U.S. Department of Health and Human Services using the DYNASIM4 microsimulation model, which starts with a representative population sample from the U.S. Census Bureau’s Survey of Income and Program Participation and calibrates income and health dynamics based on information from multiple surveys, including the Health and Retirement Study and the Medicare Current Beneficiary Survey.
Source: Johnson and Favreault (2020), Table 8.
Medicaid pays for nursing home care and other long-term services and supports (LTSS) for seniors with limited resources, including those who have drawn down their savings to pay for such care. High rates of Medicaid coverage therefore serve as a measure of the financial risks associated with the need for LTSS.
LTSS expenses are generally not covered by Medicare (Medicare.gov 2022). Private long-term care insurance, meanwhile, is often inaccessible and expensive while offering limited protection (Sammon 2020). Even among the small number of seniors with private insurance, about a quarter will let their policies lapse, often due to cognitive impairments that make them more likely to need the long-term care that the insurance would have paid for (Friedberg et al. 2017).
While only 11% of seniors without long-term care needs enroll in Medicaid after age 65, most seniors who require long-term care for two or more years end up in the means-tested program. An estimated 59% of seniors requiring two to four years of LTSS, and 82% of those requiring five or more years of LTSS, will end up on Medicaid. Nursing home care is particularly expensive, with 77% of seniors who require nursing home care for two or more years enrolling in Medicaid (Johnson and Favreault 2020; not shown in chart).
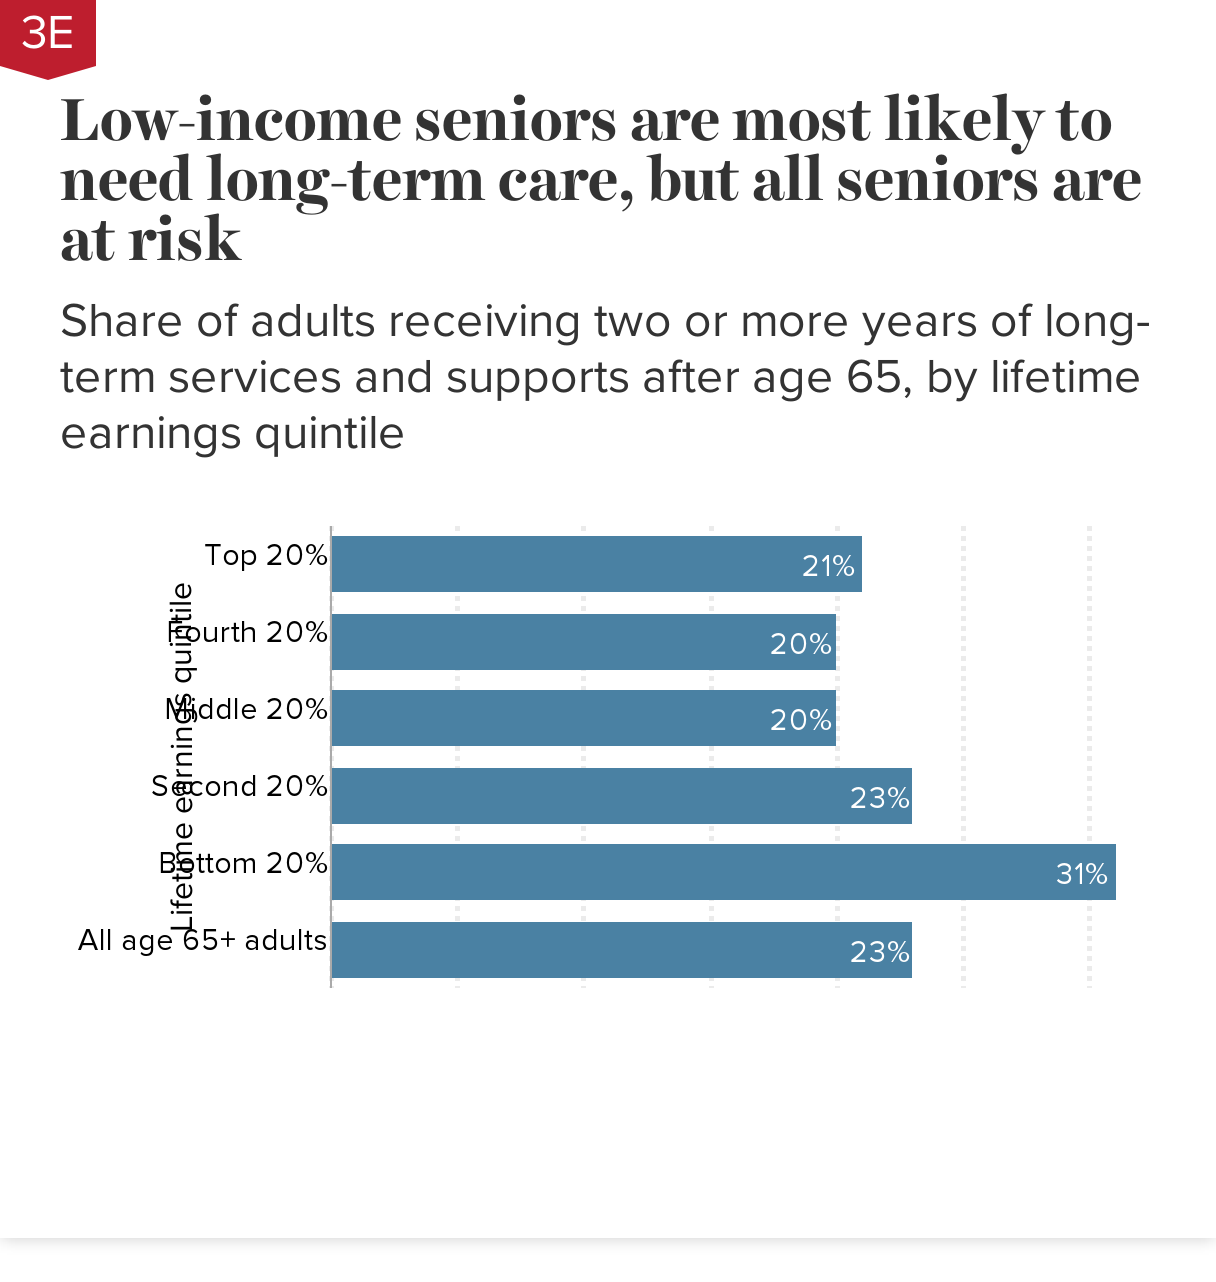
Low-income seniors are most likely to need long-term care, but all seniors are at risk: Share of adults receiving two or more years of long-term services and supports after age 65, by lifetime earnings quintile
| Lifetime earnings quintile | 2 years or more (%) |
|---|---|
| Top 20% | 21% |
| Fourth 20% | 20% |
| Middle 20% | 20% |
| Second 20% | 23% |
| Bottom 20% | 31% |
| All age 65+ adults | 23% |
Notes: Long-term services and supports (LTSS), also referred to as long-term care, are health and social services for seniors and others whose age or health conditions limit their ability to care for themselves. LTSS include services provided in people’s homes, in community-based settings, and in nursing facilities. Estimates do not include unpaid care provided by family members and other caregivers.
Notes: Long-term services and supports (LTSS), also referred to as long-term care, are health and social services for seniors and others whose age or health conditions limit their ability to care for themselves. LTSS include services provided in people’s homes, in community-based settings, and in nursing facilities. Estimates do not include unpaid care provided by family members and other caregivers.
Estimates are based on research by the Urban Institute for the U.S. Department of Health and Human Services using the DYNASIM4 microsimulation model, which starts with a representative population sample from the U.S. Census Bureau’s Survey of Income and Program Participation and calibrates income and health dynamics based on information from multiple surveys, including the Health and Retirement Study and the Medicare Current Beneficiary Survey.
Source: Johnson and Favreault (2020), Table 5.
Low earners face a greater risk than higher earners of requiring long-term care due to well-documented disparities in health and disability by socioeconomic status (Isaacs et al. 2021). Among seniors age 65 and older in the lowest lifetime earnings fifth, more than 3 in 10 (31%) will require two or more years of long-term services and supports (LTSS). Among seniors in the four higher earnings quintiles, roughly two in 10 will need two-plus years of LTSS.
Note that there is little difference in risk of needing LTSS among the latter four groups. This is likely because higher earners are more likely to live long enough to develop health conditions associated with advanced old age, offsetting their other health advantages relative to lower earners (Johnson 2019). Unlike individuals in the top four lifetime earnings groups, however, the adverse health effects of living in or near poverty for the bottom fifth of lifetime earners are not offset by their shorter lifespans and they face a higher risk of LTSS needs.
Though low earners are most affected, all seniors face a significant risk of needing to pay for LTSS for two or more years, with a concomitant increased likelihood of needing Medicaid to help with costs (see Chart 3D). Seniors 65 and older who need expensive nursing home care are at especially high risk of exhausting their resources. Even among those in the top earnings quintile, 43% of those who need nursing home care for two or more years end up on Medicaid (Johnson 2019; not shown in chart).
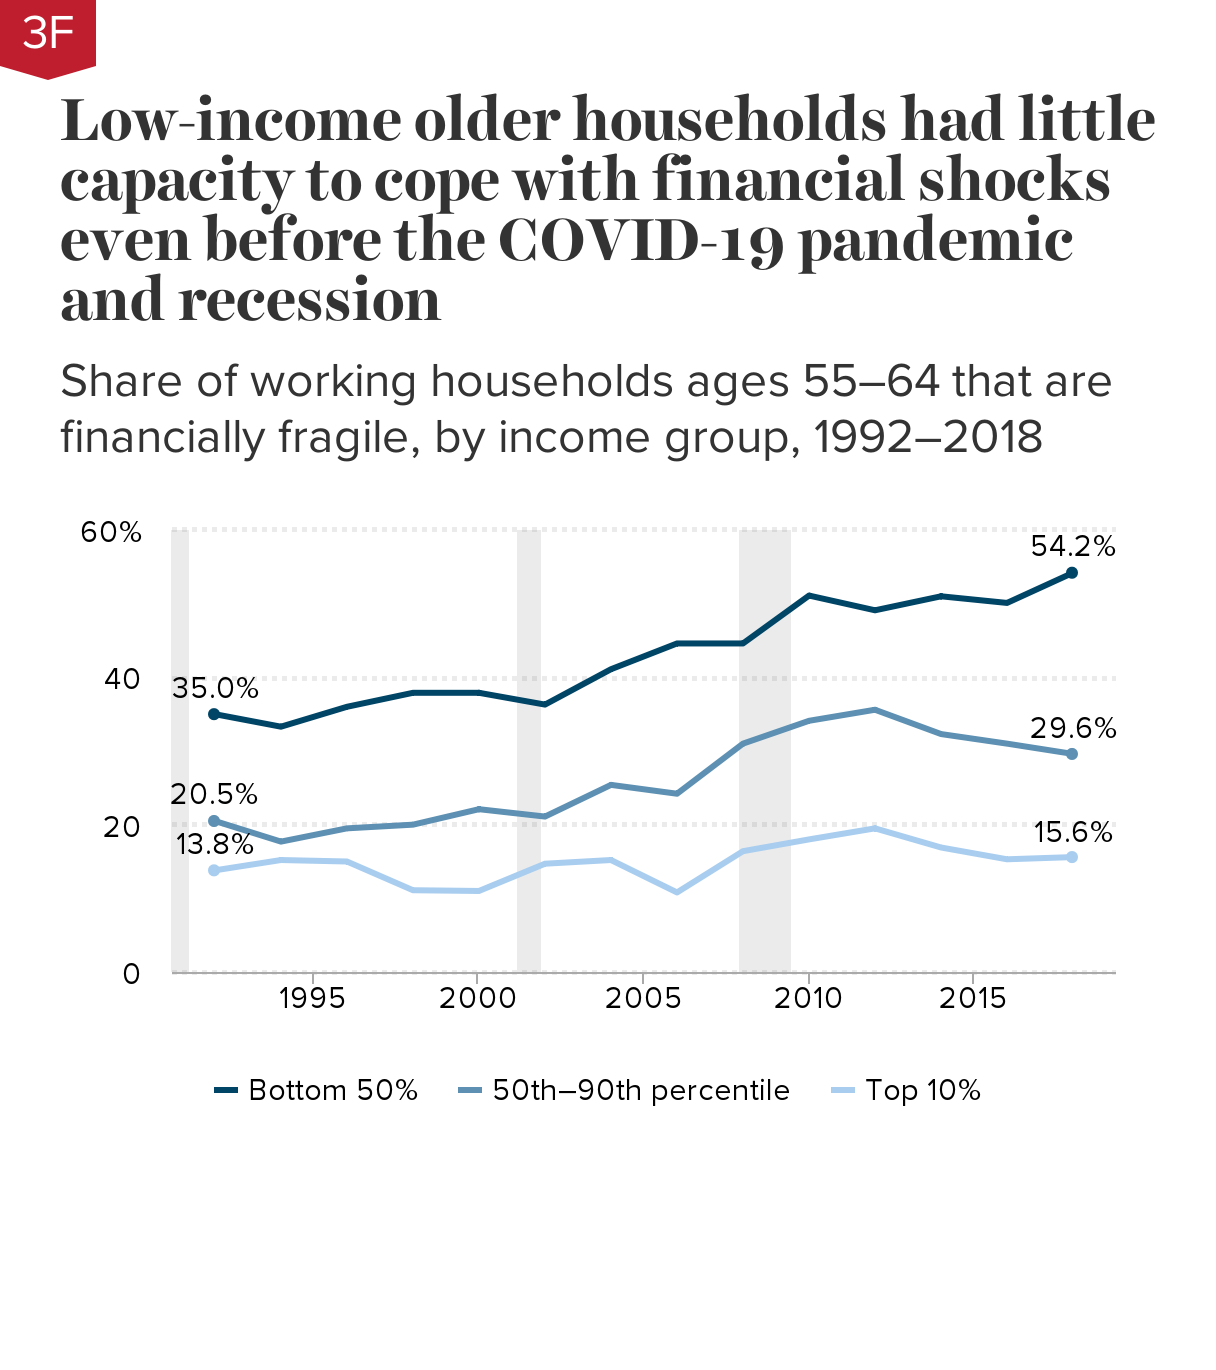
Low-income older households had little capacity to cope with financial shocks even before the COVID-19 pandemic and recession: Share of working households ages 55–64 that are financially fragile, by income group, 1992–2018
| Year | Bottom 50% | 50th–90th percentile | Top 10% |
|---|---|---|---|
| 1992 | 35.0% | 20.5% | 13.8% |
| 1994 | 33.3% | 17.7% | 15.2% |
| 1996 | 36.0% | 19.5% | 15.0% |
| 1998 | 37.9% | 20.0% | 11.1% |
| 2000 | 37.9% | 22.1% | 11.0% |
| 2002 | 36.3% | 21.1% | 14.7% |
| 2004 | 41.1% | 25.4% | 15.2% |
| 2006 | 44.6% | 24.2% | 10.8% |
| 2008 | 44.6% | 31.0% | 16.4% |
| 2010 | 51.1% | 34.1% | 18.0% |
| 2012 | 49.1% | 35.6% | 19.5% |
| 2014 | 51.0% | 32.3% | 16.9% |
| 2016 | 50.1% | 31.0% | 15.3% |
| 2018 | 54.2% | 29.6% | 15.6% |
Notes: A household is deemed financially fragile if it exceeds at least one of four thresholds: a home mortgage loan-to-value ratio above 80%; a ratio of nonhousing debt to liquid assets above 50%; less than three months’ worth of income in liquid assets; or rent exceeding 30% of income. Sample includes households with at least one working member and one member age 55–64. For married and partnered households, income percentiles are determined based on total household income divided by 1.7 to account for the fact that living expenses for couples are higher than—but less than double—the expenses of single householders.
Source: Economic Policy Institute (EPI) and Schwartz Center for Economic Policy Analysis (SCEPA) analysis of Health and Retirement Study (HRS) microdata (RAND and University of Michigan 1992–2018).
Many older working American households were struggling financially before COVID hit. These households therefore had less of a financial cushion to protect them from the economic fallout of the pandemic.
Over half (54%) of lower-income (bottom 50%) households ages 55–64 were financially fragile before the COVID-19 pandemic, based on their debt burdens, housing costs, and the savings they had available to access in an emergency. This is an increase in financial fragility from a third (35%) of such households in 1992.
In the wake of the Great Recession, rising mortgage debt, credit card balances, auto loans, and student debt hurt older households’ finances (GAO 2021; Butrica and Mudrazija 2020). As seen in the chart, older households across the income distribution experienced growing financial fragility between 2008 and 2012.
Wealthier older households—those in the top 10% of the income distribution—have roughly recovered to their 2008 levels. Households in the 50th–90th percentiles have also recovered to their 2008 levels but still face much higher rates of financial fragility than those in the top 10%; they are also much more financially fragile than their counterparts were in 1992. Households in the bottom half of the income distribution did not recover well from the Great Recession, and by 2018 they had reached historically high rates of financial fragility.
Other studies have found similar trends. A recent study by the Government Accountability Office (GAO) found that older households are more likely to be indebted than they were three decades ago, and a typical older household age 50 or older held roughly three times as much debt in 2016 as it did in 1989, adjusted for inflation (GAO 2021, not shown in chart). Butrica and Mudrazija (2020) found a significant increase in debt and falling credit scores, signs of deteriorating financial stability, among households age 70 and older, mostly due to increases in mortgage debt.
Rising debt levels are not necessarily cause for concern if they reflect rising homeownership or access to higher education among older households. However, a closer look at trends in indebtedness—such as rising home mortgage loan-to-value ratios among older homeowners—cautions against such a rosy view.
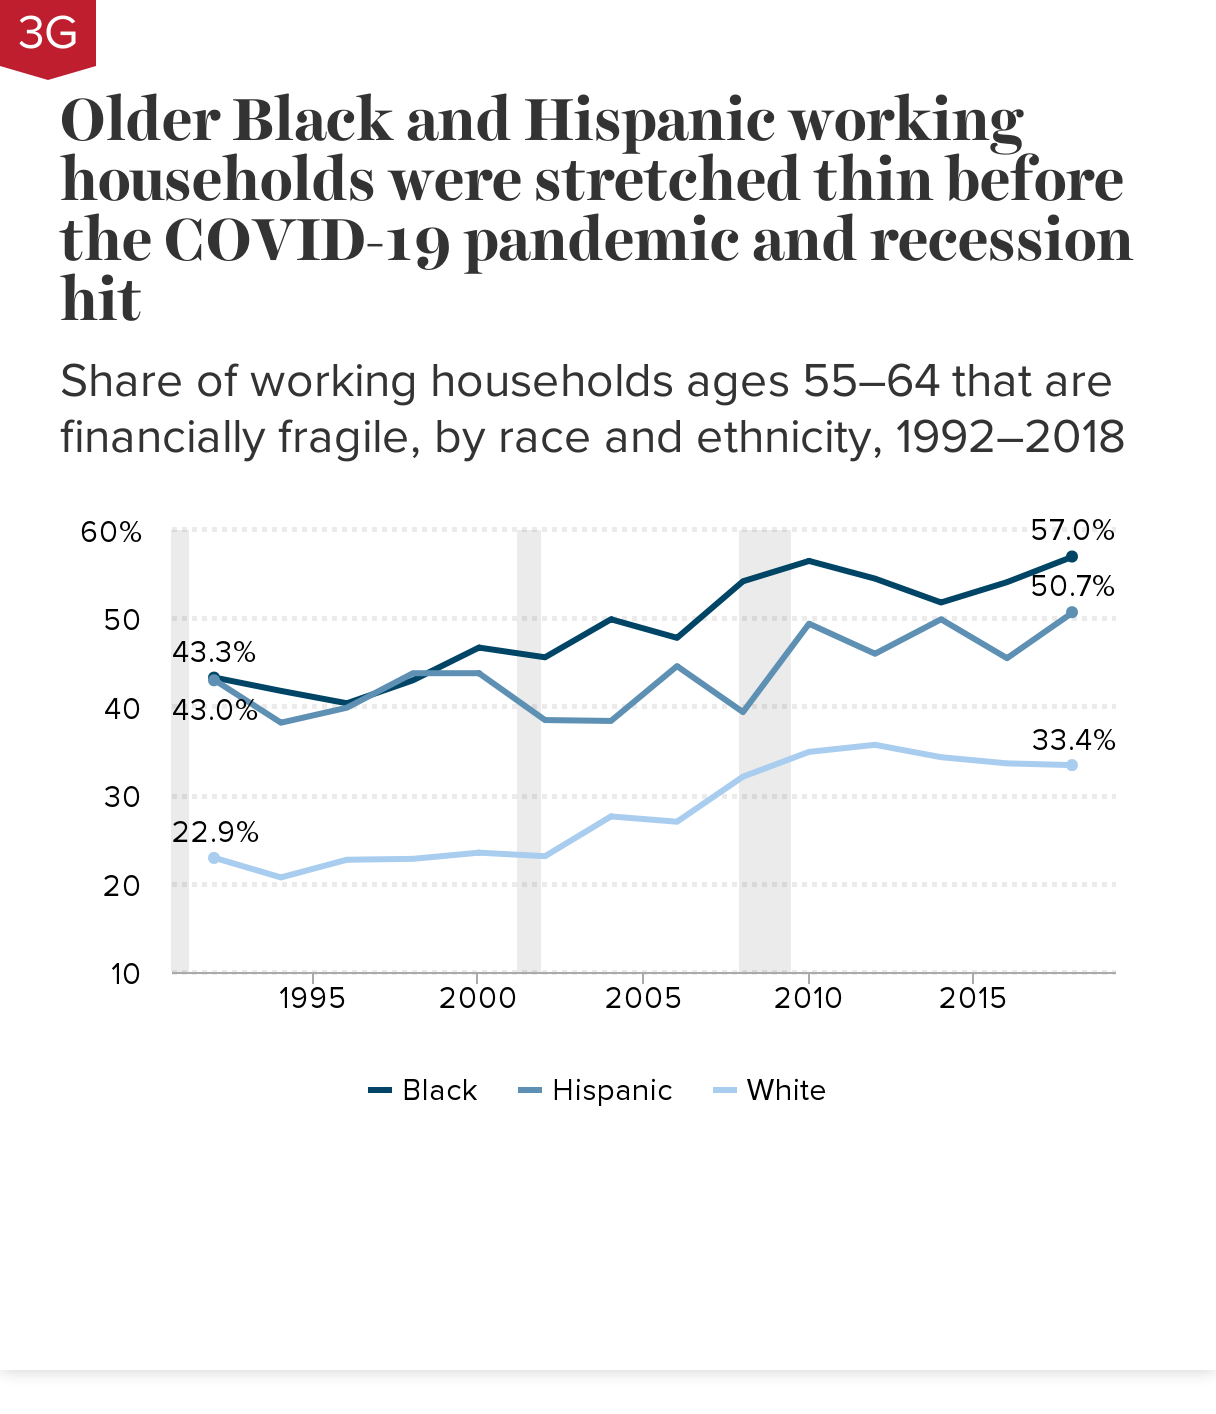
Older Black and Hispanic working households were stretched thin before the COVID-19 pandemic and recession hit: Share of working households ages 55–64 that are financially fragile, by race and ethnicity, 1992–2018
| Year | White | Black | Hispanic |
|---|---|---|---|
| 1992 | 22.9% | 43.3% | 43.0% |
| 1994 | 20.7% | 41.8% | 38.2% |
| 1996 | 22.7% | 40.4% | 39.9% |
| 1998 | 22.8% | 43.0% | 43.8% |
| 2000 | 23.5% | 46.7% | 43.8% |
| 2002 | 23.1% | 45.6% | 38.5% |
| 2004 | 27.6% | 49.9% | 38.4% |
| 2006 | 27.0% | 47.8% | 44.6% |
| 2008 | 32.1% | 54.2% | 39.4% |
| 2010 | 34.9% | 56.5% | 49.4% |
| 2012 | 35.7% | 54.5% | 46.0% |
| 2014 | 34.3% | 51.8% | 49.9% |
| 2016 | 33.6% | 54.1% | 45.5% |
| 2018 | 33.4% | 57.0% | 50.7% |
Notes: A household is deemed financially fragile if it exceeds at least one of four thresholds: a home mortgage loan-to-value ratio above 80%; a ratio of nonhousing debt to liquid assets above 50%; less than three months’ worth of income in liquid assets; or rent exceeding 30% of income. Sample includes households with at least one working member and one member age 55–64. For married and partnered households, income percentiles are determined based on total household income divided by 1.7 to account for the fact that living expenses for couples are higher than—but less than double—the expenses of single householders.
Source: Economic Policy Institute (EPI) and Schwartz Center for Economic Policy Analysis (SCEPA) analysis of Health and Retirement Study (HRS) microdata (RAND and University of Michigan 1992–2018).
Among working households ages 55–64, over half of Black (57.0%) and Hispanic (50.7%) households were financially fragile before the COVID-19 pandemic, based on their debt burdens, housing costs, and savings they could access in an emergency. In contrast, only a third (33.4%) of older white households were stretched too thin to weather a financial shock.
These findings are in line with previous research showing that debt burdens have risen more for Black and Hispanic households than for white households. Between 1989 and 2016, the debt-to-asset ratio of the typical household age 50 or older increased from 8% to 17% for white households, from 16% to 35% for Black households, and from 17% to 37% for Hispanic households (GAO 2021).
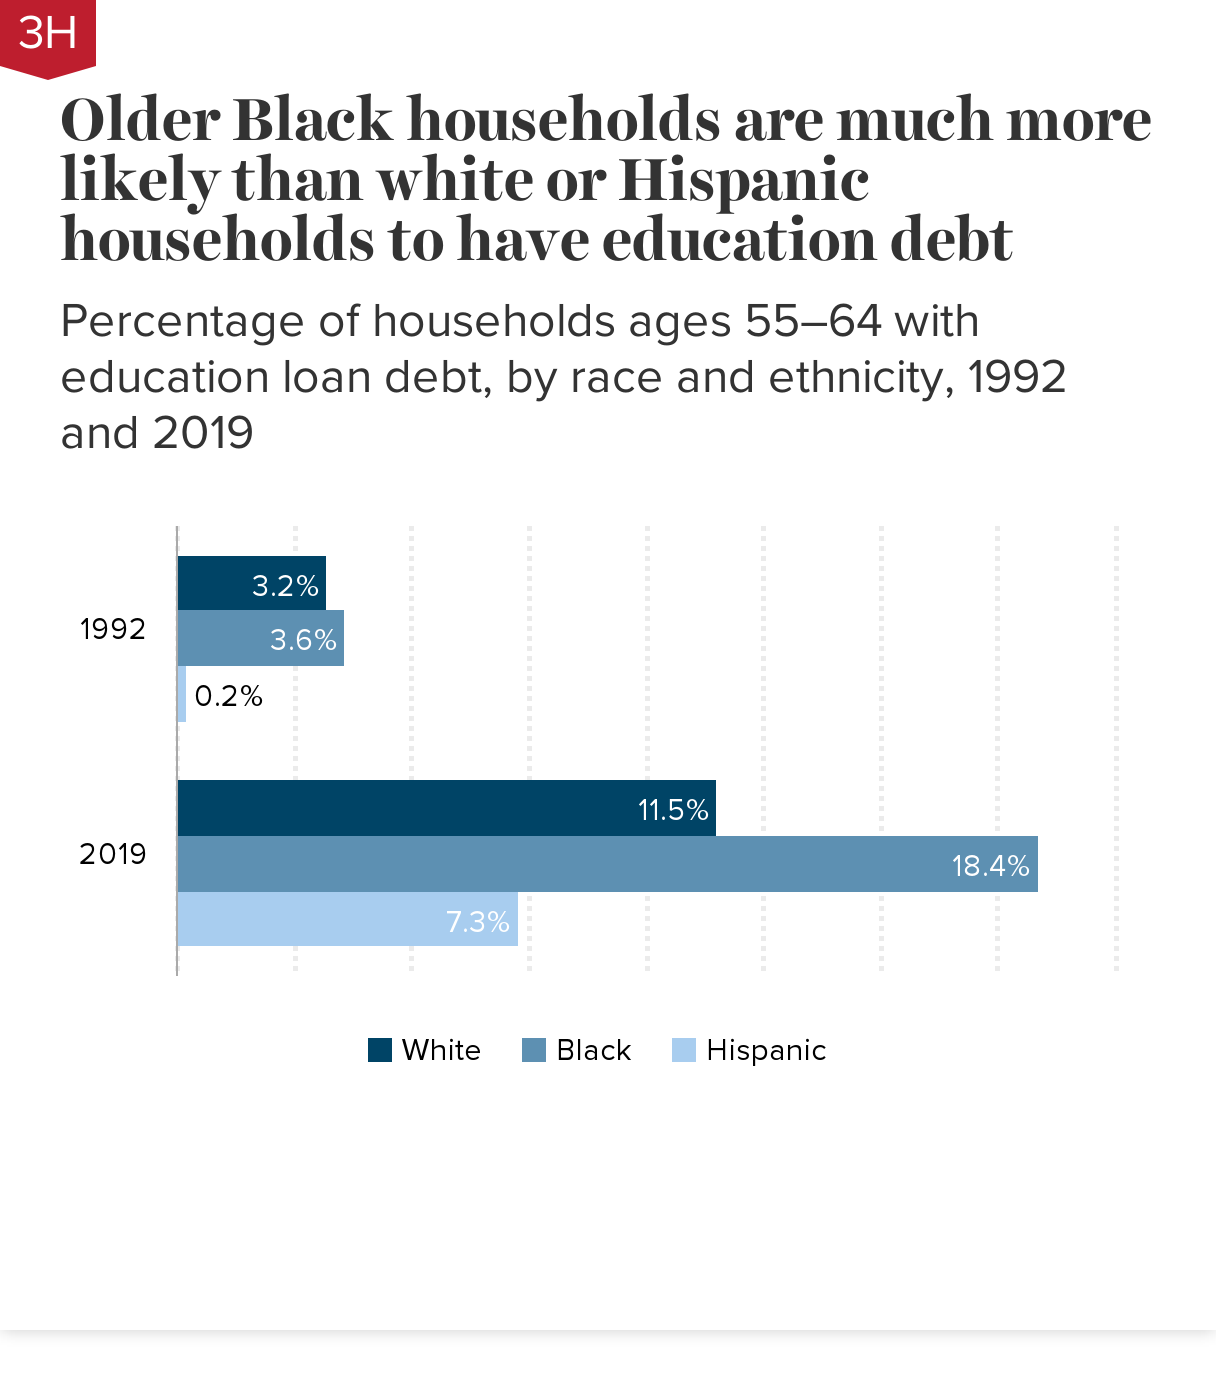
Older Black households are much more likely than white or Hispanic households to have education debt: Percentage of households ages 55–64 with education loan debt, by race and ethnicity, 1992 and 2019
| Share of households with education loan debt | White | Black | Hispanic |
|---|---|---|---|
| 1992 | 3.2% | 3.6% | 0.2% |
| 2019 | 11.5% | 18.4% | 7.3% |
Note: In the Survey of Consumer Finances, age and other household characteristics are based on the reference person, defined as the individual for a single householder, the male in a mixed-sex couple, and the older person in a same-sex couple.
Source: Economic Policy Institute (EPI) and Schwartz Center for Economic Policy Analysis (SCEPA) analysis of Survey of Consumer Finances microdata (Federal Reserve 2022a).
Student loan debt is the fastest-growing type of debt among older American households. More than four times as many households ages 55–64 had student loan debt in 2019 compared with 30 years ago (12.2% in 2019 vs. 2.9% in 1992; not shown in the chart). At the same time, their debt burden has increased: The median education debt-to-earnings ratio (total student loan debt to annual earnings) almost doubled, from 15.8% in 1992 to 28.4% in 2019 (Schuster 2021).
Ballooning student loan debt among households ages 55–64 is only partly explained by an increase in the share of older Americans with bachelor’s degrees, which rose from 17.9% to 32.4% over this period (authors’ analysis of Current Population Survey microdata [Flood et al. 2021]; not shown in the chart). Some of the increase in older households’ student debt reflects parents borrowing to help pay for their children’s educations (Looney and Lee 2018). College costs have risen rapidly (Jackson and Saenz 2021), while many Americans are burdened with student loans despite not obtaining—or their children not obtaining—degrees (Siegel Bernard 2022).
Black households have seen the fastest increase in student loan debt. As shown in the chart, the share of Black households ages 55–64 with student loan debt grew fivefold between 1992 and 2019, while the share of Black Americans in this age group with bachelor’s degrees roughly doubled, from 8.1% to 17.9% (authors’ analysis of Current Population Survey microdata [Flood et al. 2021]; not shown in chart). This suggests that many of these households took on student loan debt for their children or grandchildren, or that the student loans are for their own education but college costs rose faster than earnings and fewer former students were able to pay off their debts before age 55. In either case, the higher debt puts additional pressure on these older households’ finances.
Older workers experienced higher unemployment than mid-career workers in the pandemic recession: Percentage-point difference in average unemployment rate between older workers (age 55+) and mid-career workers (ages 35–54), 1975–2020 recessions
| Months of peak unemployment | Gap between mid-career (35–54) and older workers (55+) |
|---|---|
| May–Oct 1975 | -0.8 |
| Jul–Dec 1980 | -1.2 |
| Dec 1982–May 1983 | -1.7 |
| Jun–Nov 1992 | -0.6 |
| Jun–Nov 2003 | -0.5 |
| Oct 2009–Mar 2010 | -1.2 |
| Apr–Sep 2020 | 1.1 |
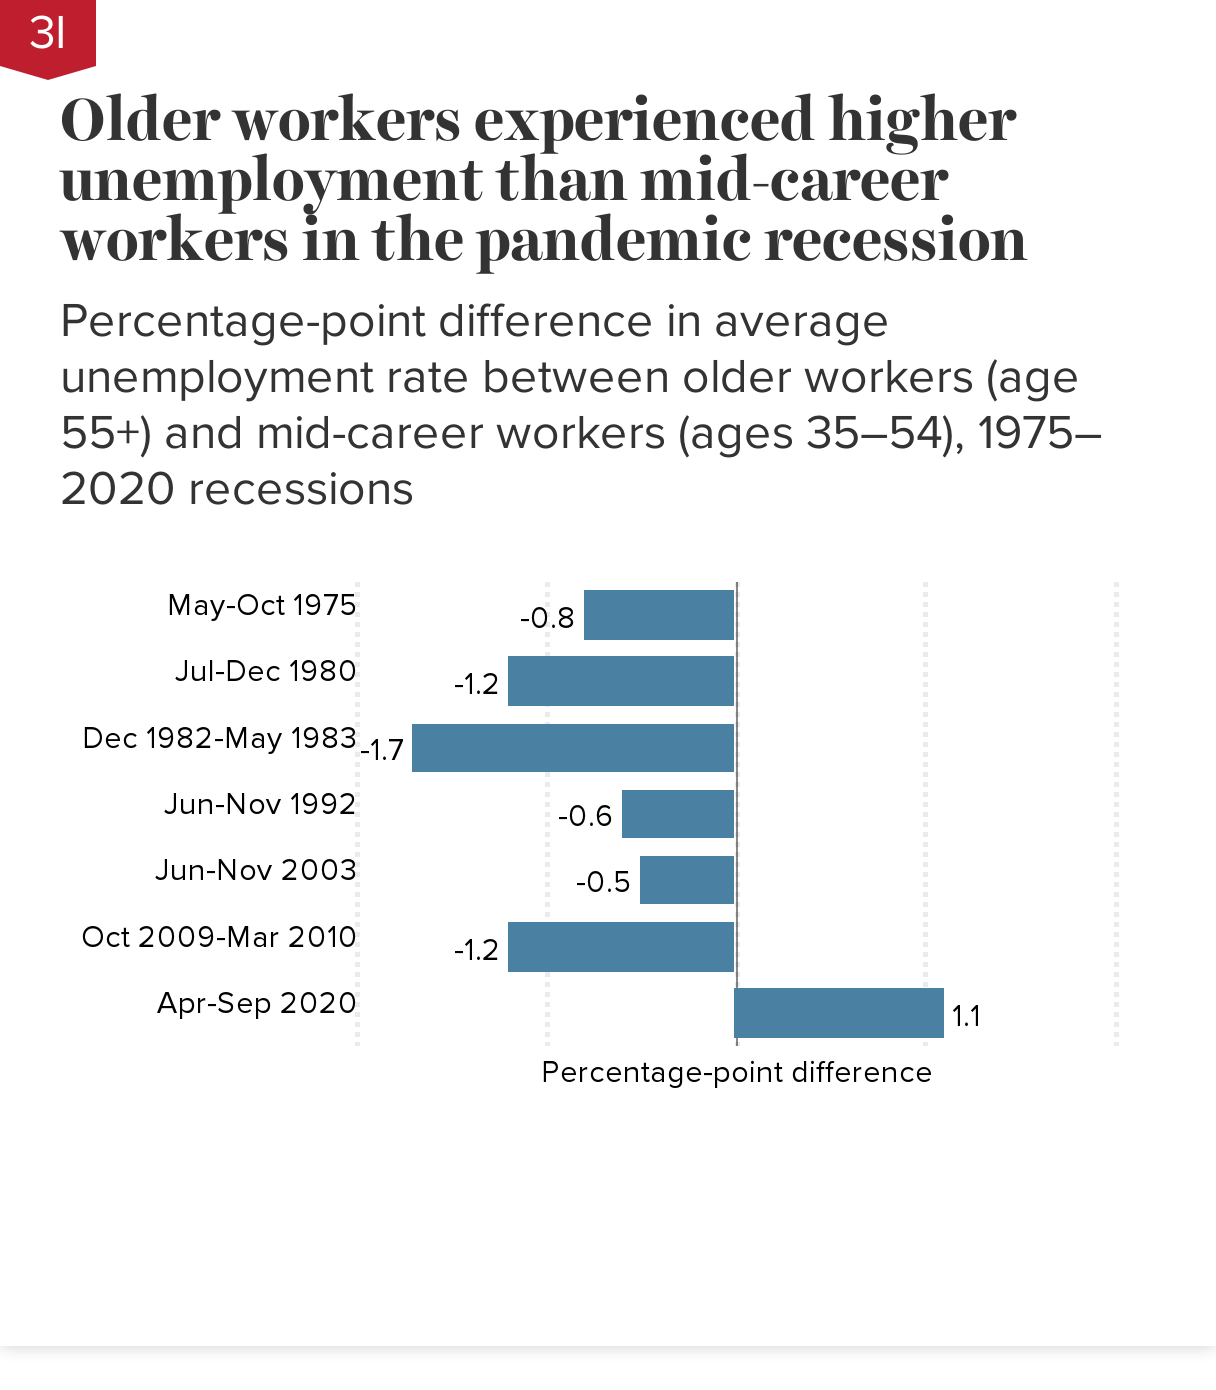
Notes: Chart shows the percentage-point difference (how much higher or lower the average unemployment rate of older workers age 55+ is relative to that of mid-career workers ages 35–54) over six-month periods beginning in the month of peak unemployment in each recession.
Source: Economic Policy Institute (EPI) and Schwartz Center for Economic Policy Analysis (SCEPA) analysis of Current Population Survey microdata (Flood et al. 2021).
The recession triggered by the COVID-19 pandemic was highly unusual in that older workers suffered greater job losses than mid-career workers. In the six-month period from April to September 2020, the unemployment rate for workers age 55 and older averaged 9.7% (not shown in the chart), more than a percentage point higher (+1.1 ppts) than the 8.6% unemployment rate for workers ages 35–54. In contrast, from October 2009 to May 2010, the peak unemployment months of the Great Recession, the unemployment rate of older workers averaged 7.0%, 1.2 percentage points lower than the 8.2% unemployment rate of mid-career workers.
In typical recessions, older workers are less likely to be laid off than mid-career workers because they usually have more work experience and seniority. These factors offered less protection during the pandemic, since pandemic job losses were driven by the mass shutdown of nonessential sectors and a shift in consumer spending from services to goods.
Pandemic job losses among workers 65 and older were steep and persistent: Percentage changes in employment rates from pre-pandemic peaks, by age group, February 2020–August 2022
| Year | Ages 35–54 | Ages 55–64 | Age 65+ |
|---|---|---|---|
| Feb-2020 | 0.0% | 0.0% | 0.0% |
| Mar-2020 | -0.7% | -0.7% | -4.5% |
| Apr-2020 | -11.8% | -11.8% | -18.6% |
| May-2020 | -9.6% | -9.6% | -18.1% |
| Jun-2020 | -6.9% | -7.7% | -14.9% |
| Jul-2020 | -6.6% | -7.2% | -12.0% |
| Aug-2020 | -4.9% | -5.7% | -10.6% |
| Sep-2020 | -5.1% | -5.1% | -7.6% |
| Oct-2020 | -4.2% | -4.0% | -6.6% |
| Nov-2020 | -4.0% | -4.9% | -6.3% |
| Dec-2020 | -4.3% | -5.2% | -8.8% |
| Jan-2021 | -4.6% | -5.9% | -11.1% |
| Feb-2021 | -4.6% | -4.2% | -12.8% |
| Mar-2021 | -4.1% | -3.3% | -11.4% |
| Apr-2021 | -4.2% | -3.3% | -9.9% |
| May-2021 | -4.0% | -2.2% | -10.3% |
| Jun-2021 | -4.1% | -3.5% | -11.8% |
| Jul-2021 | -3.3% | -3.6% | -12.1% |
| Aug-2021 | -2.8% | -3.1% | -8.9% |
| Sep-2021 | -2.0% | -1.9% | -6.3% |
| Oct-2021 | -1.8% | -2.1% | -7.0% |
| Nov-2021 | -1.2% | -2.2% | -6.0% |
| Dec-2021 | -1.1% | -1.9% | -5.3% |
| Jan-2022 | -1.5% | -1.8% | -7.7% |
| Feb-2022 | -0.9% | -1.1% | -5.9% |
| Mar-2022 | -0.1% | -0.1% | -7.0% |
| Apr-2022 | -0.4% | -0.4% | -7.4% |
| May-2022 | -0.3% | -0.2% | -6.1% |
| Jun-2022 | -1.0% | -1.5% | -7.8% |
| Jul-2022 | -1.0% | -1.0% | -7.4% |
| Aug-2022 | -0.3% | -1.7% | -5.8% |
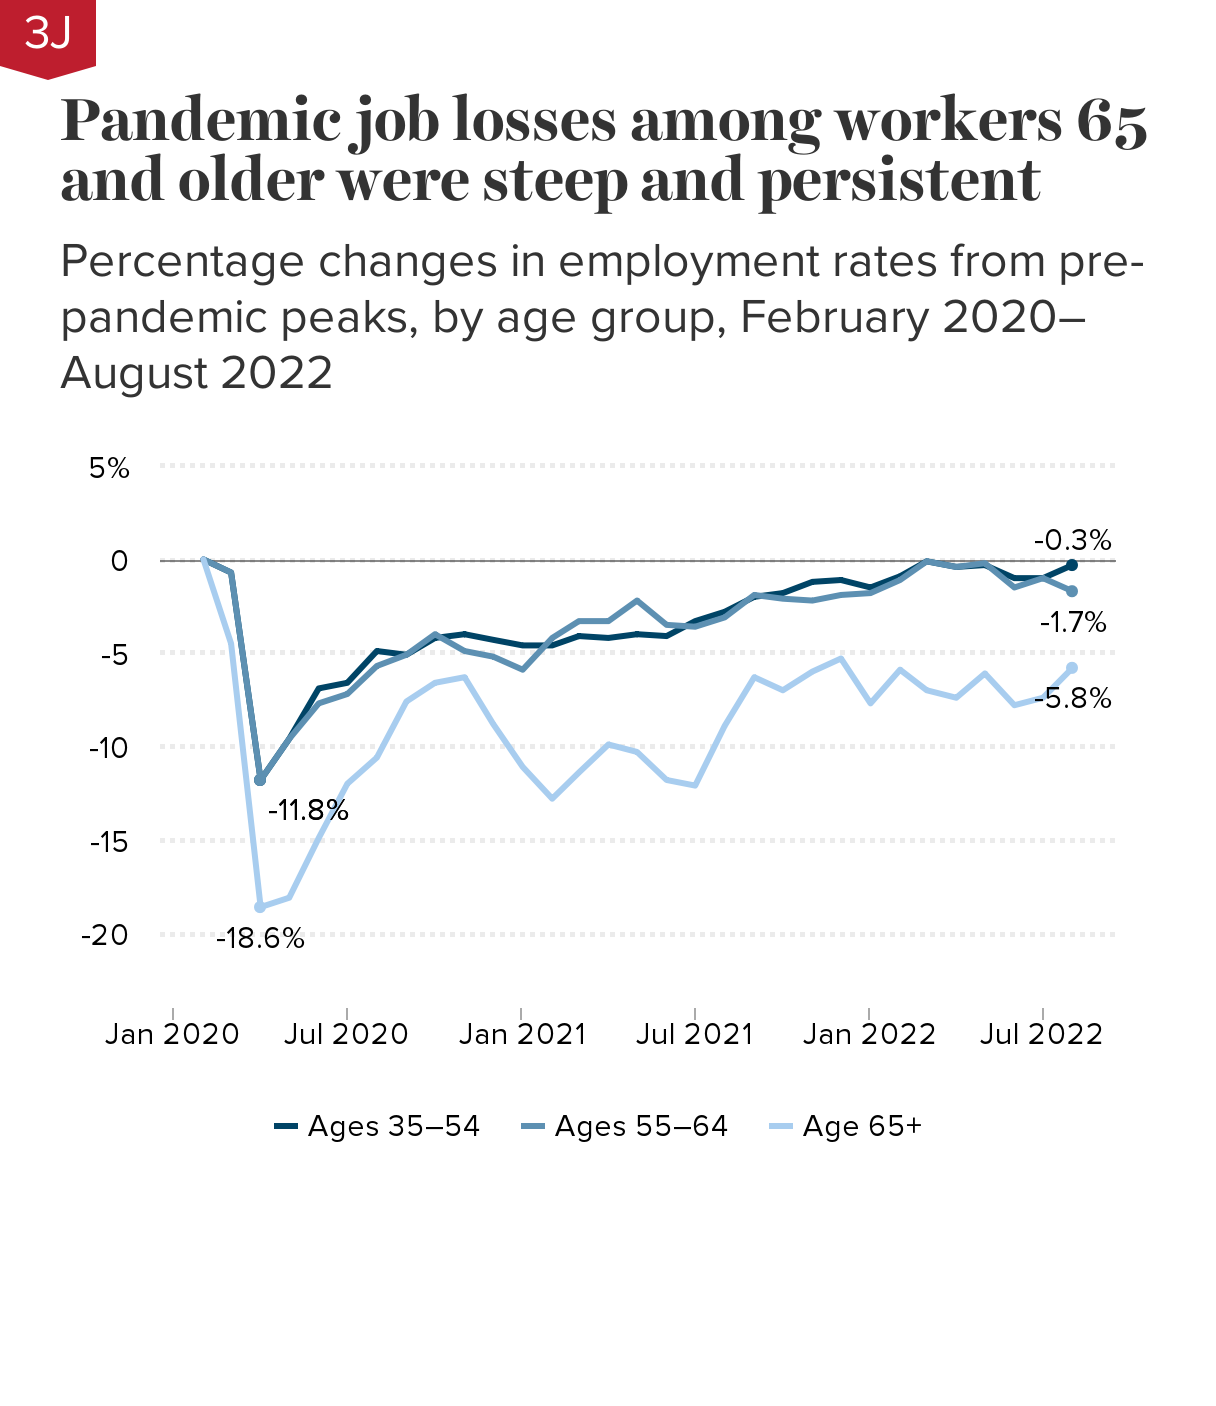
Note: Chart shows percentage changes in employment-to-population ratios relative to February 2020, the peak month of economic activity before the pandemic recession.
Source: Economic Policy Institute (EPI) and Schwartz Center for Economic Policy Analysis (SCEPA) analysis of Current Population Survey microdata (Flood et al. 2021).
The employment rate of seniors age 65 and older plummeted 18.6% between February and April 2020, an even steeper drop than that experienced by mid-career workers ages 35–54 and older workers ages 55–64, who both experienced 11.8% declines in employment rates.
Employment losses among workers age 65 and older were also more persistent than those of younger workers. The employment rate of mid-career workers had essentially recovered by August 2022; that of older workers ages 55–64 was only slightly below its pre-pandemic level (-1.7%). However, the employment rate of seniors remained -5.8% below its pre-pandemic level two and a half years later.
Some of the employment decline among older workers reflected an increase in retirements. Older workers in part-time jobs, or in occupations characterized by high physical proximity to other workers or to customers, were especially likely to call it quits (Davis 2021). For these workers, COVID disruptions, health and safety concerns, caregiving responsibilities, rising net worth, or other factors tipped the balance in favor of retirement. But for the majority of older workers, leaving the labor force was triggered by job loss (Davis and Radpour 2021).
Most unemployed older workers returned to the workforce, aided by a rapid recovery brought about by stimulus checks, expanded unemployment insurance, and other timely countercyclical measures enacted by Congress (CBPP 2022). Though the pandemic recession had an unusually severe impact on older workers, these workers would likely have fared much worse in a slower recovery with fewer supports for unemployed workers and their families, especially since unemployed workers in their 50s and older tend to remain out of work longer than young or mid-career workers (Johnson and Butrica 2012; Johnson and Gosselin 2018).
Non-college-educated older workers saw greater job losses than their college-educated counterparts during the pandemic recession: Percentage changes in employment rates by age and education, February–April 2020
| Employment percent change | |
|---|---|
| No college degree | -13.9% |
| Bachelor’s degree or more | -9.2% |
| No college degree | -21.0% |
| Bachelor’s degree or more | -15.6% |
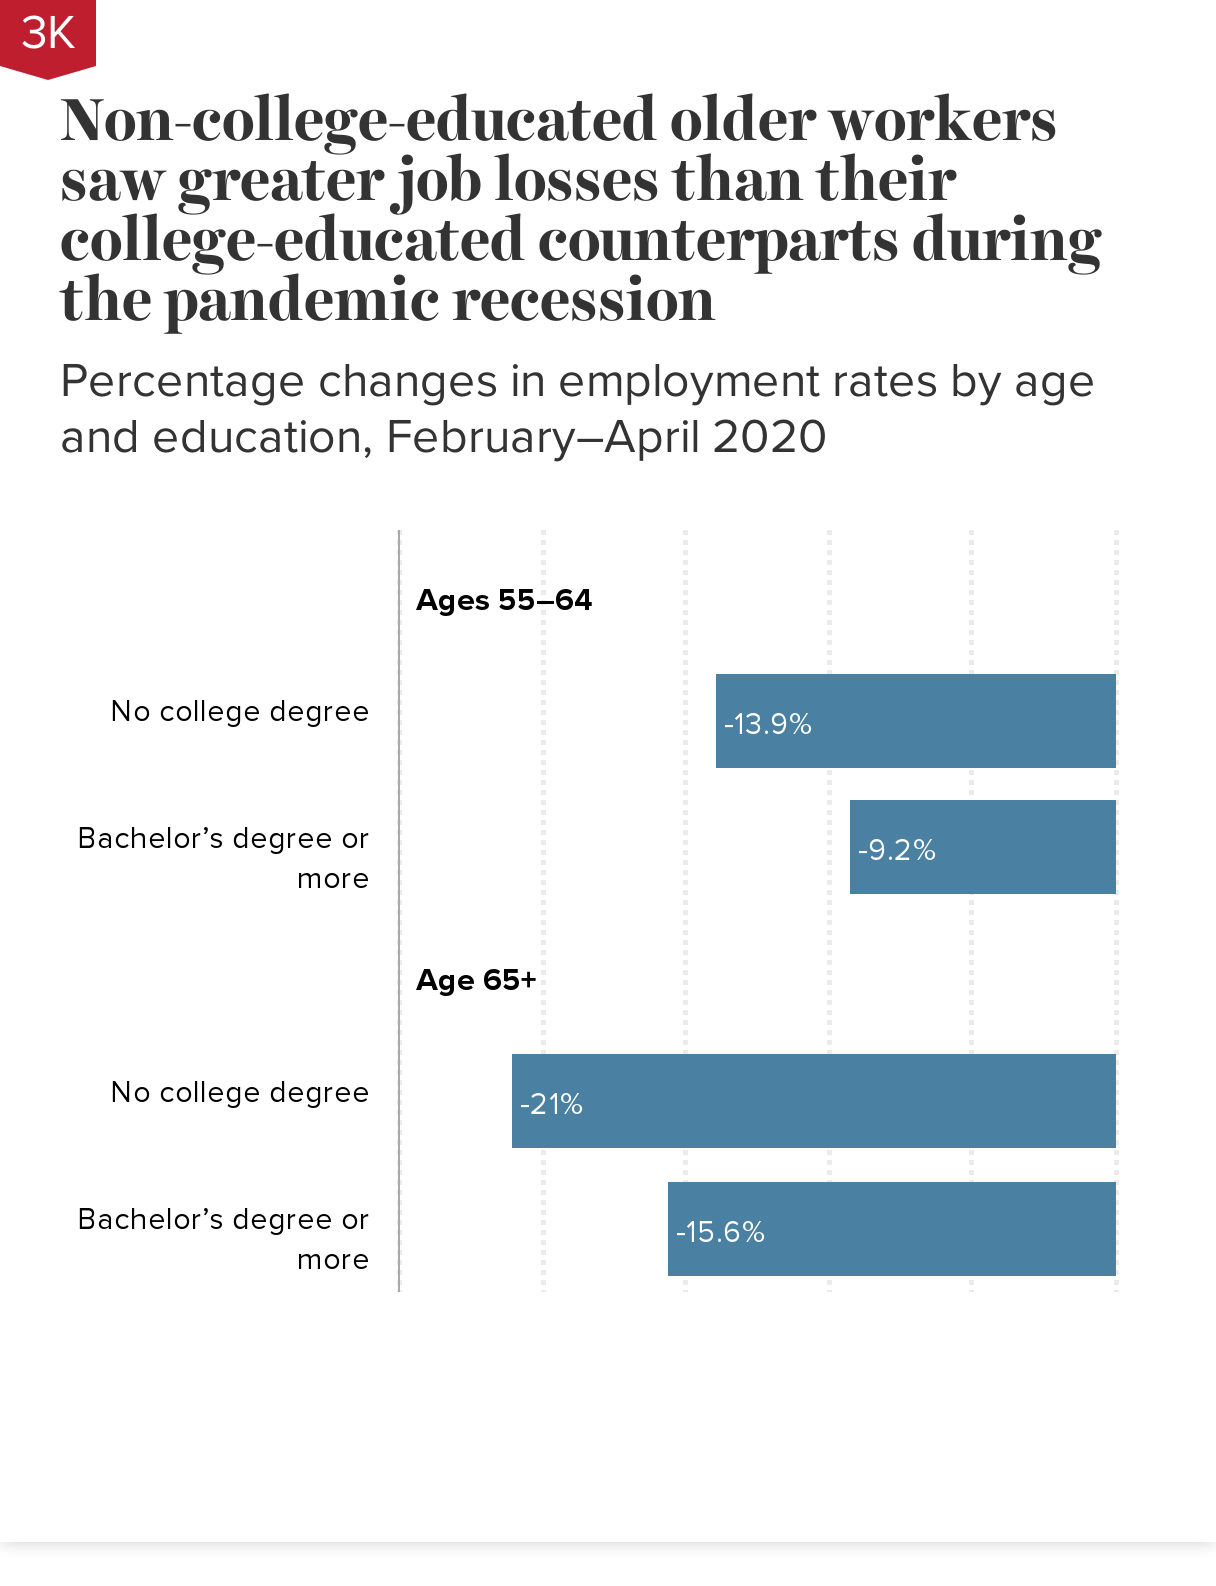
Note: Chart shows the percentage change in the employment-to-population ratio from February 2020, the month before the pandemic recession, to April 2020, the trough of the recession.
Source: Economic Policy Institute (EPI) and Schwartz Center for Economic Policy Analysis (SCEPA) analysis of Current Population Survey microdata (Flood et al. 2021).
When the pandemic recession hit in early 2020, older workers without bachelor’s degrees experienced greater job losses than their college-educated counterparts. The most affected were workers over 65 without college degrees, one in five (21.0%) of whom found themselves out of work.
While many white-collar workers have been able to work from home during the pandemic, most non-college-educated workers in service-sector jobs did not have that option (Gould 2020a). Many of these workers were laid off or furloughed. Those who remained in the workforce were more likely to be exposed to COVID-19 health risks. These risks were particularly acute for older workers in meatpacking, caregiving, and other low-paid service jobs often deemed “essential” but not adequately compensated or protected (Hassan 2021; Farmand et al. 2020; Lewis 2021).
Though job losses were highest among workers 65 and older and among older workers without college degrees, some professional occupations, including teachers and nurses, have seen waves of early retirements due to deteriorating working conditions during the pandemic (Barnes 2022; Zhavoronkova et al. 2022).