• About
    • About EPI
    • Events
    • Newsletter
    • Newsroom
    • Support our work
      • EPI40 – Celebrating 40 years as the working peoples’ think tank
      • Ways to give
      • Impact report
      • Donate
  • Areas of Research
    • Unions and Labor Standards
    • Jobs and Unemployment
    • Race, Ethnicity, and the Economy
      • State Unemployment by Race and Ethnicity
      • Advancing anti-racist research & policy
    • Immigration
    • Minimum Wage
    • Education
    • Federal Policy Watch
    • Child Labor
    • Inequality and Poverty
    • Retirement
    • Trade and Globalization
    • Budget, Taxes, and Public Investment
    • Economic Growth
    • Health
    • Regulation
    • Wages, Incomes, and Wealth
  • Data Library
  • Publications
  • Resources
    • Family Budget Calculator
    • Wage Calculator
    • Child care costs in the United States
    • CEO pay
    • Productivity–Pay Gap
    • Minimum Wage Tracker
    • U.S. workers’ rights preemption map
    • Economic Indicators →
      • Jobs and Unemployment
      • State Unemployment by Race and Ethnicity
      • Unemployment Insurance (UI) Claims
      • JOLTS analysis
      • Data accountability dashboard
      • Low Wage Workforce Tracker
      • Company Wage Tracker
    • EARN →
      • Holding the line: State solutions to the U.S. worker rights crisis
      • Rooted in Racism
      • Immigrant workers in your state
      • Federal workers in your state
      • Workers’ rights preemption in the U.S.: A map of the campaign to suppress workers’ rights in the states
      • State unemployment by race and ethnicity
    • Anti-racist Policy Research
    • Federal Policy Watch →
      • How many federal workers live in your state?
      • 47 ways Trump has made life less affordable in his first year back in office
      • 100 days, 100 ways Trump hurt workers
    • Tax & Spending Explorer
    • Projects →
      • Unequal Power
      • Building Worker Power
      • State of Working America
    • Social Media Toolkit
    • View all
  • Blog
  • Donate

The Cost of Deportations Calculator

The Trump administration is taking billions of taxpayer dollars to pay for mass deportations.

What could this money be used for instead?

The 2025 Republican tax and spending megabill (the OBBBA) enabled the Trump administration to take your taxpayer dollars to pay for mass deportations. This calculator helps you see what the money could have funded instead through the remainder of Trump’s term.

This calculator developed in partnership with


Institute for Policy Studies logoShared Future logoThe University of Oregon Labor Center logo


Frequently asked questions

How do I use the Cost of Deportations Calculator?

When you first view the Cost of Deportations Calculator, it is populated with data at the federal level, or for the entire country. To drill down to the spending in your area:

  1. Select your state name from the dropdown. The calculator will repopulate with the tax dollars from your selected state that are being spent on deportations, and what that amount of money could be spent on instead in the various categories.
  2. To get even more local, select your county, congressional district, or city from the second dropdown. The calculator will repopulate with the tax dollars from your selected locality that are being spent on deportations, and what that amount of money could be spent on instead.
  3. To see more categories, click the ➕ symbol at the bottom of the calculator.
What does the Cost of Deportations Calculator do?

The Cost of Deportations Calculator shows you how much U.S. taxpayer money is being spent on mass deportations through the remainder of Trump’s term at the national, state, county, congressional district, city, and average federal taxpayer level.

It also shows what that money could be spent on—such as teachers, nurses, firefighters, veterans’ health care, and nutritional support—instead. For each option, it shows what the full amount being spent on mass deportations could fund.

Can I see how much of MY taxes pay for mass deportations?

Yes! The average amount per taxpayer appears in the dark box at the top of the calculator, immediately after the large number (representing the total amount spent in the country, your state, county, congressional district, or town). This is the average per taxpayer for the area selected. Every taxpayer’s situation will be different.


For researchers

Where can I get the full dataset for the Cost of Deportations Calculator?

If you are an academic, student, non-profit researcher or advocate, or a journalist, you may download and use all the Cost of Deportations Calculator related materials without requesting permission.

This is permitted under a non-commercial use Creative Commons license CC BY-NC-SA 4.0.

If you are a commercial enterprise looking to incorporate the Cost of Deportations Calculator data in any product that will be sold or as part of services and data you provide to paying customers, you may request commercial use by contacting EPI.

Download the Cost of Deportations full dataset

Here’s our suggested citation: Economic Policy Institute. 2026. The Cost of Deportations Calculator.

What is the methodology EPI economists and their partners used to create the Cost of Deportations Calculator?

The Cost of Deportations Calculator’s technical documentation outlines the methodology and defines the areas, and various components of the calculator. Any updates to the methodology will be released at the same time as the calculator data.

Read the methodology and technical documentation.


Additional resources

Download the full dataset for the Cost of Deportations Calculator.

Methodology + technical documentation.


Source: Economic Policy Institute Cost of Deportations Calculator, © August 2026.

Understanding immigration

The Cost of DHS Attacks on Immigrants

June 25, 2026

Immigration enforcement won’t just hurt immigrants—it will follow their classmates into public schools too

Hilary Wething June 30, 2026

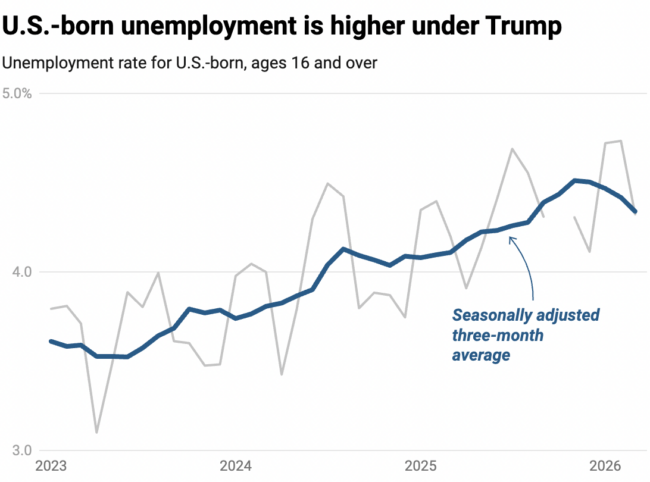
Unemployment has increased for U.S.-born workers in the face of mass deportations: Trump’s draconian immigration enforcement is harming all workers

Daniel Costa and Ben Zipperer April 3, 2026

We envision an economy that is just and strong, sustainable, and equitable--where every job is good, every worker can join a union, and every family and community can thrive.

EPI is a leader in the movement for economic justice. We use the tools of economics to win policy change that advances power for workers, economic security for families, and racial and gender equity in our nation.

EPI's rigorous research and transformative ideas fortify worker organizing, build a shared understanding of how power and policy shape economic outcomes, and drive progressive policy change at every level of government.

1225 Eye St. NW, Suite 600
Washington, DC 20005
Phone: 202-775-8810 • epi@epi.org


© 2026 Economic Policy Institute • Privacy Policy

Projects
State of Working America Data Library

Accessible, up-to-date data on the living standards of workers in the United States.

Economic Analysis and Research Network • EARN

The state and local network of organizations improving workers' lives through research and advocacy.

Program on Race, Ethnicity, and the Economy • PREE

Exploring how race, ethnicity, and class intersect to affect economic outcomes in the United States.

Tax & Spending Explorer

How do taxes and spending work, and where do you fit in?

Why give to EPI | Donate

EIN 52-1368964


About EPI
Newsroom
Contact us

The Economic Policy Institute staff is unionized with the Nonprofit Professional Employees Union.