Figure A
Employment growth strong in sectors with faster wage growth: Year-over-year changes in employment and wages, April 2021 to April 2022, by sector
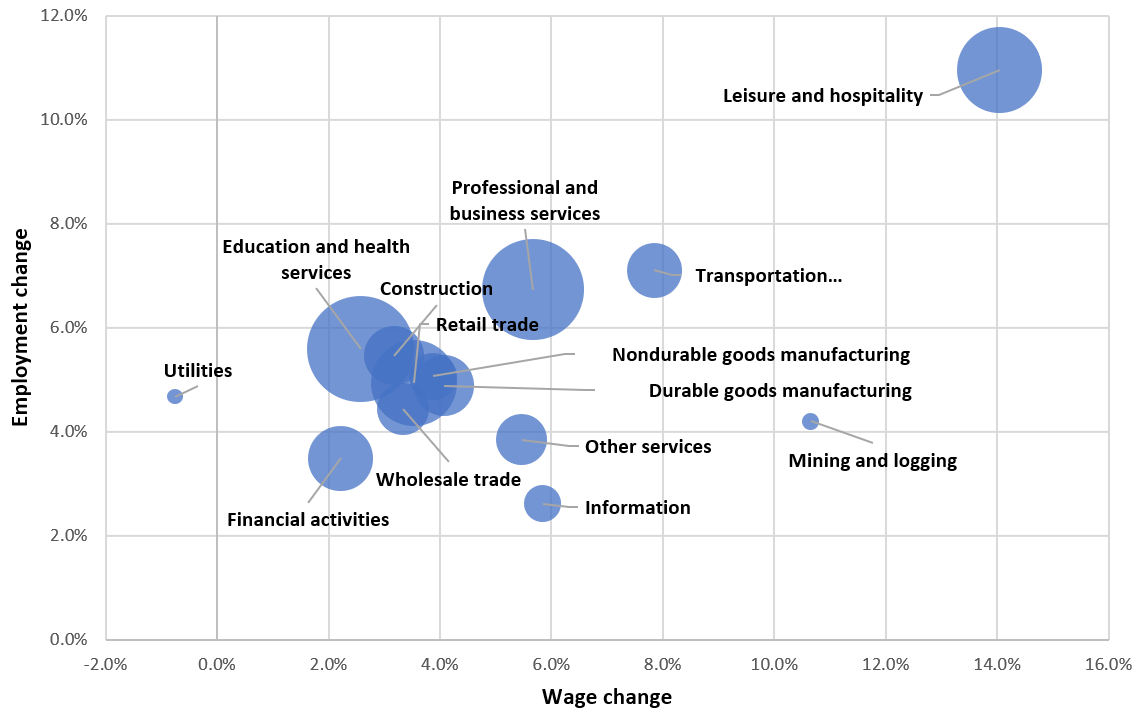

Notes: Bubbles are proportional to the employment level in each sector for April 2022.
Source: EPI analysis of Bureau of Labor Statistics' Current Employment Statistics public data series.
This chart appears in:
Previous chart: « Accommodation and food services, hires and quits rates, 2000–2022