What to watch on jobs day: The labor market is strong, not overheating
On Friday, the Bureau of Labor Statistics (BLS) will release the latest numbers on the state of the labor market. Along with rising payroll employment and increases in labor force participation as workers enter or return to the labor market, I will continue to watch nominal wage growth. While some have pointed to fast nominal wage growth as a source of concern in the U.S. economy, this is largely misplaced. Instead, nominal wage growth continues to dampen, not amplify, inflationary pressures, and it has actually decelerated in recent months. And, nominal wage growth running faster than pre-pandemic rates has managed to provide a useful spur to hiring in sectors that were most damaged by the pandemic shock.
Over the last year, in a welcome change, wage growth has been faster at the lower end of the wage distribution, as the labor market has improved and employers try to attract and retain the workers they want. At the same time, employment has grown dramatically because Congress made fiscal investments at the scale of the problem, and employment in the private sector is now within 1% of pre-pandemic levels. While some complain that any wage growth faster than pre-pandemic rates is a sign of damaging labor shortages that are constraining growth, this doesn’t fit the facts. At a macroeconomic level, the economy continues to absorb new workers at historically high rates. And across industries, there is no evidence that fast wage growth is constraining job growth.
Figure A below examines the change in employment and wages over the last year, comparing April 2022 with April 2021. The horizontal axis reports changes in wages over the last year while the vertical axis reports changes in employment; the size of each bubble is proportionate to the employment level in each section, with larger bubbles representing larger sectors in the U.S. economy. For many sectors, particularly the larger ones, it appears that there’s a positive relationship between faster wage growth and faster employment growth, which runs counter to the claims of employers not being able to find workers.
Claims of labor shortages in leisure and hospitality, for instance, do not seem to be dragging on employment growth in that sector. Yes, employers are having to work harder in this sector to attract and retain the workers they want. We see evidence of this in faster wage growth, particularly faster wage growth through fall 2021. That growth has already begun to slow. But the important point that seems be missing from the conversation is that job growth continued to be strong in leisure and hospitality through the last year. While wage growth was in the double-digits, so was employment growth. Although leisure and hospitality is still facing the largest employment shortfall, employment is now within 10% of its pre-pandemic level and has been steadily closing that gap every month. In short, there is little to be feared about the pockets of wage growth strength in the U.S. economy, since they are accompanied by strong job growth. It’s difficult to see the downside of both jobs and wages growing at a faster rate coming out of a deep recession.
Employment growth strong in sectors with faster wage growth: Year-over-year changes in employment and wages, April 2021 to April 2022, by sector
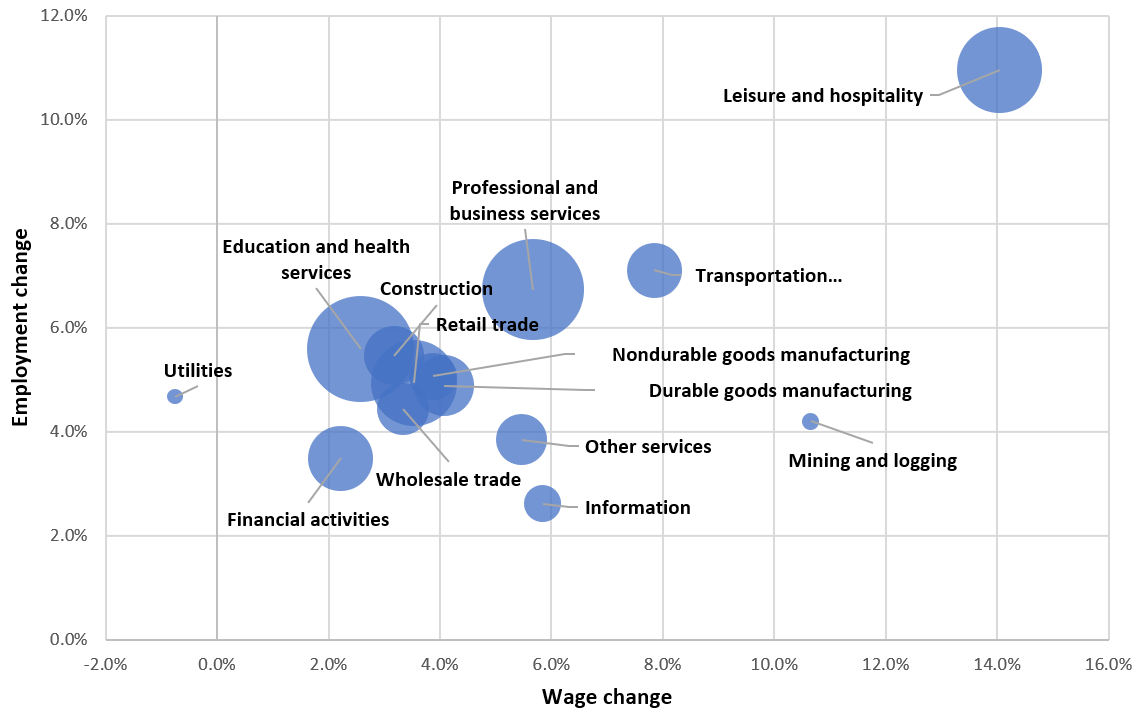

Notes: Bubbles are proportional to the employment level in each sector for April 2022.
Source: EPI analysis of Bureau of Labor Statistics' Current Employment Statistics public data series.
The mild deceleration in wage growth in leisure and hospitality in recent months is also found in the private sector at large. Figure B looks at private-sector nominal hourly wage growth using three different time periods. First, in dark blue, is year-over-year nominal wage growth, which shows that wages over the last year grew 5.5%. While this continues to be fast by historical standards, the other two measures, which look at what’s happened more recently, illustrate a bit of a deceleration. The lightest blue line measures the monthly change, from March 2022 to April 2022, reported on an annualized basis. While this line is the most volatile, it shows a decidedly slower monthly rate of wage growth of 3.8%, on an annualized basis, than the year-over-year measure. The third line illustrates the annualized quarterly change in wages, the latest point comparing the change in wages from the average of November 2021–January 2022 with the average of February–April 2022. Not only does this smooth out some of the data, but it also illustrates the deceleration more clearly over 2022 so far.
In Friday’s jobs report, I will look for additional evidence of this deceleration as well as further confirmation that employers continue to add to their payrolls, even in sectors where employers are complaining the loudest about labor shortages.
OLD Nominal wage growth in average hourly earnings for all workers in three measures, year-over-year, annualized quarterly, and annualized monthly changes
| Year-over-year change | Annualized quarterly change | Annualized monthly change | |
|---|---|---|---|
| Jan-2019 | 3.3% | 3.5% | 1.8% |
| Feb-2019 | 3.6% | 3.8% | 4.4% |
| Mar-2019 | 3.5% | 3.7% | 4.4% |
| Apr-2019 | 3.3% | 3.4% | -0.9% |
| May-2019 | 3.3% | 2.8% | 3.1% |
| Jun-2019 | 3.4% | 2.3% | 3.9% |
| Jul-2019 | 3.4% | 2.6% | 3.9% |
| Aug-2019 | 3.4% | 3.3% | 4.4% |
| Sep-2019 | 3.1% | 3.6% | 0.9% |
| Oct-2019 | 3.2% | 3.3% | 3.5% |
| Nov-2019 | 3.4% | 3.0% | 5.2% |
| Dec-2019 | 2.9% | 3.1% | 0.8% |
| Jan-2020 | 3.0% | 3.1% | 2.6% |
| Feb-2020 | 3.1% | 3.0% | 5.6% |
| Mar-2020 | 3.6% | 4.0% | 10.1% |
| Apr-2020 | 8.0% | 10.8% | 64.5% |
| May-2020 | 6.7% | 15.6% | -11.4% |
| Jun-2020 | 5.1% | 16.3% | -13.3% |
| Jul-2020 | 4.9% | 5.2% | 2.1% |
| Aug-2020 | 4.8% | -1.2% | 2.9% |
| Sep-2020 | 4.8% | -3.0% | 1.2% |
| Oct-2020 | 4.6% | 0.2% | 0.8% |
| Nov-2020 | 4.6% | 2.0% | 5.0% |
| Dec-2020 | 5.5% | 3.2% | 11.5% |
| Jan-2021 | 5.3% | 4.5% | 0.4% |
| Feb-2021 | 5.2% | 5.5% | 4.5% |
| Mar-2021 | 4.4% | 4.2% | 0.8% |
| Apr-2021 | 0.6% | 3.6% | 5.7% |
| May-2021 | 2.2% | 3.3% | 6.5% |
| Jun-2021 | 4.0% | 4.7% | 6.5% |
| Jul-2021 | 4.3% | 5.7% | 6.1% |
| Aug-2021 | 4.3% | 6.0% | 3.6% |
| Sep-2021 | 4.8% | 5.7% | 6.4% |
| Oct-2021 | 5.4% | 5.5% | 7.6% |
| Nov-2021 | 5.3% | 5.8% | 4.7% |
| Dec-2021 | 4.9% | 6.1% | 5.9% |
| Jan-2022 | 5.4% | 6.1% | 7.1% |
| Feb-2022 | 5.2% | 5.6% | 1.5% |
| Mar-2022 | 5.6% | 5.2% | 5.8% |
| Apr-2022 | 5.5% | 4.5% | 4.2% |
| May-2022 | 5.3% | 4.5% | 4.6% |
| Jun-2022 | 5.1% | 4.3% | 3.8% |
Source: EPI analysis of Bureau of Labor Statistics Current Employment Statistics public data series
Enjoyed this post?
Sign up for EPI's newsletter so you never miss our research and insights on ways to make the economy work better for everyone.