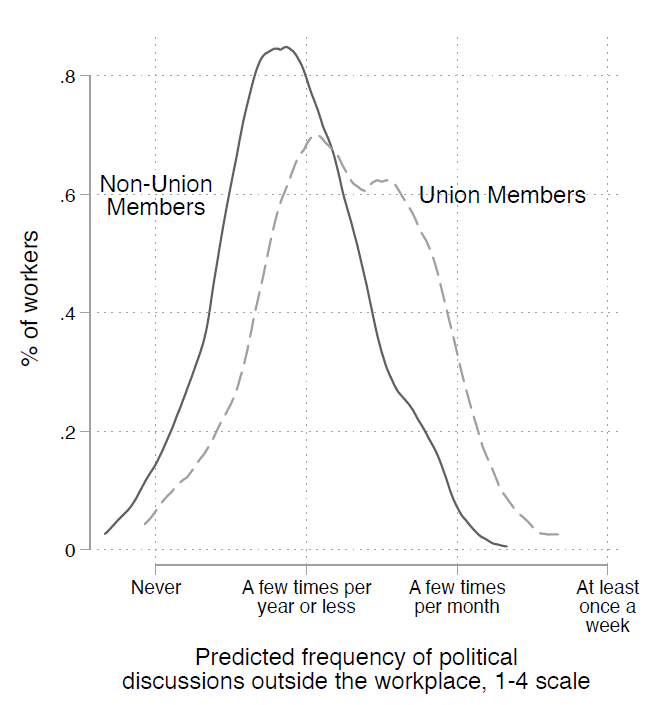
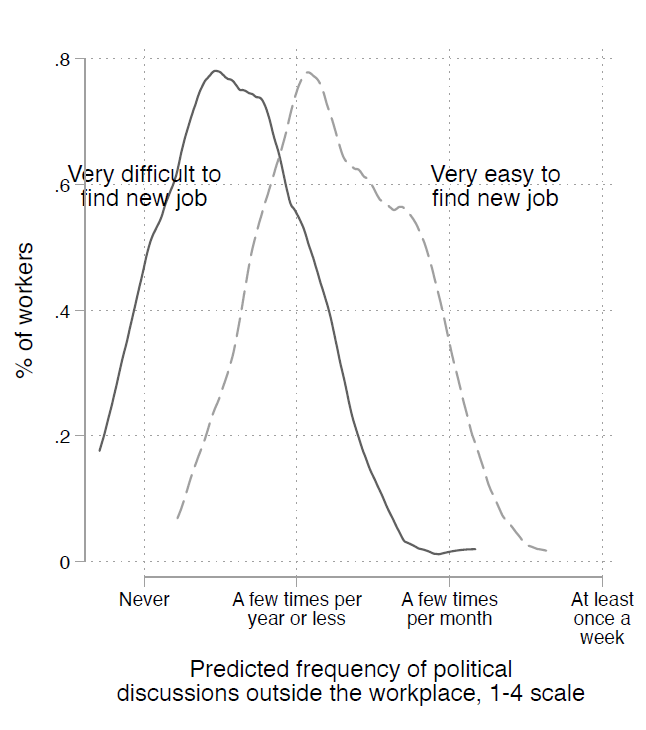
Figure IPredicted frequency of nonwork political discussions, by union membership and labor market power Notes: The two figures adjust for other worker and job-related characteristics. Source: 2019 Workplace Political Participation Study. Share on Facebook Tweet this chart EmbedCopy the code below to embed this chart on your website.<iframe width="100%" height="460" src="https://www.epi.org?p=211208&view=embed&embed_template=charts_v2013_08_21&embed_date=20260618&onp=211208&utm_source=epi_press&utm_medium=chart_embed&utm_campaign=charts_v2" frameborder="0"></iframe> Download image This chart appears in: Previous chart: « part 2 Next chart: More evidence the Trump tax cuts aren’t working as advertised: Change in real, nonresidential fixed investment shows no investment boom »