Part of the series Labor Day 2019: How Well Is the American Economy Working for Working People?
The fact that the unemployment rate has averaged 3.8% over the past year (its lowest 12-month average since 1970) might make one think that times are flush for American workers and that there is widespread agreement that the U.S. economy is being well managed by elected officials. But while times are better for workers today than they were 10, five, or even three years ago, a crucial ingredient for workers’ well-being—faster-growing wage growth—still hasn’t appeared. This wage failure might be why the public seems unwilling to give President Trump (and his Republican supporters in Congress) credit as good economic managers despite today’s low unemployment rate. In fact, the president and his supporters in Congress are responsible for a number of policy decisions that will reliably harm workers’ future prospects for wage growth.1
Decent wage growth doesn’t just happen—policymakers have to make it a priority
Broadly speaking, typical workers need two things for a chance at decent wage growth over the long run: (1) tight labor markets where employers go begging for workers rather than vice versa, and (2) policy institutions that mitigate the huge power imbalance that gives employers an inherent advantage when bargaining over wages with workers.
Today, the labor market is tight by many measures, and that’s a major policy win—but it’s a victory that President Trump and his allies had next to nothing to do with. Further, even given today’s signs of labor market tightness, wage growth has not durably accelerated out of post–Great Recession doldrums.
This failure of wages to get in gear should tell us three things: (1) there remains room for unemployment to fall even further;2 (2) policy and labor market institutions have been turned decisively against most workers’ ability to bargain effectively for wage increases;3 and (3) if we don’t reorient these policies and institutions to support wage growth, workers will have to rely solely on high-pressure labor markets to see raises in the future—but these high-pressure labor markets have been the exception and not the rule for most of the time in recent decades.4 Policymakers who don’t address these concerns—like President Trump—are no friend to workers.
Tight labor markets are a necessary condition for decent wage growth
By far the strongest hand President Trump has to play in claiming credit for a decent economy is today’s low unemployment rate. But there is no serious policy case that would justify this claim. To see why, let’s take a step back and look at what causes the unemployment rate to rise and fall.
The unemployment rate is driven by the interplay between aggregate demand (spending by households, businesses, and governments) and the economy’s productive capacity (the size of its labor force and capital stock). As spending rises, firms’ hiring grows. If firms’ demand for workers rises faster than the labor force grows, this reduces the unemployment rate. When spending falls (as during recessions), firms’ hiring slows or even contracts, even as the labor force holds steady, and this leads to rising unemployment rates.
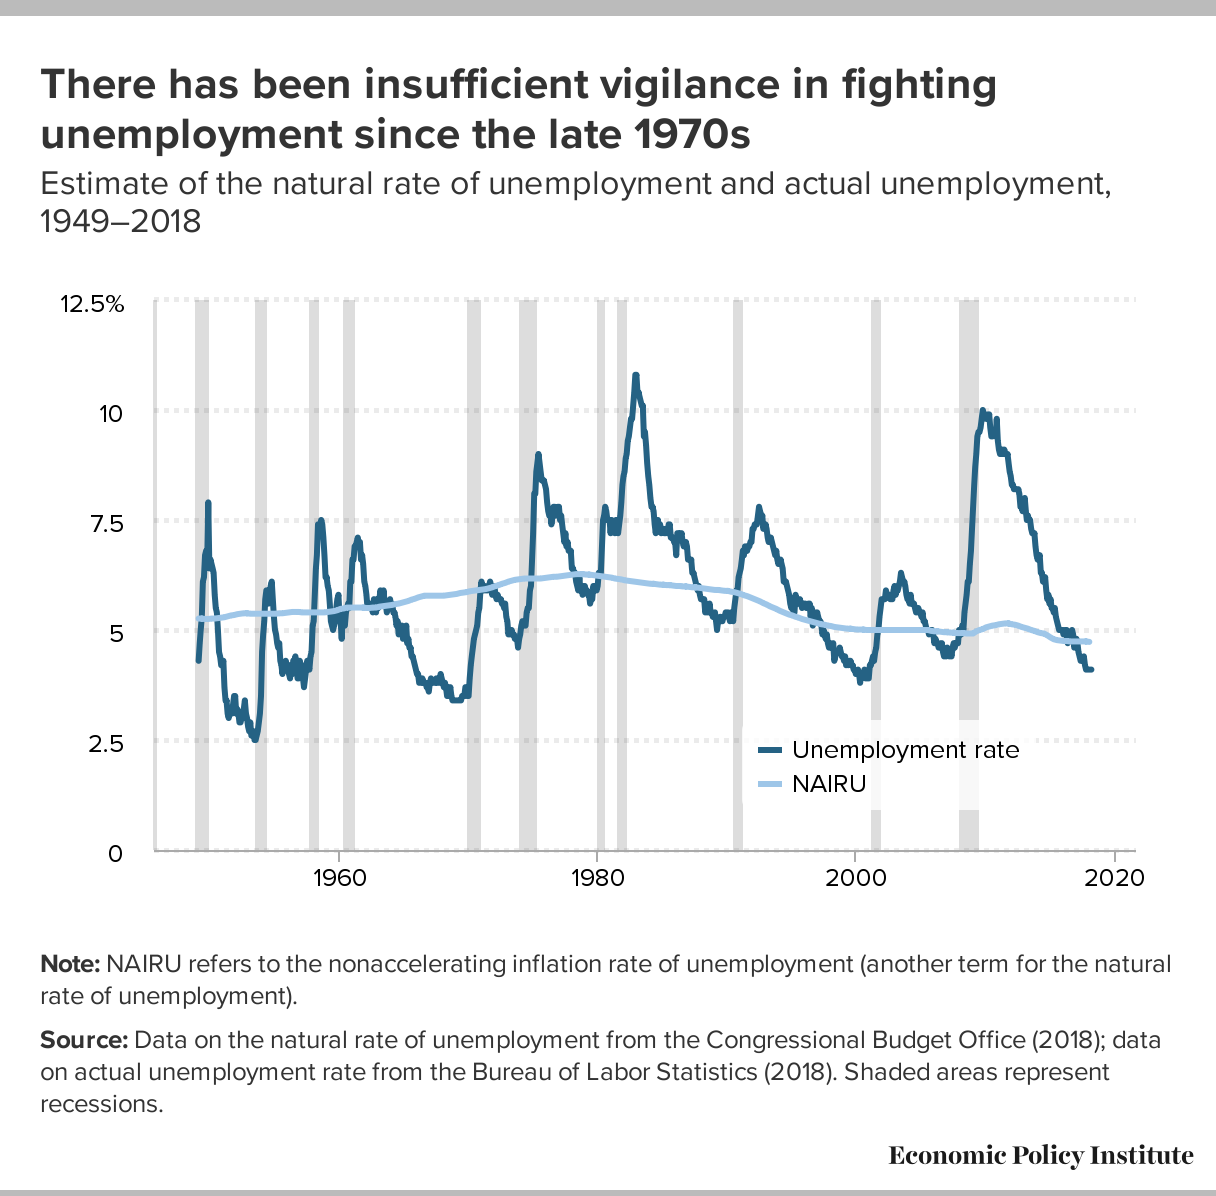
An analogy might help here: Think of the economy as a person and the pace of spending growth as calories. If spending rises too quickly, the danger is that the economy could become unhealthily overweight—manifesting as accelerating inflation. If spending rises too slowly, the danger is that the economy could become unhealthily undernourished—manifesting as rising unemployment. Beginning in the 1970s, economists thought the primary danger facing the U.S. economy was that it would become overweight, so the main job of policymakers was to keep the economy’s spending on a diet. In the decades before the Great Recession, this worry often led the Federal Reserve to raise interest rates and cut recoveries short in the name of avoiding too-fast growth that would cause inflation.
This excess fear of too-fast spending growth led the Fed to keep unemployment higher than it needed to be to be to keep inflation in check.5 Essentially, the Fed kept the economy on an unhealthy starvation diet for extended periods in the 1980s and 1990s. The resulting excess unemployment was a major contributor to the growing wedge between economywide productivity and typical workers’ pay—a wedge that is the root cause of the dramatic rise in inequality over this time.6
In Figure A, we divide the years from 1949–2017 into three groups: the 17 years with the lowest unemployment rates, the 17 years with the highest unemployment rates, and the remaining 34 years, in which unemployment rates are somewhere in the middle. We then calculate the degree to which productivity exceeded pay growth, on average, during each of those three groups of years. The results are clear: In the low unemployment years, productivity just slightly exceeded pay growth; in the medium unemployment years, the gap was significantly larger; and for the highest unemployment years, the gap was very large.
Today’s 3.7% unemployment rate is very good news in one respect: It indicates that we are at least not starving the U.S. economy of needed spending. That’s a good start! But there are two other crucial things to note about this low unemployment: It is not President Trump’s doing, and it is not sufficient for American workers’ long-run economic security.
When unemployment is low, pay growth keeps pace with productivity: Average annual difference between productivity growth and pay growth by years grouped into low, medium, or high unemployment, 1949–2017
| Annual average of difference between productivity and pay growth | |
|---|---|
| Lowest unemployment years | 0.09% |
| Medium unemployment years | 0.71% |
| Highest unemployment years | 1.26% |

Notes: Bars represent average annual difference between productivity growth and growth in hourly pay for typical workers for years with the highest, lowest, and medium unemployment rates from 1949 to 2017. Lowest unemployment group includes the 17 years with the lowest rates of unemployment in the 68-year sample, highest unemployment group includes the 17 years with the highest rates of unemployment in the sample, and medium unemployment group includes the 34 remaining years in the sample. The growth of the productivity–pay gap is highlighted in EPI’s productivity–pay tracker (epi.org/productivity-pay-gap).
Source: EPI analysis of unpublished Total Economy Productivity data from the Bureau of Labor Statistics (BLS) Labor Productivity and Costs program, wage data from BLS Current Employment Statistics, BLS Employment Cost Trends, BLS Consumer Price Index, Bureau of Economic Analysis National Income and Product Accounts, and BLS Current Population Survey public data
Today’s low unemployment rate is the result of progressive political movements—not Trump’s decisions
Today’s low unemployment rate is not due to anything President Trump has done since he took office. Instead, the low unemployment rate is essentially the continuation of a trend inherited by the Trump administration, with unemployment falling steadily in each year since 2010.
The remarkable thing about this trend is that the Federal Reserve broke sharply with past practice and never decisively stopped it in the name of guarding against possible inflation. In fact, the Fed refrained from raising interest rates even when unemployment dipped two full percentage points beneath estimates of the lowest sustainable unemployment rate made within the past decade.7
Why didn’t the Fed ever step in to keep unemployment from falling this low? Two reasons. First, progressive economists who have been arguing for years that unemployment was being kept at excess levels finally began persuading many of their peers, and the professional consensus on how the Fed should respond to very low unemployment decisively changed.8 The last Fed decision on interest rates, in July 2019, makes this point: The Fed cut rates with unemployment below 4%. This would have been unimaginable anytime before 2016. In the late 1980s, for example, the Fed began sharply raising rates when the unemployment rate hit 5.7%, while in 2004 they began raising rates when it hit 5.5%.
Second, a group of progressive organizers and advocacy groups representing workers and low-income communities decided to make influencing the Fed a primary effort. The result of this decision was the creation of the Fed Up campaign.9 The group started off by crashing the Kansas City Fed’s annual economic policy symposium in Jackson Hole, Wyoming, in August 2014.10 In subsequent years at the Jackson Hole conference, they organized a shadow conference, and then were invited to meet with Fed officials.11 The campaign was spectacularly successful in making policymakers realize that the Fed’s decisions should not be seen as the utterly neutral work of technocrats, but instead as changes that had strong distributional consequences. In short, these decisions were political, in the largest sense of the word, affecting who got what and how much in the American economy.
The economy’s relatively sufficient diet of calories today is almost entirely the result of these progressive efforts at influencing the Fed, and has essentially nothing to do with decisions made by President Trump or Congress in the past two years. In fact, as the Fed is deeply protective of its institutional independence and hugely reluctant to be seen caving to short-term political pressure, Trump’s constant public demands for interest rate cuts to help his reelection prospects have only made it harder for the Fed to keep monetary policy supportive of ever-lower unemployment.
We need to take bosses’ thumbs off the scale when wages are set
Having a well-fed economy that generates low unemployment is a great start. But we know that eating enough calories is a necessary but not sufficient condition for health. And for most American workers, the additional ingredients needed for economic health are policy measures that help balance the inherent asymmetry that characterizes bargaining over pay with their employers. A growing body of economic evidence has demonstrated that employers wield considerable leverage over workers when they bargain—either explicitly or implicitly—over pay.12
Some of this leverage is just inherent in the transaction of exchanging labor for pay: When a bargain fails, the worker will go without any earnings until a new job is found and a new deal is struck. For employers, the failed deal is far less damaging, since the firm’s income won’t fall to zero so long as there are other workers. Further, every potential labor market match that fails because employers refuse to pay higher wages actually serves a useful purpose for these employers, demonstrating their resolve to other workers that the firm will not budge on pay.
Throughout the twentieth century, a number of policies and institutions were created to help rectify this imbalance, collective bargaining and minimum wages being key among them. But these institutions have been under steady attack from conservative policymakers for decades. Worse, new institutions that intentionally disempower workers have sprung up: These include noncompete agreements that keep workers from finding new work in their chosen field if they quit their current employer, forced arbitration agreements that cut off workers’ access to the courts if their employer violates their rights, the misclassification of employees as independent contractors, no-poaching clauses that keep franchise owners from hiring each others’ workers, explicit employer cartels that fix pay and forbid competing over workers, and an immigration policy framework aimed at depriving large swaths of the workforce from exercising their basic rights as workers.13
This long-run attack on workers’ relative bargaining position helps explain both the rise in inequality and the relatively muted response of wage growth to recent low unemployment rates. Figure B shows actual growth of nominal wages as well as a regression-generated prediction of wage growth given the unemployment rate and the expected pace of inflation. Essentially the regression uses contemporaneous data on unemployment and expected inflation and then uses this data to predict wage growth given historical relationships between these variables. The regression, however, is run only on years before 2008, so it is predicting wage growth based on pre-2008 relationships between unemployment and wage growth.
As the figure shows, the forecast predicts wage growth very well before the Great Recession—with predicted wage growth nearly identical to actual wage growth in all quarters. From 2009 and 2011, however, given very high unemployment and very low inflation, the forecast predicted much slower wage growth than actually happened. This is almost surely due to downward nominal wage rigidity—the fact that employers and employees strongly prefer to not see nominal wage cuts. More importantly for the present argument, however, is the last couple of years in the figure, where predicted wage growth is strongly above actual wage growth. This provides some empirical validation for the theory that recent years’ low unemployment is generating abnormally low rates of wage growth.
Wage growth following the Great Recession was surprisingly strong for a few years, but has become surprisingly weak: Predicted nominal wage changes and actual nominal wage changes, 1979–2018
| Predicted nominal wage change | Actual nominal wage change | |
|---|---|---|
| 1979-Q1 | 6.4568% | 8.5480% |
| 1979-Q2 | 6.9673% | 7.7275% |
| 1979-Q3 | 7.1740% | 7.9820% |
| 1979-Q4 | 7.5579% | 7.5949% |
| 1980-Q1 | 7.8323% | 7.3355% |
| 1980-Q2 | 7.5601% | 7.8640% |
| 1980-Q3 | 7.6828% | 7.8605% |
| 1980-Q4 | 8.2987% | 8.6445% |
| 1981-Q1 | 8.6399% | 9.0955% |
| 1981-Q2 | 8.8435% | 8.9655% |
| 1981-Q3 | 8.9093% | 8.8803% |
| 1981-Q4 | 8.1953% | 7.6742% |
| 1982-Q1 | 7.5155% | 6.9093% |
| 1982-Q2 | 6.5770% | 6.0127% |
| 1982-Q3 | 5.6151% | 5.3635% |
| 1982-Q4 | 4.3919% | 4.7661% |
| 1983-Q1 | 4.0328% | 4.5239% |
| 1983-Q2 | 3.6313% | 4.4350% |
| 1983-Q3 | 3.6747% | 3.8704% |
| 1983-Q4 | 3.8395% | 4.1736% |
| 1984-Q1 | 3.7962% | 3.7098% |
| 1984-Q2 | 3.8859% | 3.5933% |
| 1984-Q3 | 3.6103% | 3.6857% |
| 1984-Q4 | 3.4368% | 3.0849% |
| 1985-Q1 | 3.3082% | 3.0207% |
| 1985-Q2 | 3.0360% | 2.9957% |
| 1985-Q3 | 2.9615% | 2.7734% |
| 1985-Q4 | 3.0002% | 2.9149% |
| 1986-Q1 | 2.9136% | 2.7006% |
| 1986-Q2 | 2.5933% | 2.1814% |
| 1986-Q3 | 2.4426% | 1.8624% |
| 1986-Q4 | 2.3243% | 1.8505% |
| 1987-Q1 | 2.1802% | 1.9534% |
| 1987-Q2 | 2.2492% | 2.2472% |
| 1987-Q3 | 2.5366% | 2.5746% |
| 1987-Q4 | 2.8056% | 2.9663% |
| 1988-Q1 | 3.0181% | 2.7634% |
| 1988-Q2 | 3.2665% | 3.2601% |
| 1988-Q3 | 3.4062% | 3.3830% |
| 1988-Q4 | 3.7379% | 3.4930% |
| 1989-Q1 | 4.0190% | 4.0875% |
| 1989-Q2 | 4.2318% | 3.7602% |
| 1989-Q3 | 4.4209% | 3.8705% |
| 1989-Q4 | 4.3500% | 3.8274% |
| 1990-Q1 | 4.5140% | 4.0303% |
| 1990-Q2 | 4.6829% | 4.2051% |
| 1990-Q3 | 4.3946% | 4.1328% |
| 1990-Q4 | 4.2089% | 3.7869% |
| 1991-Q1 | 4.0041% | 3.2450% |
| 1991-Q2 | 3.8937% | 3.2152% |
| 1991-Q3 | 3.7944% | 3.0579% |
| 1991-Q4 | 3.4960% | 2.8092% |
| 1992-Q1 | 2.9904% | 2.6620% |
| 1992-Q2 | 2.5399% | 2.4476% |
| 1992-Q3 | 2.3386% | 2.3674% |
| 1992-Q4 | 2.2722% | 2.4812% |
| 1993-Q1 | 2.2684% | 2.6867% |
| 1993-Q2 | 2.0688% | 2.5132% |
| 1993-Q3 | 2.1733% | 2.4360% |
| 1993-Q4 | 2.2161% | 2.5437% |
| 1994-Q1 | 2.1219% | 2.5555% |
| 1994-Q2 | 2.3637% | 2.5121% |
| 1994-Q3 | 2.4079% | 2.6189% |
| 1994-Q4 | 2.6998% | 2.6300% |
| 1995-Q1 | 2.7405% | 2.5215% |
| 1995-Q2 | 2.5620% | 2.6867% |
| 1995-Q3 | 2.5743% | 2.9334% |
| 1995-Q4 | 2.6462% | 2.9121% |
| 1996-Q1 | 2.7328% | 3.0961% |
| 1996-Q2 | 2.7614% | 3.4503% |
| 1996-Q3 | 2.9853% | 3.4198% |
| 1996-Q4 | 3.0281% | 3.5937% |
| 1997-Q1 | 3.2039% | 3.7609% |
| 1997-Q2 | 3.4235% | 3.6131% |
| 1997-Q3 | 3.4660% | 3.8027% |
| 1997-Q4 | 3.5928% | 4.2065% |
| 1998-Q1 | 3.5966% | 4.1655% |
| 1998-Q2 | 3.6223% | 4.2918% |
| 1998-Q3 | 3.4048% | 4.0350% |
| 1998-Q4 | 3.3602% | 3.6697% |
| 1999-Q1 | 3.2924% | 3.6095% |
| 1999-Q2 | 3.1843% | 3.6008% |
| 1999-Q3 | 3.2572% | 3.7765% |
| 1999-Q4 | 3.3716% | 3.6662% |
| 2000-Q1 | 3.5472% | 3.7594% |
| 2000-Q2 | 3.8250% | 3.8481% |
| 2000-Q3 | 3.9408% | 3.8358% |
| 2000-Q4 | 4.2454% | 4.1463% |
| 2001-Q1 | 4.1994% | 4.0580% |
| 2001-Q2 | 4.2207% | 3.9684% |
| 2001-Q3 | 4.0310% | 3.6704% |
| 2001-Q4 | 3.4834% | 3.3489% |
| 2002-Q1 | 3.2336% | 2.9944% |
| 2002-Q2 | 2.9470% | 2.6903% |
| 2002-Q3 | 2.8163% | 2.9237% |
| 2002-Q4 | 2.4633% | 3.0591% |
| 2003-Q1 | 2.3758% | 3.2004% |
| 2003-Q2 | 2.1979% | 2.9333% |
| 2003-Q3 | 2.1004% | 2.6187% |
| 2003-Q4 | 2.3025% | 1.9569% |
| 2004-Q1 | 2.3464% | 1.7908% |
| 2004-Q2 | 2.4058% | 2.0231% |
| 2004-Q3 | 2.6931% | 2.1194% |
| 2004-Q4 | 2.7882% | 2.4585% |
| 2005-Q1 | 3.0226% | 2.5531% |
| 2005-Q2 | 3.2727% | 2.6226% |
| 2005-Q3 | 3.4576% | 2.7319% |
| 2005-Q4 | 3.6522% | 3.0309% |
| 2006-Q1 | 4.0823% | 3.4310% |
| 2006-Q2 | 4.3377% | 3.9061% |
| 2006-Q3 | 4.4906% | 4.0404% |
| 2006-Q4 | 4.7206% | 4.1267% |
| 2007-Q1 | 4.4964% | 4.0858% |
| 2007-Q2 | 4.4399% | 4.0592% |
| 2007-Q3 | 4.2121% | 4.0618% |
| 2007-Q4 | 3.9904% | 3.7865% |
| 2008-Q1 | 3.9029% | 3.8088% |
| 2008-Q2 | 3.7446% | 3.6510% |
| 2008-Q3 | 3.2556% | 3.7319% |
| 2008-Q4 | 2.7425% | 3.8752% |
| 2009-Q1 | 1.4262% | 3.6129% |
| 2009-Q2 | 0.2150% | 3.0960% |
| 2009-Q3 | -0.5686% | 2.7166% |
| 2009-Q4 | -1.3954% | 2.6206% |
| 2010-Q1 | -1.5087% | 2.4932% |
| 2010-Q2 | -1.4088% | 2.4996% |
| 2010-Q3 | -1.4654% | 2.3231% |
| 2010-Q4 | -1.7253% | 2.1990% |
| 2011-Q1 | -1.3960% | 2.1505% |
| 2011-Q2 | -1.3722% | 2.0877% |
| 2011-Q3 | -0.9381% | 2.0782% |
| 2011-Q4 | -0.1843% | 1.8220% |
| 2012-Q1 | 0.2929% | 1.5186% |
| 2012-Q2 | 0.4972% | 1.5467% |
| 2012-Q3 | 0.7122% | 1.4200% |
| 2012-Q4 | 0.9508% | 1.4485% |
| 2013-Q1 | 1.0609% | 1.9208% |
| 2013-Q2 | 1.1572% | 1.8954% |
| 2013-Q3 | 1.2468% | 2.1255% |
| 2013-Q4 | 1.3511% | 2.3182% |
| 2014-Q1 | 1.3599% | 2.3516% |
| 2014-Q2 | 1.6594% | 2.3916% |
| 2014-Q3 | 1.7429% | 2.3621% |
| 2014-Q4 | 2.0478% | 2.1343% |
| 2015-Q1 | 2.1240% | 1.8902% |
| 2015-Q2 | 1.9794% | 2.0600% |
| 2015-Q3 | 2.0349% | 2.0332% |
| 2015-Q4 | 1.9391% | 2.3308% |
| 2016-Q1 | 1.9165% | 2.4468% |
| 2016-Q2 | 1.9033% | 2.4476% |
| 2016-Q3 | 1.8453% | 2.5304% |
| 2016-Q4 | 1.8932% | 2.4191% |
| 2017-Q1 | 2.1424% | 2.3259% |
| 2017-Q2 | 2.5573% | 2.2960% |
| 2017-Q3 | 2.7936% | 2.3754% |
| 2017-Q4 | 3.1166% | 2.3313% |
| 2018-Q1 | 3.2593% | 2.5019% |
| 2018-Q2 | 3.5560% | 2.7146% |
| 2018-Q3 | 3.8445% | 2.8326% |
| 2018-Q4 | 4.0281% | 3.2524% |
Notes: Predicted nominal wage changes are obtained from a regression of nominal wage changes on expected inflation and the unemployment rate for the years 1979–2007. The predicted nominal wage changes from this regression fit very tightly with actual nominal changes until the immediate post–Great Recession period (shaded in the figure).
Sources: Unemployment rates are from the Bureau of Labor Statistics (BLS) Current Population Survey and wages are the average hourly earnings of production and nonsupervisory workers from BLS Current Employment Statistics.
Broadly shared wage growth will only happen when policymakers make it a priority even in the face of fierce opposition
The recipe for generating wage growth for most workers is not complicated: Keep unemployment low for long periods, and make institutions work for, not against, workers’ bargaining leverage. But it is a recipe that requires the beneficiaries of the era of rising inequality to accept less, and that makes it politically challenging. A heavy political lift like this requires being cleareyed about who our allies and enemies in this effort are. On this point, the evidence is clear that President Trump and Congress have expended no real effort in helping generate wage growth for most workers, but have done plenty that will make it harder for workers to see wage gains in the future.14 Essentially, the current leadership has had the good luck to preside over a preexisting favorable trend and to be governing when the Fed made a major policy adjustment. At the same time, they have worked feverishly to further undercut workers’ leverage in labor markets. It’s amazing—but true—that the net effect of the past 30 months—even with the unemployment rate below 4.5% for nearly all of this time—will actually end up being damaging for wage growth in the future.
Endnotes
1. Jessica Kwong, “Donald Trump’s Approval Rating on Economy Now Equal to Barack Obama’s When He Left Office, New Poll Indicates,” Newsweek, March 5, 2019.
2. Josh Bivens, “The Fed Shouldn’t Give Up on Restoring Labor’s Share of Income—and Measure It Correctly,” Working Economics Blog (Economic Policy Institute), January 30, 2019.
3. Josh Bivens and Heidi Shierholz, What Labor Market Changes Have Generated Inequality and Wage Suppression?: Employer Power Is Significant but Largely Constant, Whereas Workers’ Power Has Been Eroded by Policy Actions, Economic Policy Institute, December 2018.
4. Josh Bivens and Ben Zipperer, The Importance of Locking in Full Employment for the Long Haul, Economic Policy Institute, August 2018.
5. Josh Bivens, “Look to the 1990s, Not the 1970s, for the Right Lessons to Guide Today’s Monetary Policy,” Working Economics Blog (Economic Policy Institute), August 23, 2016; Economic Policy Institute, “There Has Been Insufficient Vigilance in Fighting Unemployment Since the Late 1970s: Estimate of the Natural Rate of Unemployment and Actual Unemployment, 1949–2018” (chart), viewable at https://www.epi.org/files/charts/img/147756-18468.png.
6. Josh Bivens, “Focus on the Boom, Not the Slump—The Fed’s New Policy Framework Needs to Stop Cutting Recoveries Short,” Working Economics Blog (Economic Policy Institute), June 18, 2019.
7. Josh Bivens, “Janet Yellen, Not Donald Trump, Is Far More Likely to Decide Whether or Not We Reach Genuine Full Employment in 2017,” Working Economics Blog (Economic Policy Institute), March 9, 2017; Josh Bivens, “Not Just ‘No Heat’ but Signs of Cooling: The Case for FOMC Rate Cuts Has Real Merit,” Working Economics Blog (Economic Policy Institute), July 30, 2019.
8. Jared Bernstein and Dean Baker, The Benefits of Full Employment: When Markets Work for People (Washington, D.C.: Center for Economic Policy Research, 2013); James K. Galbraith, Created Unequal: The Crisis in American Pay (Chicago: Univ. of Chicago Press, 2000).
9. Binyamin Appelbaum, “Dying Is No Reason to Stop Fighting,” New York Times, May 3, 2019.
10. PolicyLink, “Why Equity Advocates Should Care About the Fed” (blog post), PolicyLink website, September 11, 2014.
11. Ylan Q. Mui, “This Is How Protesters Plan to Take on the Federal Reserve,” Washington Post, August 11, 2015; Jim Zarroli, “Top Fed Officials Field Questions from Activists Unhappy over Monetary Policy,” The Two-Way, npr.org, August 25, 2016.
12. Arindrajit Dube et al., “Monopsony in Online Labor Markets,” National Bureau of Economic Research Working Paper no. 24416, March 2018; Suresh Naidu and Eric A. Posner, “Labor Monopsony and the Limits of the Law,” Working paper, October 14, 2018; Alan Manning, Monopsony in Motion: Imperfect Competition in Labor Markets (Princeton, N.J.: Princeton Univ. Press, 2003).
13. Celine McNicholas, Samantha Sanders, and Heidi Shierholz, First Day Fairness: An Agenda to Build Worker Power and Ensure Job Quality, Economic Policy Institute, August 2018.
14. Josh Bivens et al., Ten Actions That Hurt Workers During Trump’s First Year: How Trump and Congress Further Rigged the Economy in Favor of the Wealthy, Economic Policy Institute, January 2018.