Opinion pieces and speeches by EPI staff and associates.
THIS TESTIMONY WAS GIVEN BEFORE THE COMMITTEE ON INTERNATIONAL RELATIONS SUBCOMMITTEE ON INTERNATIONAL ECONOMIC POLICY AND TRADE ON JULY 22,1999.
The U.S. Trade Deficit
Are We Trading Away Our Future?
Madam Chair and members of the Committee, thank you for inviting me to testify on the impacts of large and chronic trade deficits on the American economy. This afternoon I will discuss the causes and consequences of the steady growth in the U.S. trade deficit, and then suggest policies that could improve the U.S. trade position.
The Changing Effects of Trade on American Workers [1]
In the 1950s and 1960s, the U.S. was the world’s leading export powerhouse. The Marshall plan helped provided the capital needed to rebuild Europe and Japan, and fueled a tremendous demand for U.S. exports.
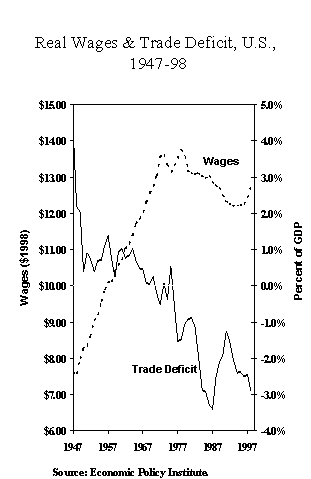
During this period, the U.S. ran a substantial trade surplus, of about one percent of Gross Domestic Product, as shown in Figure 1. The U.S. also benefited initially from strong export demand in a wide range of industries, from low-tech textiles and apparel to sophisticated aircraft and machine tools.
Since the 1970s the U.S. moved from a trade surplus to a deficit position, as Europe and Japan began to compete effectively with the U.S. in a range of industries. There are many ways in which trade has injured U.S. workers since then. First, deterioration in the trade balance (the difference between exports, which create jobs, and imports, which eliminate domestic employment) has reduced employment, especially in manufacturing and other industries producing traded goods
The trade surplus of the 1960s was transformed into a deficit that reached 2.9% of GDP in 1998, as shown in Figure 1. This deficit will grow rapidly in the future as a result of the continuing global financial crisis. Although financial markets are beginning to recover throughout the world, the real economies of many developing countries and Japan remain mired in recessions. For example, reliable private sector reports show that unemployment in Sao Paulo, Brazil currently exceeds 20%.
The growth in the trade deficit over the past two decades has destroyed millions of high-wage, high skilled manufacturing jobs in the U.S., and pushed workers into other sectors where wages are lower, such as restaurants and health service industries. When I appeared before this committee last spring, I summarized EPI forecasts that the Asia Crisis would lead to the elimination of one million jobs in the U.S., with most of the losses concentrated in the manufacturing sectors of the economy (Scott and Rothstein 1998). These job losses have begun to materialize, despite the continuing boom in the rest of the economy. The U.S. has lost nearly 500,000 manufacturing jobs since March of 1998, due to the impact of the rising trade deficit. [2]
The IMF recently forecast that the U.S. current account deficit (the broadest measure of the trade balance) would reach nearly $300 billion in 1999, exceeding 3.5 percent of GDP for the first time in the post-war era (IMF 1999). The U.S. can expect to lose another 400,000 to 500,000 manufacturing jobs as a result, even if the economy continues to expand at its current pace in 1999.
Trade deficits also have a direct impact on wages, especially for non-college educated workers, who make up three-quarters of the U.S. labor force. The other line in Figure 1 shows that the average real wage for U.S. production workers peaked in 1978, declining more or less steadily through 1996. Real wages have begun to increase in the past 3 years. However, the small upturn increased real wages by only 4.5%, not nearly enough to offset a decline of more than 11% since the 1978, nor to return workers to the path of steadily rising wages they experienced from 1950 through 1973.
What is responsible for the decline in U.S. wages? Trade is certainly one of the most significant causes, because it hurts workers in several ways. First, the steady growth in our trade deficits over the past two decades has eliminated millions of U.S. manufacturing jobs. As we showed in another recent EPI report, trade eliminated 2.4 million jobs in the U.S between 1979 and 1994 (Scott, Lee and Schmitt 1997). Growing trade deficits eliminate good jobs and reduce average wages in the economy. Since then, many more jobs have been lost to NAFTA and other sources of our trade problems, including China, and recently, Europe.
The second way in which trade depresses wages is through the growth in imports from low wage countries. If the prices of these products fall, it puts downward pressure on prices in the U.S. Domestic firms are forced to cut wages or otherwise reduce their own labor costs in response. A third way in which globalization depresses wages is through foreign direct investment. When U.S. firms move plants to low wage countries, as they have done at an increasing rate in recent years, it has a chilling affect on the labor market. The mere threat of plant closure is often sufficient to extract wage cuts from workers. This tactic has also been used with increasing frequency in the 1990s and is effective even when plants don’t move.
Most economists now acknowledge that trade is responsible for 20 to 25 percent of the increase in income inequality which has occurred in the U.S. over the past two decades. However, existing research can only explain about half of the change in income inequality. Therefore, trade is responsible for about 40% of the explainable share of increased income inequality. The rest is due to forces such as declining unionization, and inflation-induced erosion in the value of the minimum wage.
Causes of Growing U.S. Trade Deficits
There are many causes of the steady growth in U.S. trade deficits. These include non-tariff barriers to U.S. exports in a number of key foreign markets, and export-led growth strategies in many countries that target American markets because they are the largest and are more open than many others. Macroeconomic factors such as the over-valuation of the U.S. dollar and slow growth abroad have also played important roles in the 1990s, and especially in the past few years. Perhaps most important is a pattern of neglect of the American industrial structure by the federal government.
Important insights into the roles played by each of these factors can be gained by recognizing that the vast majority of the U.S. trade deficit is explained by extremely unbalanced trading relationships that exist with a few key countries, and in a limited number of critical industries. I will examine the pattern of U.S. trade deficits by county, and then by industry in the remainder of this section. Policy issues are addressed in the concluding section.
The Geography of U.S. Trade Flows
U.S. trade imbalances are concentrated in a few regions of the world, as shown in Figure 2. [3] Trade flows at the country level are discussed below. Trade flows are shown for 1991, 1993 and the most recent period available (1997 or 1998) in each of the figures discussed here.

The vast majority (about three fourths) of our trade deficit in manufactured goods is caused by imbalanced trade flows with Asia, as shown in Figure 2. The deficits with Asia are large and rapidly growing, despite very high rates of growth in the region until 1997. Europe and NAFTA w
ere each responsible for about 13% of the deficit in 1998. The U.S. ran a small surplus with the other countries in the Western Hemisphere, and with the rest of the world, in this period.
The causes of American trade deficits with Asian countries are discussed below. There are many important differences in the economic structure and strategy of each country in the region. However, each follows a general pattern established by Japan in the 1950s and 1960s. The Japanese strategy revolved around export-led growth. Exports were increased through state promotion and control of targeted critical industries. Exchange rates were systematically undervalued to enhance the competitiveness of domestic industries, and to discourage imports. Imports were also restricted through a combination of tariff and non-tariff barriers to imports and through private associations that acted to restrain trade and provide a protected home market for domestic producers.
U.S. trade with Europe moved from a substantial surplus in 1991 to a large and rapidly growing deficit in 1998. [4] This deficit reflects at least two trends. First, growth in Europe has slowed while the U.S. economy has recovered. The difference in growth rates has increased sharply in the past two to three years. Higher growth in the U.S. pulls in imports from Europe, while the slowdown on the continent has reduced the demand for U.S. exports.
Second, the European trade deficit was also increased by E.U. industrial and agricultural policies. European subsidies to Airbus have dramatically increased E.U. aircraft exports and reduced U.S. exports to the continent (Barber and Scott 1995). European subsidies to agriculture have also increased substantially since the WTO agreements, which were designed, in part, to reduce such payments, went into effect in 1995 (Scott 1999b). In addition, E.U. firms have illegally dumped steel and other products in the U.S., injuring U.S. workers and industries.
In addition to eliminating hundreds of thousands of U.S. jobs (Scott and Rothstein 1997), NAFTA has also initiated tremendous structural changes in all three member countries (EPI et al 1997). For example, the U.S. trade surplus in agricultural products has declined sharply with Mexico, and has turned into a deficit with Canada. However, changes in the trade balance mask even larger changes in the structure of agriculture. Some U.S. producers of corn and cattle have profited, as have all the major grain trading companies, while Canadian Dairy farms, US farmers growing wheat, barley, fruits and vegetables, and Mexican corn producers have all suffered catastrophic losses (Scott 1999b).
Other groupings of countries are shown in the remaining bars of Figure 3 (there is overlap in the countries included in these groups). The U.S. has accumulated sustained, structural trade deficits with both rich and poor nations, as shown in Figure 3. The majority (55 percent) of the U.S. trade deficit is with developing countries. Developed countries are responsible for the remainder (45%). Both groups have grown rapidly since 1991 (in excess of 225%).
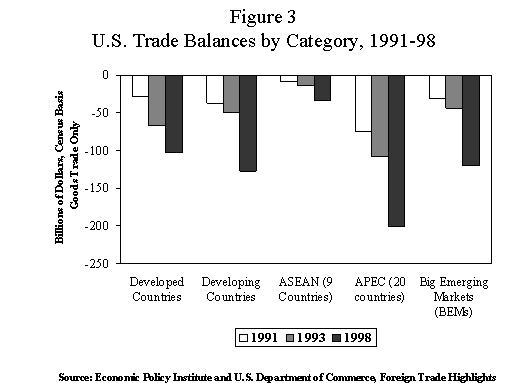
The U.S. has a small but rapidly growing trade deficit with ASEAN, the Association of Southeast Asian Nations. The broader APEC group, which includes Japan, Canada, Mexico and 17 other countries along the Pacific Rim, was responsible for 87% of the overall U.S. deficit in manufactured goods in 1997.
The ten Big Emerging Markets (BEMs), made famous by former Commerce Undersecretary Jeffrey Garten, had some of the most rapidly growing trade deficits in Figure 3 (21.9 percent per year), second only to ASEAN (22.5 percent). [5] The ten BEM countries were responsible for about half of the U.S. trade deficit in 1998.
Trade Deficits are Concentrated with a Few Countries
Only ten countries were responsible for the entire U.S. trade deficit in 1998, as shown in Figure 4. [6] Japan, China and Germany had a combined deficit of $144 billion with the U.S. in 1998, nearly two-thirds of the total deficit in goods trade of $229 billion.

U.S. trade deficits with Japan are the result of numerous public and private barriers to imports, and a policy of export led growth that has been maintained by a Japanese Ministry of Finance policy of consistently undervaluing the yen. While many official, government policies that restrained trade have been reformulated or phased out in recent years, private institutions that act to bar imports, such the extensive networks of Kieretsu relationships, have assumed a more important role in sustaining the trade deficit.
China’s trade policies are modeled on Japan’s, in many ways. Government ownership and control of the majority of economic resources, and an extensive network of government controls over banking, economic activity, trade and foreign exchange flows have combined to create the U.S.’ most unbalanced bi-lateral trading relationship. U.S. imports from China are five times as large as exports to that that country. Even at its most extreme, the U.S.-Japan trade imbalance never exceeded a three-to-one ratio.
China’s trade policies reflect an aggressive, state-led modernization effort that uses the pull of China’s massive low-wage labor market to lure foreign direct investment from multinationals, while extracting the maximum amount of technology, jobs and exports from those relationships. China is rapidly moving up-stream from low-tech products such as shoes and apparel into higher-technology products such as aircraft and parts, computers, motor vehicles and telecommunications equipment (Scott 1999a).
China and Germany also stand out among the top ten deficit countries for having the most rapidly growing deficits (24 percent and 25 percent per year, respectively) as shown in Figure 3. [7] The German deficit reflects the combination of macroeconomic, industrial and agricultural policies discussed above. The U.S. deficit with Mexico also grew very rapidly in this period, especially after the 1994 Peso crisis (Blecker 1997). [8] The U.S. deficit with Mexico was caused by the resulting devaluation, plus a combination of low-wages, proximity to the U.S. market, preferential tariffs, and a package of investor protections and intellectual property guarantees that was codified in the NAFTA (EPI et al 1997).
The U.S. trade deficit through May 1999 has increased by more than one-third, over the same period last year, as shown in Table 1. The deficit with the NAFTA countries has more than doubled over 1998 (Table 1), reflecting the impacts of the decline in the value of the Canadian dollar and the peso last year and the rapid growth of foreign investment in Maquiladora production facilities in Mexico. The U.S. deficit with Western Europe is also on pace to increase by nearly two-thirds in 1999 (Table 1), reflecting the continuing slowdown in that region, combined with EU trade barriers discussed above. Trade deficits have also increased with many countries in Asia, though not as rapidly as with NAFTA and Europe.
Trade Surpluses are Rare
The U.S. does have trade surpluses with a few countries, as shown in Figure 5. This figure is drawn on the same scale as Figure 4 (trade deficits). Thus the size of the deficit or surplus (as measured by the height of the bars) is directly comparable in the two figures. A number of important issues are illustrated by comparing figures 4 and 5.
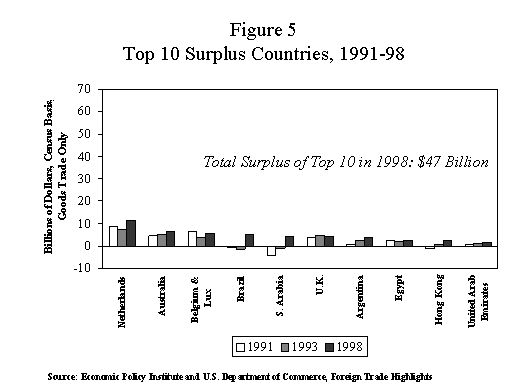
First, the U.S. total trade surplus with the top 10 surplus countries was only $47 billion (Figure 5), less than one quarter of the
total deficit incurred with the top ten deficit countries of $229 billion (Figure 4). Second, the countries that the U.S. has surpluses with are smaller and more diverse than the deficit countries. The surplus countries include several major oil producers, two countries in Latin America where the surplus is probably unsustainable, and Egypt, which is a top recipient of U.S. military assistance. The deficit countries are all larger, and most have followed export-led growth paths for at least the past decade.
Finally, the surplus countries do not exhibit any consistent pattern of sustained surplus growth. Three of the top 10 surplus countries in 1998 had deficits with the U.S. in 1991 (Brazil, Saudi Arabia and Hong Kong, as shown in figure 5). Only one of the top 10 deficit countries had a surplus in this period (Mexico, Pre-NAFTA), and the U.S. experienced a growing deficit each country in Figure 4 between 1991 and 1998.
These data do not reflect any evidence of resurgent U.S. competitiveness. The rise in U.S. exports in the 1990s has not measurably affected the size or distribution of the U.S. trade deficit in any systematic manner. Trade deficits have grown steadily throughout this period with America’s most important trading partners.
The Industrial Structure of U.S. Trade Deficits
Even if the U.S. does have large trade deficits with some countries, some economists would argue that these simply reflect macroeconomic problems in the U.S. (a shortage of domestic savings, relative to investment). Furthermore, some claim that the U.S. benefits from exporting “high-value added goods such as aircraft and computers (Lardy 1999, 3-4)” while importing low-tech goods such as apparel, footwear and toys.
The truth about U.S. trade patterns is more complicated, as shown in Figures 6 and 7. The industry with the largest U.S. trade deficit is crude oil and natural gas (SIC 13), which is not surprising since the U.S. now imports about half of its petroleum. [9] However, the next largest deficit is in motor vehicles and parts, which are not low-technology industries by most measures. Motor vehicle trade is also responsible for more than half of the U.S. trade deficit with Japan, two-thirds of the deficit with Canada and essentially the entire bilateral deficit with Mexico.


Other high-technology and/or high-wage industries that also generated top trade deficits included Computers and office machines and parts (SIC 357), Steel and other blast furnace products (SIC 331) and TVs, radios and other electronic equipment (SIC 365). Only three of the top eight trade deficit sectors are what economists traditionally consider to be low-technology products (Apparel-SIC 23, Leather products-SIC 31 and Toys and sporting gods-SIC 331).
The overall trade deficit with these eight industries was $230 billion in 1997, which exceeds the total U.S. deficit in manufactured goods in that year by a substantial amount. If the deficit in those eight industries could be eliminated, then the trade deficit could be converted into a surplus.
The top 8 trade surplus industries are shown in Figure 7. This figure is drawn on the same scale as Figure 6 (industrial trade deficits). Thus the size of the deficit or surplus (as measured by the height of the bars) is directly comparable in the two figures, as it was in Figures 4 and 5. Comparison of Figures 6 and 7 also yields important insights into the causes of the U.S. trade deficit.
The total surplus of the top 8 surplus industries was $101 billion in 1997 (Figure 7), less than half of the deficit in the top 8 deficit industries (Figure 6). In addition, while most of the surplus industries do involve high-technology and high-wage production (Aircraft-SIC 372, Chemicals-SIC 28, Construction machinery-SIC353, Scientific instruments-SIC 38 and Engines and turbines-SIC 351)), the U.S. is also a net exporter of three major commodity products-Cash grains (SIC 011), Meat packing products (SIC 201) and Cigarettes (SIC 211), as shown in Figure 7. Competition in commodity markets is price based and generates few high-wage jobs.
Finally, the surplus industries do not demonstrate any pattern of sustained growth. Surpluses grew steadily between 1991 and 1997 in only three of the top 8 industries (Figure 7). However, U.S. trade deficits increased (or surpluses disappeared) in each of the top 8 deficit industries in this period (Figure 6).
The dependence of the U.S. on commodity exports and the steady erosion of output and employment in high-wage, high technologies industries are stark indicators of the failure of U.S. trade and industrial policies to nurture and sustain U.S. international competitiveness. Other countries have prospered at the expense of the U.S. Can these problems be reversed?
Policy Recommendations
The development of new approaches to U.S. trade problems must be based on an analysis of how and why the current trade policy process has failed. This analysis must begin with an examination of business influence in the policy-making process.
The Corporate Role in Globalization
While U.S. workers have been hurt by globalization, U.S. multinational businesses have prospered. The soaring prices of U.S. stocks reflect the renewed worldwide dominance of U.S. companies. Concerns about the declining influence of U.S. firms that were widespread a decade ago have disappeared.
The competing interests of U.S. business and workers are reflected in trade statistics. The U.S. has suffered a declining share of world production and trade over the past four decades. In 1970, the U.S. produced 18% of world exports, but by 1998 the use share had declined to less than 14%.
U.S. corporations have continued to play a dominant role in world production and trade by aggressively investing and moving production abroad. Multinationals use plants in other countries to serve foreign markets and, increasingly, to service the U.S. market as well. For example, Mexico now exports more cars to the U.S. than the U.S. exports to the rest of the world. And Mexico’s largest exporter is Daimler-Chrysler.
Trade policy has provided a significant stimulus to such corporate out-sourcing, especially in the 1990s. The Uruguay Round, which created the World Trade Organization, and the NAFTA trade agreement, greatly advanced the interests of multinational business. These agreements protected investors through limits on trade related investment measures, intellectual property rights enforcement and by bringing services trade into the WTO.
New, binding, dispute settlement mechanisms were also created to enforce international property rights. These new measures have unleashed a torrent of foreign investment that has accelerated the impact of trade on workers throughout the developed and developing worlds.
Investor rights have been given top priority in bilateral and multilateral trade negotiations. Workers, consumers and environmentalists have been left out. These groups have formed an informal coalition with conservatives in many regions that has successfully blocked fast track, the MAI and several other important trade initiatives in the past several years.
New Approaches
The current global financial crisis suggests that globalization has allowed business to escape the bounds of regulatory systems that were established after the 1930s, which brought stability and broadly shared growth and prosperity to the world for decades. The trading system has become unbalanced, and exhibits a bias in favor of investor rights while remaining silent on labor, human rights and the environment. Is there a way out of this situation?
In an important address to the Coun
cil on Foreign Relations last year, President Clinton acknowledged that we must “modify the financial and trading institutions of the world to match the realities of the new economy.” He said that “we must do more to ensure that spirited economic competition among nations never becomes a race to the bottom — in environmental protection, consumer protection, or labor standards.”
The key to achieving these goals is to build a new coalition in support of international integration. For the past 40 years, a bi-partisan, center-right coalition, has supported U.S. trade negotiations. This group was based in the Republican Party, but also included a large number of democrats sympathetic to the needs of U.S. business.
Now many members of Congress of both parties have deserted this coalition. 71 Republicans and 151 Democrats opposed a bill last year to extend that President’s fast-track trade negotiating authority. Breaking this bottleneck will require rebuilding the pro-trade coalition from the left to the center. The President’s remarks in New York reflect this new political reality.
The construction of a new trade coalition will depend on four essential ingredients. Start from the basic principle that the top priority for U.S. international policies is the development of an environment that is conducive to a high and rising standard of living for all Americans, and for working people around the world. A strong, competitive domestic manufacturing base is a necessary ingredient of any strategy designed to achieve a high and rising standard of living in all countries, but especially here in the U.S.
First, the U.S. should enter into no new trade agreements, including China’s proposed entry into the WTO, unless and until those agreements are revised to include enforceable labor rights and environmental standards as core elements. This will require, at a minimum, agreements to achieve internationally agreed upon standards, international performance reviews, and enforcement of these standards through trade sanctions.
Second, measures must be taken to reduce chronic U.S. trade deficits with certain key countries, and in a few critical industries such as motor vehicles and commercial aircraft. These include China, Japan, the NAFTA countries, and Europe. The reasons for these deficits differ in each case. Part of Europe’s problem is simply slow growth. The Chinese situation is more complex, involving exchange rate manipulation and systematic discrimination against U.S. imports, as well as advanced industrial policies that pilfer critical jobs and technologies from U.S. firms doing business there.
Third, the U.S. must reduce steadily reduce the value of the U.S. dollar, in coordination with other major advanced industrial nations. Similar steps were taken between 1985 and 1987 period, the last major period of dollar-overvaluation and exploding trade deficits. The over-valued dollar is having a particularly damaging impact on U.S. agriculture (Scott 1999b).
Finally, we must develop new incentives to interest developing countries in joining the developed world in raising labor and environmental standards. Developing countries also need an alternative to the model of export-led growth that has become the core of the commonly accepted Washington consensus growth package. That model has become exhausted because too many countries are competing for access to the only open market in the world, and the U.S. can no longer afford to be the market of last resort.
How can we solve the twin problems of resistance to labor standards and dependence on U.S. markets in developing countries? What is needed is a series of regional Marshall plans. The U.S., for example, should offer a greatly expanded program of debt relief and development aid to the countries in Latin America, in exchange for the upgrading of social standards throughout the hemisphere. Japan could take the lead elsewhere in Asia, and so on. This type of development-oriented model can provide the basis for a new type of regional integration that can build demand for high-wage, high-skilled exports of capital goods from North America, which can be used to help the rest of the hemisphere and the world grow more rapidly.
These are the building blocks of a new architecture for the global economy, a new deal for the 21st century. The regulatory state that evolved from the progressive era and the great depression was a natural response to the excesses of capitalism, as expressed on a national scale. The Asian financial crisis has convincingly demonstrated that the market has outgrown the bounds of the domestic regulatory state in many important ways. These problems cannot be solved on the cheap, or by avoiding the big picture.
Endnotes
1. This statement is based, in part, on an article by the author that will appear in a forthcoming issue of Business Network magazine, the official journal of the British-American Chamber of Commerce.
2. For changes in manufacturing employment, see the U.S. Bureau of Labor Statistics homepage: http://stats.bls.gov/.
3. All information used in Figures 2 through 7 was obtained from the U.S. Department of Commerce, Foreign Trade Highlights, web page: http://www.ita.doc.gov/cgi-bin/otea_ctr?task=otea.
4. See Table 1, below, for current growth rates in key U.S. regional and bilateral trade deficits.
5. There are several countries, such as Indonesia, which are members ASEAN, APEC and the BEMs.
6. Smaller deficits with a number of other countries were offset by the total of all U.S. bilateral trade surpluses, discussed below.
7. To some extent, these growth rates reflect relatively low levels of the bilateral deficit in 1991. Both the level and the growth rate of bilateral deficits have import impacts on the U.S. economy.
8. It is meaningless to report growth rates for the Mexican deficit, because the bilateral trade balance was positive in 1991.
9. Figures 6 and 7 contain information for a mixture of two and three-digit industries, based on their Standard Industrial Classification, or SIC code. Disaggregated (3 digit) industries were selected for presentation over the two-digit aggregates in cases where there were significant differences in trade patterns within two-digit industries. For example, the U.S. had a significant trade deficit in motor vehicles and parts (SIC 371) and a large surplus in aircraft and parts (SIC 372). These trade flows would be obscured if only total trade for transportation equipment (SIC 37) were reported.
References
Barber, Randy and Robert E. Scott. 1995. Jobs on the Wing: Trading Away the Future of the U.S. Aerospace Industry. Economic Policy Institute, Washington, DC,
Blecker, Robert A. 1997. NAFTA and the Peso Collapse: Not Just a Coincidence. Briefing paper. Washington, D.C.: Economic Policy Institute. May.
EPI (Economic Policy Institute), Institute for Policy Studies, International Labor Rights Fund, Public Citizen’s Global Trade Watch, Sierra Club and U.S. Business and Industrial Council Educational Foundation. 1997. The Failed Experiment: NAFTA at Three Years. Washington, D.C.: Economic Policy Institute. June 26.
IMF (International Monetary Fund). 1999. World Economic Outlook. Washington, D.C., The International Monetary Fund. Advance Release, April 20.
Lardy, Nicholas R. 1999. China’s WTO Membership. Washington, D.C.: The Brookings Institution. Brookings Policy Brief No. 47.
Scott, Robert E. 1999a. China Can Wait WTO Accession Deal Must Include Enforceable Labor Rights, Real Commercial Bene
fits. Briefing paper. Washington, D.C.: Economic Policy Institute. May.
Scott, Robert E. 1999b. Exported to Death: The Failure of Agricultural Deregulation. Briefing paper. Washington, D.C.: Economic Policy Institute. July.
Scott, Robert E., Thea Lee and John Schmitt. 1997. Trading Away Good Jobs: An Examination of Employment and Wages in the U.S., 1979-94. Briefing paper. Washington, D.C.: Economic Policy Institute. October.
Scott Robert E., and Jesse Rothstein. 1997. NAFTA and the States: Job Destruction is Widespread. Issue Brief. Washington, D.C.: Economic Policy Institute. September.
Scott Robert E., and Jesse Rothstein. 1998. American Jobs and the Asian Crisis: The Employment Impact of the Coming Rise in the U.S. Trade Deficit. Briefing paper. Washington, D.C.: Economic Policy Institute. January.
[ POSTED TO VIEWPOINTS ON AUGUST 13, 1999 ]
Robert E. Scott is an economist at the Economic Policy Institute. He specializes in globalization and international trade issues.