Issue Brief #320
Congressional Progressive Caucus Co-Chairs Rep. Keith Ellison (D-Minn.) and Rep. Raúl Grijalva (D-Ariz.) have proposed the Restore the American Dream for the 99% Act, a package of near-term job-creation measures and budgetary policy reforms that would meaningfully boost employment and improve the long-term fiscal outlook. This report examines the likely impact of several core elements of the package on job creation. In particular:
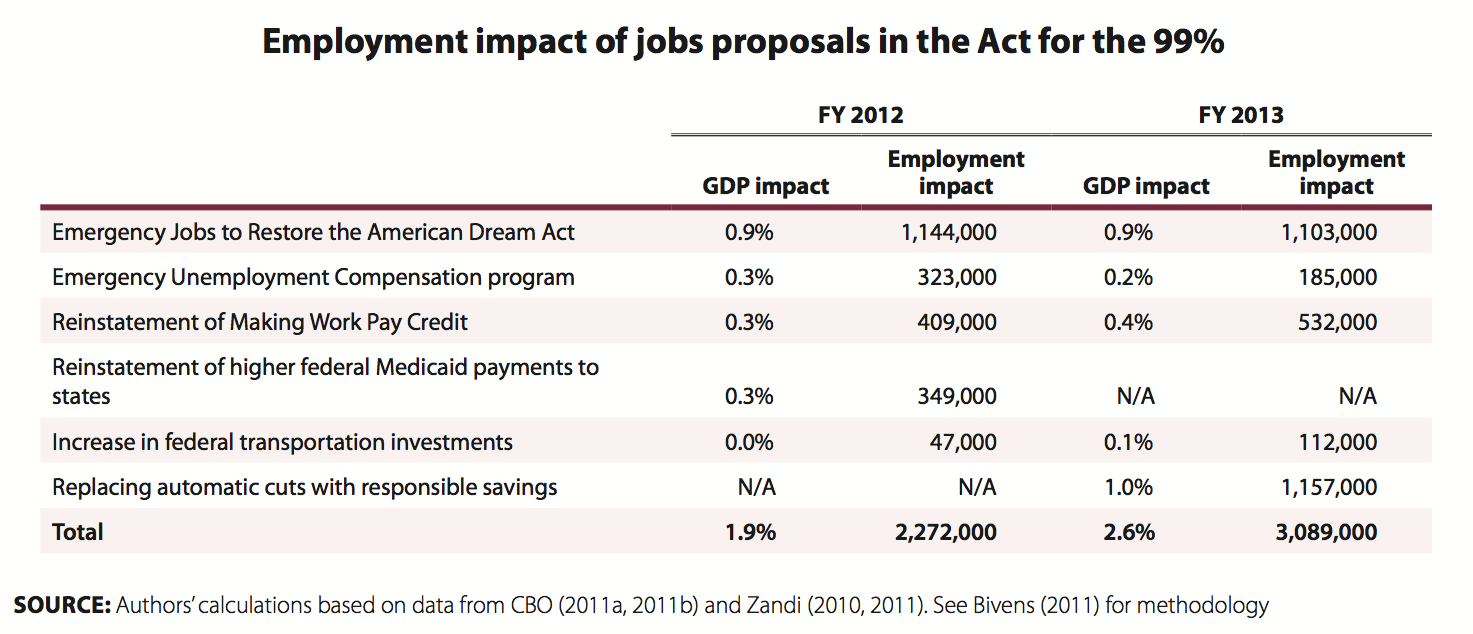
- Enacting the Emergency Jobs to Restore the American Dream Act sponsored by Rep. Jan Schakowsky (D-Ill.) would boost employment by approximately 1.1 million jobs in each of fiscal years 2012 and 2013.1
- Continuing the Emergency Unemployment Compensation program would boost employment by roughly 323,000 jobs in fiscal 2012 and 185,000 jobs in fiscal 2013.
- Reinstating the Making Work Pay tax credit for 2012 and 2013 would boost employment by 409,000 in fiscal 2012 and 532,000 jobs in fiscal 2013.
- Reinstating the higher Federal Medical Assistance Percentages (FMAP) used to determine federal reimbursement for state Medicaid programs would boost employment by 349,000 jobs in fiscal 2012.2
- Increasing federal surface transportation investments by $50 billion in the next decade would increase employment by 47,000 jobs in fiscal 2012 and 112,000 jobs in fiscal 2013. Even greater employment gains would be achieved in later years.
- Defusing the automatic spending cuts currently scheduled under the Budget Control Act would boost employment by more than 1.1 million jobs in fiscal 2013.
These major components of the Act for the 99% would increase nonfarm payroll employment by almost 2.3 million jobs in 2012 and almost 3.1 million jobs in 2013.
The economic and policy context
Federal fiscal policy is poised to drag on economic growth as critical stimulus measures expire and discretionary budget cuts under the Budget Control Act of 2011 (BCA) kick in. The Social Security payroll tax cut and the continuation of emergency unemployment insurance benefits enacted by the Tax Relief, Unemployment Insurance Reauthorization, and Job Creation Act of 2010 are scheduled to expire at the end of 2011. Discretionary spending cuts under the first phase of the BCA will increase from $27 billion in fiscal 2012 to $49 billion in fiscal 2013, leading to slower economic growth and lower employment levels relative to current budget policies (CBO 2011a). These fiscal drags would be greatly amplified if automatic spending cuts legislated by the BCA trigger an additional $111 billion of spending cuts in fiscal 2013.3 Under current law, federal fiscal policy will lower real GDP growth next year by 1.8 percentage points, projects Goldman Sachs (Philips 2011).4 Simultaneously, the state and local budget crises will continue to impede economic recovery (McNichol, Oliff, and Johnson 2011) and economic spillovers from the European Monetary Union’s financial turmoil also are likely to drag on domestic growth.
This impending fiscal drag is set in the dismal economic context of persistently high underemployment and rising poverty. The Congressional Budget Office forecasts that the unemployment rate will average 8.5 percent in the fourth quarter of 2012—five years into the economic downturn—and the Blue Chip Economic Indicators consensus forecast projects that it will remain as high as 8.9 percent over 2012 (CBO 2011a, Blue Chip 2011). The economy has grown only 1.5 percent in the past year and the Blue Chip forecast pegs real GDP growth at 2.2 percent for 2012, also insufficient to dent the unemployment rate (Blue Chip 2011).
Direct public employment efforts
The Act for the 99% would enact Rep. Jan Schakowsky’s Emergency Jobs to Restore the American Dream Act (H.R. 2914), which would put millions of Americans to work in various important civic capacities. The act would provide $227 billion over fiscal years 2012 and 2013 to launch a program repairing public school buildings, establish a national corps of child care workers, put teachers back in the classroom, hire first responders, add staff in the National Parks, and create a national service corps to put hundreds of thousands of young people to work improving public lands, building trails, and engaging in community service work (Schakowsky 2011).
We estimate that the Emergency Jobs to Restore the American Dream Act would increase nonfarm payroll employment by more than 1.1 million jobs in 2012 and 1.1 million jobs in 2013.5 Our estimates are in line with those of Schakowsky’s staff, who estimate the bill would create 400,000 construction and 250,000 maintenance jobs for School Improvements Corps; 100,000 youth jobs for a Park Improvement Corps; 250,000 college work-study jobs for a Student Job Corps; 300,000 jobs for teachers, 40,000 jobs for police officers, and 12,000 jobs for firefighters for a Neighborhood Heroes Corps; 40,000 jobs for health care workers for a Health Corps; 100,000 early childhood care and education jobs for Child Care Corps; and 750,000 jobs for a public works Community Corps (Schakowsky 2011).6
The Act for the 99% also would provide $500 million for Workforce Investment Act training and employment services programs proposed under Title IV of the Local Jobs for America Act (H.R. 2828) proposed by Rep. George Miller (D-Calif.). Half of these funds would be designated for areas experiencing particularly high rates of unemployment or poverty.7
Continuation of emergency unemployment insurance benefits
In addition to serving as a lifeline to those who cannot find work, unemployment insurance creates jobs by increasing consumer demand and is one of the most cost-effective forms of economic stimulus (Zandi 2011). With no other form of income, unemployment insurance recipients—particularly long-term unemployed workers—tend to spend a large share of their income; this high propensity to consume generates additional purchases and economic activity. The federal Emergency Unemployment Compensation (EUC) program provides workers with up to 99 weeks of unemployment insurance, well above the 26 weeks of benefits regularly provided by states, but these emergency benefits are set to expire at the end of 2011. Continuing these benefits is critical because 5.9 million Americans, or 42.4 percent of all unemployed workers, have been out of work for more than six months (Shierholz 2011). If Congress fails to extend these emergency benefits, 1.8 million workers currently receiving unemployment insurance will have their support cut off in January 2012 (NELP 2011).
The Act for the 99% would extend the EUC program through 2012. We estimate that renewing the EUC program when it expires at the end of 2011 would create roughly 323,000 jobs in fiscal 2012 and 185,000 jobs in fiscal 2013.8 The Act for the 99% also would expand Tier 1 EUC benefits by enacting the Emergency Unemployment Compensation Expansion Act of 2011 (H.R. 589) proposed by Rep. Barbara Lee (D.-Calif.), which would further boost consumption and employment.9
Reinstatement of the Making Work Pay tax credit
The Tax Relief, Unemployment Insurance Reauthorization, and Job Creation Act of 2010 replaced the refundable Making Work Pay (MWP) tax credit included in the American Recovery and Reinvestment Act of 2010 with a 2 percentage-point reduction in employees’ Social Security payroll taxes for 2011. The payroll tax cut was less targeted than the MWP credit and raised taxes on households with wages and salaries below $20,000 ($40,000 for joint filers) while cutting taxes for millionaires (Fieldhouse 2010). Making Work Pay essentially was designed to refund workers’ Social Security contributions on the first $6,452 of earned income: Up to the maximum credit amount ($400), it refunded earned income at the same rate (6.2 percent) as workers’ portion of the Social Security payroll tax. Unlike the payroll tax cut, the MWP credit also was reduced by 2 percent of adjusted gross income (AGI) above $75,000 ($150,000 for joint filers); individuals with AGI above $95,000 ($190,000 for joint filers) exceeded this phase-out range and did not receive any credit.10
The Act for the 99% would reinstate the MWP credit in 2012 and 2013. We estimate that reinstating the MWP credit would boost employment by 409,000 jobs in fiscal 2012 and 532,000 jobs in fiscal 2013.11
Strengthening Medicaid
State and local government layoffs have negatively affected monthly employment gains in 11 of the past 12 months. Altogether, 644,000 jobs have been lost in state and local government since employment peaked in August 2008. With federal assistance from the Recovery Act and supplemental jobs bills effectively depleted, states are projected to see bigger budget shortfalls this fiscal year than last (McNichol, Oliff, and Johnson 2011) and state layoffs likely will remain a drag on monthly employment gains without additional federal support.12
The Act for the 99% would ease the state budget crises and help states finance health care for disadvantaged children, poor seniors, and the disabled by reinstating higher Federal Medical Assistance Percentage (FMAP) rates, the reimbursement formula for federal Medicaid grants to the states. The Recovery Act included a temporary increase in the FMAP rates, increasing federal Medicaid payments by $84 billion, and P.L. 111-226 subsequently provided an additional $16 billion in payments (Baumrucker and Mitchell 2011). The Recovery Act included an across-the-board 6.2 percentage-point increase in the FMAP rate, with additional increases based on states’ respective unemployment rates. The Act for the 99% retroactively would reinstate the 6.2 percentage-point increase for the third quarter of 2011 through the first quarter of 2012 and put in place increases of 3.2 percentage points and 1.2 percentage points, respectively, for the second and third quarters of 2012.13
We estimate that reinstating these higher Medicaid matching rates would boost employment by 349,000 jobs in fiscal 2012.14 This would help stem the tide of state and local government job losses, although research shows the majority of employment gains would come from the private sector (Chodorow-Reich et al. 2011).
Infrastructure investment
The Act for the 99% would finance $50 billion in increased surface transportation investments in the next decade, enacting the surface transportation investments of the scale proposed in the American Jobs Act (S. 1549). The Act for the 99% would appropriate an additional $45 billion highway infrastructure investment and $5 billion for transportation infrastructure grants.15 While much of the outlays would occur later in the decade, we estimate that these investments would boost employment by 47,000 jobs in fiscal 2012 and 112,000 jobs in fiscal 2013.16 Even greater employment gains would be achieved in later years.
Additionally, the Act for the 99% would enact Connecticut Rep. Rosa DeLauro’s National Infrastructure Development Bank Act of 2011 (H.R. 402), providing $25 billion in seed money in the next five years. The actual spend-out rate for loans and loan guarantees gradually would occur in the next decade, so we do not calculate any jobs impact based on near-term direct government spending (CBO 2011b). By inducing private economic activity that would not otherwise occur, a national infrastructure bank likely would increase employment throughout the decade.
Replacing automatic cuts with responsible savings
The Joint Select Committee on Deficit Reduction failed to agree to $1.0 trillion in spending reductions and tax increases ($1.2 trillion including net interest), setting the stage for the Budget Control Act’s sequestration cuts to be triggered in 2013. (The sequestration mechanism requires a proportional cut in nominal dollars across fiscal years 2013–21, resulting in a scheduled cut of $111 billion for fiscal 2013.) If triggered, this cut would vastly increase the fiscal drag from fiscal 2012 to fiscal 2013. Under the Act for the 99%, the 10-year savings would count toward and exceed the Joint Select Committee’s deficit-reduction target, thereby avoiding the sequestration cuts. Among the provisions in the Act for the 99% that would more than satisfy the Joint Select Committee’s deficit-reduction target are savings from enacting the Responsible End to the War in Afghanistan Act (H.R. 780) and reductions to base spending by the Department of Defense, including the Defense and Deficit Reduction Act (H.R. 413) and House amendments 302 and 332 to the National Defense Authorization Act for Fiscal Year 2012 (H.R. 1540).
Defusing the sequestration trigger would add 1 percentage point to real GDP growth and boost employment by more than 1.1 million jobs in fiscal 2013. (This calculation assumes a fiscal multiplier of 1.4 for general government purchases (Zandi 2010).)
Adding it all up
Cumulatively, the five major job-creation initiatives discussed in this analysis would boost employment by almost 2.3 million jobs in 2012 and almost 3.1 million jobs in 2013 (see Table 1). These job-creation measures would accelerate employment gains noticeably in the next two years.
It is important to note that these estimates of the jobs measures’ impact on GDP and employment are calculated using CBO’s nominal GDP forecasts for the next two fiscal years (CBO 2011a). Like CBO’s budgetary projections, these economic projections are notionally grounded in current law, meaning they assume the expiration of the payroll tax cut and Emergency Unemployment Compensation program at the end of 2011. This is a different “baseline” than that used, for example, by private-sector forecasters, many of whom assume the payroll tax cut passed in December 2010 will be extended through 2012. The CBO current-law baseline does not make this assumption.
CBO’s projection of 2.6 percent real GDP growth in 2012 hence already accounts for the substantial fiscal drag embedded in current law—a drag that is estimated to be roughly 1.8 percent of GDP by Goldman Sachs. Implicitly, this means that economic growth outside of federal fiscal influences is a relatively healthy 4.4 percent for 2012. This is, it must be said, probably over-optimistic. It is unclear what sector of the economy is healthy enough to generate this rate of growth. Consumer spending has risen a little more than 2 percent year-over-year, in part due to the payroll tax cut and extensions to unemployment insurance. Business investment has risen sharply—more than 7 percent in the past year—but investment has been encouraged by hefty, temporary tax incentives and this sector makes up considerably less than 10 percent of the overall economy. Further, it is unclear how durable these increases in investment will be in the face of weak consumer demand. Net exports have added to growth in the past year but by an average of only 1 percent of GDP—and the crisis in the eurozone and continued slow growth in Japan means that many of our major export destinations are unlikely to quickly increase demand in the coming year.
The CBO’s relative optimism is not off-the-charts. Moody’s Analytics’ Economy.com, for example, forecasts the growth rate, net of fiscal drag, at 3.7 percent in 2012, a relatively healthy number. This, however, still highlights that rapid withdrawal of fiscal support, even in an otherwise healthy economy, can short-circuit badly needed growth.
Assessing the jobs plan
Job-creation plans should be measured against specific criteria, as detailed in Eisenbrey et al. (2011). As with other jobs plans in the past, we ask whether this one will do the following:
1. Will it make a real difference in job creation in the next 12 months?
2. Is it effective and efficient?
3. How is it funded?
4. Is it at the appropriate scale to produce a substantial number of jobs?17
The Act for the 99% meets these criteria for a strong, viable jobs plan. As depicted in Table 1, the proposal will make a real difference in job creation in the next 12 months, boosting nonfarm payroll employment by 2.3 million jobs in fiscal 2012. Given the depth and length of the jobs crisis to date, the most pressing task is to lower unemployment. Many other policy proposals frequently invoked in this debate—such as patent reform or comprehensive tax reform—fail this criterion. Those proposals, at best, would mildly affect the potential growth path of the economy, while doing nothing to lower today’s elevated unemployment rates. In contrast, the Act for the 99% is clearly focused on the aggregate demand slump at hand and would produce measurable declines in joblessness.
The Act for the 99% is effective and efficient because it uses resources to generate more jobs than many alternative policies. For instance, the act includes investments in infrastructure projects, emergency unemployment benefits, and state fiscal support (the higher Medicaid matching rates)—all policies that demonstrate a high bang-per-buck.18 Refundable tax credits are more cost effective than nonrefundable credits (liquidity-constrained households are unlikely to save the refundable portion), and the targeted, temporary Making Work Pay credit is considered much more cost-effective than permanent tax cuts, particularly than reductions in marginal individual income tax rates. In other words, the policy prescriptions in the act are all proven to generate significant economic activity when it is most needed.
Effective job-creation proposals increase demand for goods and services as well as the workers who create goods and services. For this reason, the most effective jobs packages are not paid for by near-term spending cuts or tax increases, which dilute the capacity of policies to increase spending. (The major exception is permanent tax increases on upper-income households, which would have little impact on near-term aggregate demand.) Near-term spending cuts and tax increases are particularly likely to depress demand when there is a large output gap—a big difference between actual economic activity and potential activity where all labor, capital, and industrial capacity resources are in use.
The current estimated output gap is $912.9 billion (-5.7 percent), meaning that the United States is forgoing almost $1 trillion in national income annually. Recently, proposed job-creation packages, however, have been budget neutral (across 10 years) out of deference to political concerns about the fiscal outlook and to garner wider support. President Obama’s proposed American Jobs Act, for instance, was packaged with deficit-reduction proposals for the Joint Select Committee on Deficit Reduction. To be both budget-neutral and effective, a jobs plan would pay for measures in the later years, after the economy is experiencing stronger growth and lower unemployment. The Act for the 99% does this by launching job-creation measures upfront, while gradually offsetting those costs with revenue proposals that will generate savings across 10 years. Finally, the Act for the 99% is scaled to produce a substantial number of jobs. The package would boost employment by almost 2.3 million jobs in 2012 and almost 3.1 million jobs in 2013, putting a noticeable dent in the shortfall of 11.0 million jobs needed to restore unemployment to pre-recession rates (Shierholz 2011).
Long-term deficit reduction
The revenue components included in the Responsible Savings and Fair Taxation portion of the Act for the 99% would more than pay for the job-creation measures in a 10-year period.
The job-creation measures in the Act for the 99% could be offset by Rep. Schakowsky’s Fairness in Taxation Act (H.R. 1124), the 10-year savings from which would more than pay for all of the near-term job-creation policies. The Fairness in Taxation Act would create several new tax brackets that would affect only high-income earners making more than $1 million annually. The act would tax those making between $1 million and $10 million at 45 percent; $10 million and $20 million at 46 percent; $20 million and $100 million at 47 percent; $100 million and $1 billion at 48 percent; and those making at or above $1 billion at 49 percent. The bill also would tax capital gains and dividend income as ordinary income for all taxpayers with incomes greater than $1 million. This measure was scored by Citizens for Tax Justice to generate $748.2 billion from 2011–2020.19 Extrapolating that score to apply to the current 10-year fiscal outlook, the measure is expected to generate $872.5 billion from 2012–2021(Fieldhouse 2011b).20
The revenue raised from the Fairness in Taxation Act would more than offset costs associated with the major job-creation proposals included in the Act for the 99%, while leaving ample room to apply some of the savings to long-term deficit reduction. The Act for the 99% includes a number of other proposals that also would significantly reduce 10-year deficit projections. These include repealing tax loopholes for the oil and gas industry, reinstating superfund taxes for hazardous waste cleanup, enacting a Wall Street speculation tax, and reducing spending by the Department of Defense.
Progressive tax measures such as these have the ability to raise significant revenues to finance job-creation measures, shrink deficits, and ease pressure elsewhere in the budget. It is appropriate to pursue deficit-reduction by raising tax revenues from those best able to contribute to reducing deficits (and who have disproportionately benefited from regressive, deficit-financed tax cuts of the past decade). (See Fieldhouse and Shapiro 2011.) In fact, a spending-cuts-only approach to funding new measures would be regressive because it shoulders the brunt of deficit reduction on the backs of poor and working families while ignoring a prime culprit of the budget deficit: the expensive and ineffective Bush-era tax cuts. Progressive taxation is a palatable approach to deficit reduction embraced by the public—unlike nearly every other deficit-reduction approach (Fieldhouse 2011c). Progressive tax reforms also reduce the deficit without having much of an effect on near-term economic recovery or employment growth.
The Act for the 99% would invest in job-creating policies in the near term while spreading deficit reduction across 10 years. This is the most constructive way for Congress to approach deficit reduction: Create more taxpayers and generate a self-sustaining recovery before pivoting to net fiscal consolidation, and emphasize policies that will have relatively little adverse effect on near-term aggregate demand.
Endnotes
1. All jobs estimates are in fiscal years unless otherwise noted.
2. The FMAP rate is only increased through the fourth quarter of fiscal 2012, so there is no employment impact estimated for fiscal 2013.
3. The Tax Relief, Unemployment Insurance Reauthorization, and Job Creation Act also extended several tax provisions of the American Recovery and Reinvestment Act that are scheduled to expire at the end of 2012. These include the American Opportunity Tax Credit (a partially refundable tuition credit), the increased refundability of the child tax credit, the third earned-income tax credit (EITC) tier for families with three or more qualifying children, and the increased EITC phase-out range for joint-filers. If allowed to expire, these credits also would add to the fiscal drag, but their fate is likely tied to the Bush-era tax cuts, some or most of which seem likely to be extended.
4. Goldman Sachs expects that the payroll tax cut will be extended, which would reduce the 2012 fiscal drag to roughly 1 percentage point (Philips 2011).
5. This calculation assumes a fiscal multiplier of 1.31 for general aid to state governments (Zandi 2011). See Bivens (2011) for methodology of estimating the jobs impact of fiscal impulses.
6. Given that the funding is spread over two years, these estimates are presumably in terms of cumulative job-years.
7. The economic and employment impact of this additional WIA funding is included in the economic and employment impact of the Emergency Jobs to Restore the American Dream Act in Table 1.
8. This estimate is based on CBO’s budgetary score of Title III of the American Jobs Act of 2011 (CBO 2011b).
Using the same methodology but employing calendar year 2012 nominal GDP as the baseline, Shierhlolz and Mishel (2011) estimate that extending the EUC program would boost employment by 560,000 jobs in 2012.
9. Data limitations preclude calculating the employment impact of H.R. 589.
10. Adjusted gross income (AGI) is gross income, which includes wages and other forms of income such as capital gains, dividends, interest, and rent, adjusted for above-the-line deductions such as contributions to IRAs and health savings accounts.
11. This estimate assumes a fiscal multiplier of 1.19 calculated specifically for the Making Work Pay credit (Zandi 2011). Reinstating the MWP credit would reduce revenue by $28.4 billion in fiscal 2012 and $40.9 billion in fiscal 2013 and also increase expenditure by $16.5 billion in fiscal 2012 and $19.3 billion in fiscal 2013. (The refundable portion of tax cuts is booked as mandatory spending for budget scorekeeping purposes.) These cost estimates come from the Urban-Brookings Tax Policy Center’s analysis of Investing in America’s Economy: A Budget Blueprint for Economic Recovery and Fiscal Responsibility, as adapted and independently scored for the Solutions Initiative and funded by the Peter G. Peterson Foundation. The Peterson Foundation convened organizations with a variety of perspectives to develop plans addressing the nation’s fiscal challenges. The American Enterprise Institute, the Bipartisan Policy Center, the Center for American Progress, the Economic Policy Institute, the Heritage Foundation, and the Roosevelt Institute Campus Network each received grants. All organizations had discretion and the independence to develop their own goals and propose comprehensive solutions. The Peterson Foundation’s involvement with this project does not represent endorsement of any plan. The final plans developed by all six organizations were presented as part of the Peterson Foundation’s second annual Fiscal Summit in May 2011. The TPC estimate of the reinstatement of the Making Work Pay credit in the EPI plan was scored against a baseline that assumes that the 2001 and 2003 tax cuts expire, that the middle-class tax relief in the president’s budget is reinstated, and the AMT patch is extended permanently and indexed to the consumer price index.
12. Note that many state fiscal years start one quarter before the federal fiscal year (July 1 versus October 1, respectively).
13. These quarters are in calendar years, not fiscal years.
14. This estimate assumes a fiscal multiplier of 1.31 for general aid to state governments (Zandi 2011), although research suggests that state fiscal relief disbursed through the FMAP formula is more effective than general aid to states, likely because of the additional matching rates for states with high unemployment rates. For instance, Chodorow-Reich et al. (2011) estimate that an additional $100,000 in federal Medicaid outlays results in an additional 3.8 job-years, of which 3.2 job-years are outside of government, health, and education employment. Our cost estimate for fiscal 2012 assumes $18.7 billion for two quarters at the higher 6.2 percent rate (prorated from CBO’s $84 billion cost estimate for the nine-quarter increase in the Recovery Act) and $16.1 billion cost of the 3.2 percent and 1.2 percent phase out (adopting the total cost estimate from the FMAP extension in P.L. 111-226). The estimates by Chodorow-Reich et al. (2011) suggest these funds could boost employment by much more—as many as 1.3 million jobs in fiscal 2012.
15. The $45 billion in highway infrastructure investment is restricted to those projects eligible under 23 U.S.C. §133b. The American Jobs Act, meantime, proposed $27 billion in highway infrastructure investments, $9 billion in rail transit, $2 billion for intercity rail transit, $2 billion for airport improvements, and $10 billion for high-speed rail, NextGen Air Traffic Modernization, and the TIGER and TIFIA programs. (See OMB 2011.)
16. This estimate assumes a fiscal multiplier of 1.44 for infrastructure investment (Zandi 2011). While the latest CBO report on the comparative effectiveness of various forms of fiscal policies in generating output and employment gains in the near term (CBO 2011c) has assumed that half of infrastructure spending outlaid through states is crowded out by reductions in state infrastructure spending, this seems like a surmountable problem. Specifically, the federal government could make the outlays directly or mandate some infrastructure-related maintenance of effort requirement as a condition for receiving the federal infrastructure grants. The outlay estimates are taken from CBO’s cost estimate of the American Jobs Act (CBO 2011b), which are more weighted toward longer-term projects such as high-speed rail (see endnote 15). The CBO cost estimate and our economic estimates are meant as a conservative proxy for near term spend out rates, likely understating the employment impact in fiscal years 2012 and 2013.
17. See, for instance, Mishel (2011). Further, because the most important empirical determinant of capital investment is actually the contemporaneous strength of the overall economy, measures like The Restore the American Dream for the 99% Act that substantially improved near-term growth would actually “crowd-in” much private investment, which would produce long-run gains in economic performance as well as ameliorate the near-term job crisis. In fact, even the long-run performance improvement spurred by the Restore the American Dream for the 99% Act could well be comparable to any long-run boost provided by measures such as patent reform or comprehensive tax reform.
18. See Zandi (2011), CBO (2011c), and CBO (2011d).
19. This score is not publicly available.
20. The revenue impact for 2021 is extrapolated by adjusting the 2020 revenue level for nominal GDP growth.
References
Baumrucker, Evelyne and Alison Mitchell. 2011. Medicaid: The Federal Medical Assistance Percentage. Washington, D.C.: Congressional Research Service.
Bivens, Josh. 2011. Method memo on estimating the jobs impact of various policy changes. Washington, D.C.: Economic Policy Institute. http://www.epi.org/publication/methodology-estimating-jobs-impact/
Blue Chip Economic Indicators. 2011. “Top Analysts’ Forecasts of the U.S. Economic Outlook for the Year Ahead,” Blue Chip Economic Indicators, Vol. 36, No. 9.
Chodorow-Reich, Gabriel, Laura Feiveson, Zachary Liscow, and William Gui Woolston. 2011. “Does State Fiscal Relief During Recessions Increase Employment? Evidence from the American Recovery and Reinvestment Act.” August 11 working paper, accepted for publication in American Economic Journal: Economic Policy. http://econgrads.berkeley.edu/gabecr/files/2011/05/Does-State-Fiscal-Relief-During-Recessions-Increase-Employment-August-20114.pdf
Congressional Budget Office (CBO). 2011a. The Budget and Economic Outlook: An Update. Washington, D.C.: CBO. http://www.cbo.gov/ftpdocs/123xx/doc12316/08-24-BudgetEconUpdate.pdf
Congressional Budget Office (CBO). 2011b. Congressional Budget Office Cost Estimate: S. 1549, American Jobs Act of 2011, as introduced on September 13, 2011. Washington, D.C.: CBO. http://www.cbo.gov/ftpdocs/124xx/doc12470/s1549.pdf
Congressional Budget Office (CBO). 2011c. Policies for increasing economic growth and employment in 2012 and 2013: Testimony by Douglas Elmendorf before the Committee on the Budget, United States Senate. Washington, D.C.: CBO. http://www.cbo.gov/ftpdocs/125xx/doc12564/11-22-ARRA.pdf
Congressional Budget Office (CBO). 2011d. Estimated Impact of the American Recovery and Reinvestment Act on Employment and Economic Output from July 2011 Through September 2011. Washington, D.C.: CBO. http://www.cbo.gov/ftpdocs/125xx/doc12564/11-22-ARRA.pdf
Eisenbrey, Ross, Lawrence Mishel, Josh Bivens, and Andrew Fieldhouse. 2011. Putting America back to work: Policies for job creation and stronger economic growth. Economic Policy Institute, Briefing Paper #325. Washington, D.C.: EPI. http://w3.epi-data.org/temp2011/BriefingPaper325.pdf
Fieldhouse, Andrew. 2010. “Any payroll tax cut should be designed not to hurt lower-income workers.” Economic Policy Institute, Web commentary, December 15. http://www.epi.org/publication/any_payroll_tax_cut_should_be_designed_not_to_hurt_lower-income_workers/
Fieldhouse, Andrew. 2011a. “Senate compromise falls woefully short of a jobs plan.” Economic Policy Institute, Working Economics (blog), November 8. http://www.epi.org/blog/senate-compromise-jobs-plan-falls-short/
Fieldhouse, Andrew. 2011b. The People’s Budget” A Technical Analysis. Economic Policy Institute, Working Paper #290. Washington, D.C.: EPI. http://www.epi.org/page/-/WP290_FINAL.pdf
Fieldhouse, Andrew. 2011c. “In favor of progressive taxation and a balanced approach to budgeting.” Economic Policy Institute, Web commentary, September 26. http://www.epi.org/publication/favor-progressive-taxation-balanced-approach/
Fieldhouse, Andrew and Isaac Shapiro. 2011. The facts support raising revenues from the highest-income households. Economic Policy Institute-The Century Foundation, Issue Brief #310. Washington, D.C.: EPI. http://web.epi-data.org/temp727/EPI-TCF_IssueBrief310.pdf
McNichol, Elizabeth, Phil Oliff, and Nicholas Johnson. 2011. States Continue to Feel Recession’s Impact. Washington, D.C.: Center on Budget and Policy Priorities. http://www.cbpp.org/cms/index.cfm?fa=view&id=711
Mishel, Lawrence. 2011. “How effective is President Obama’s jobs plan?” Economic Policy Institute, Working Economics (blog), September 8. http://www.epi.org/blog/effective-president-obamas-jobs-plan/
National Employment Law Project (NELP). 2011. Hanging on By a Thread: Renew Federal Unemployment Insurance to Aid Families, Boost Stalled Economy; Nearly Two Million Jobless Workers Face Premature Cut‐Off in January 2012. National Employment Law Project, Briefing Paper. New York: NELP. http://nelp.3cdn.net/68172c0cee6bd3e294_czm6iiviu.pdf
Office of Congresswoman Jan Schakowsky. 2011. “Emergency Jobs to Restore the American Dream Act.” Washington, D.C.: United States House of Representatives. http://schakowsky.house.gov/index.php?option=com_content&view=article&id=2975&Itemid=8
Office of Management and Budget (OMB). 2011. Living Within Our Means and Investing in the Future: The President’s Plan for Economic Growth and Deficit Reduction. Washington, D.C.: Office of Management and Budget. http://www.whitehouse.gov/sites/default/files/omb/budget/fy2012/assets/jointcommitteereport.pdf
Philips, Alec. 2011. “US Daily: Fiscal Policy: Slightly Less Restraint in 2012.” New York: Goldman Sachs Global Economics, Commodities and Strategy Research, September 12.
Shierholz, Heidi. 2011. “At this rate of job growth, the unemployment rate will stay disastrously high.” Economic Policy Institute, Economic Indicators website, November 4. http://www.epi.org/publication/rate-job-growth-unemployment-rate-stay-disastrously/
Shierholz, Heidi and Lawrence Mishel. 2011. Labor market will lose over half a million jobs if UI extensions expire in 2012. Economic Policy Institute, Issue Brief #318. Washington: D.C.: EPI. http://www.epi.org/files/2011/ib318.pdf
Zandi, Mark. 2010. “U.S. Macro Outlook: Compromise Boosts Stimulus.” Moody’s Analytics’ Dismal Scientist website, December 8. http://www.economy.com/dismal/article_free.asp?cid=195470
Zandi, Mark. 2011. “An Analysis of the Obama Jobs Plan.” Moody’s Analytics’ Dismal Scientist website, September 9. http://www.economy.com/dismal/article_free.asp?cid=224641