Issue Brief #287
The United Steelworkers (USW) filed a section 301 petition with the U.S. Trade Representative (USTR) last month which accuses China of illegally stimulating and protecting its producers of green technology exports, ranging from wind and solar energy products to advanced batteries and energy-efficient vehicles. The USTR recently announced that it would begin a 90-day investigation into China’s trade practices related to its green technology industries. The U.S. trade deficit with China in clean energy products, based on data through August 2010, has more than doubled in the past two years alone, as shown in the graphs below. Growing trade deficits with China in clean energy products will cost more than 8,000 U.S. jobs in 2010.
The U.S. Commerce Department recently reported that the U.S. trade deficit increased sharply in August. The growth was explained, in large part, by a record monthly deficit with China. Soaring imports of clean energy products are an increasingly important part of that deficit. The Federal Reserve reported today that the industrial production fell 0.2% in September, and that manufacturing production also fell 0.2%. The growth in U.S. trade deficits with China have contributed to the slowdown of manufacturing and industrial production, and threaten to undermine the economic recovery.
The USW petition shows that China is using a wide array of illegal trade policies to stimulate growth and exports of its green technology industries, including massive subsidies of more than $216 billion; restrictions on access to rare earth elements and other minerals; discrimination against foreign firms or goods; technology transfer requirements for foreign investors; and making subsidies contingent on exports or domestic content. As a result, U.S. imports of clean energy products have recently exceeded exports to China by a factor of more than 10 to 1, as shown in Figure A.
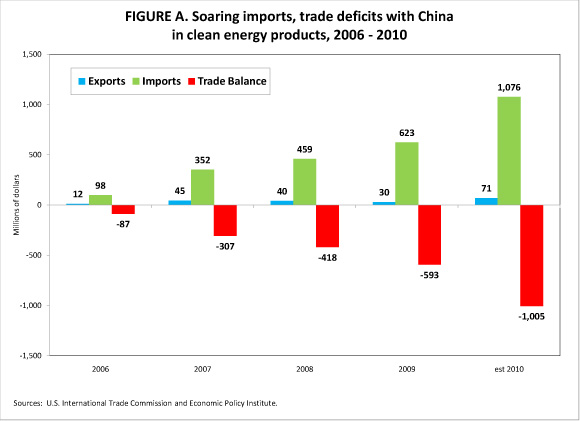
U.S. trade with China in clean energy products (narrowly defined) is shown in Figure A[1]. These include selected windmill components and photovoltaic (solar electric) panels and cells. The latter are among the most rapidly growing U.S. imports. Overall, imports of clean energy products increased 74% per year, on average, between 2000 and 2010. U.S. exports also increased very rapidly, but from a tiny base. As a result, the U.S. developed large and very rapidly growing trade deficits with China in clean energy products. The estimated trade deficit in clean energy products more than doubled from 2008 to 2010 alone.
Clean energy products such as windmills and photovoltaic cells are durable manufactured goods, and their production in the United States would support large numbers of high-wage jobs with good benefits. Durable goods manufacturing employs a disproportionately large share of workers without a college degree. When they are employed in other sectors, such as services industries, these workers frequently are paid less and often with worse or no benefits; when unemployed, they receive, at best, only unemployment compensation.
The U.S. trade deficits in clean energy products will result in the loss or displacement of more than 8,000 jobs in the United States in 2010. Most of those jobs would have been in manufacturing industries, such as the electronics sector, which has been hard hit by globalization and by growing trade deficits with China in particular (Scott 2010).
The U.S. had a large and growing trade deficit with the rest of the world in clean energy products for most of the past decade, as shown in Figure B. However, that deficit peaked and began to shrink in 2008, as the great recession took hold. Overall, the U.S. goods trade deficit peaked in 2006, was roughly stable through 2008, and then shrank 40% in 2009.
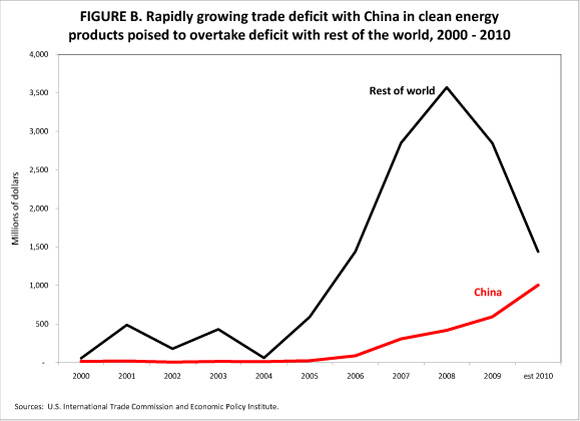
The total U.S. trade deficit with China declined 15% in 2009, and the overall U.S. trade deficit and the U.S. clean energy products trade deficit both fell sharply. However, the U.S. trade deficit with China in clean energy products grew rapidly in 2008 and 2009, as noted above. It is remarkable that the clean energy products trade deficit with China increased so dramatically even as it fell sharply with respect to the rest of the world.
These data show that China’s massive subsidies to its clean energy and other environmental (“green”) product industries have caused substantial trade displacement. The growth of the U.S. trade deficit with China has cost more than 8,000 jobs in the United States. China also threatens to replace all other countries in the world as the most important supplier to the United States of these products, as shown in Figure B. Thus, China’s unfair trade policies are also injuring exporters of environmental products from around the world. It is time for China to end illegal export subsidies and all other illegal efforts to establish its environmental product producers as leading export industries.
References
Scott, Robert E. 2010. “Unfair China Trade Costs Local Jobs.” Washington, D.C.: Economic Policy Institute. EPI Briefing Paper # 260. March 23.
Wyden, Senator Ron. 2010. “U.S. Trade in Environmental Goods: Follow-Up Report to Major Opportunities and Challenges to U.S. Exports of Environmental Goods.” Washington, D.C.: United States Senate. May 20.
[1] The data discussed in this analysis include trade in just four, specific clean energy products: Windmill towers, windmill gears and gearboxes, wind generator sets and photovoltaic panels and cells. A recent report published by Senator Ron Wyden (2010), examined trade in 43 six-digit HTS categories that contain environmental goods (including those examined here) , and attempted to limit that data to exclude non-clean energy products contained in the same categories. This report uses the estimates in the Wyden report, which are based on global trade flows, to reach a conservative estimate of the clean energy goods trade deficit with China in four of the 43 categories. The data discussed in this report include only a small subset of environmental products trade with China.