The jobs report for December 2013 released by the Bureau of Labor Statistics this morning marks six years since the official start of the Great Recession in December 2007 and four-and-a-half years since its official end in June 2009.
The unemployment rate dropped from 7.0 percent to 6.7 percent in December, but as has been a constant refrain throughout this recovery, most of the decrease was not for “good” reasons. Rather, it was due to potential workers dropping out of, or never entering, the labor force because job opportunities are weak. The share of the working-age population with a job did not increase in December, and the labor force participation rate dropped back down to its lowest point in more than 35 years. Additionally, the number of “missing workers” increased from 5.6 million to 6.0 million. (Missing workers are jobless workers who are not actively seeking work, but who would be either employed or looking for work if job opportunities were stronger, after accounting for longer-run demographic trends.) If these workers were in the labor force looking for work—and thus counted as unemployed—the unemployment rate would be 10.2 percent instead of 6.7 percent.
Just 74,000 payroll jobs were added in December. It is unlikely that the underlying growth rate is this low, but the weak December showing does highlight that the excessive optimism in recent weeks about strong acceleration in the labor market is likely misplaced. The average monthly growth rate in 2013 was 182,000, just under the average monthly growth rate in 2012, which was 183,000. At the average growth rate of the last three months—172,000 jobs per month—it would take nearly six more years to regain pre-recession labor market conditions, given our gap of 7.9 million jobs.
With job opportunities so weak for so long, workers have gotten stuck in unemployment for record lengths of time. The share of unemployed workers who have been unemployed for more than six months increased in December from 37.4 percent to 37.7 percent, as shown in Figure A.
| Date | Share of the unemployed |
|---|---|
| 1948-01-01 | 6.4% |
| 1948-02-01 | 5.2% |
| 1948-03-01 | 4.6% |
| 1948-04-01 | 4.4% |
| 1948-05-01 | 5.1% |
| 1948-06-01 | 5.3% |
| 1948-07-01 | 4.9% |
| 1948-08-01 | 5.3% |
| 1948-09-01 | 5.5% |
| 1948-10-01 | 6.2% |
| 1948-11-01 | 4.3% |
| 1948-12-01 | 4.1% |
| 1949-01-01 | 4.1% |
| 1949-02-01 | 4.5% |
| 1949-03-01 | 3.8% |
| 1949-04-01 | 4.8% |
| 1949-05-01 | 5.1% |
| 1949-06-01 | 6.5% |
| 1949-07-01 | 7.5% |
| 1949-08-01 | 8.0% |
| 1949-09-01 | 8.6% |
| 1949-10-01 | 7.8% |
| 1949-11-01 | 10.6% |
| 1949-12-01 | 10.0% |
| 1950-01-01 | 10.0% |
| 1950-02-01 | 10.5% |
| 1950-03-01 | 11.3% |
| 1950-04-01 | 13.4% |
| 1950-05-01 | 12.3% |
| 1950-06-01 | 12.3% |
| 1950-07-01 | 10.8% |
| 1950-08-01 | 10.5% |
| 1950-09-01 | 10.6% |
| 1950-10-01 | 10.9% |
| 1950-11-01 | 9.9% |
| 1950-12-01 | 8.1% |
| 1951-01-01 | 8.0% |
| 1951-02-01 | 9.4% |
| 1951-03-01 | 7.2% |
| 1951-04-01 | 7.2% |
| 1951-05-01 | 6.9% |
| 1951-06-01 | 5.6% |
| 1951-07-01 | 6.6% |
| 1951-08-01 | 6.0% |
| 1951-09-01 | 5.7% |
| 1951-10-01 | 4.6% |
| 1951-11-01 | 7.1% |
| 1951-12-01 | 5.2% |
| 1952-01-01 | 5.5% |
| 1952-02-01 | 4.5% |
| 1952-03-01 | 4.7% |
| 1952-04-01 | 6.3% |
| 1952-05-01 | 4.3% |
| 1952-06-01 | 3.6% |
| 1952-07-01 | 3.4% |
| 1952-08-01 | 3.0% |
| 1952-09-01 | 3.3% |
| 1952-10-01 | 4.8% |
| 1952-11-01 | 3.9% |
| 1952-12-01 | 6.2% |
| 1953-01-01 | 4.8% |
| 1953-02-01 | 4.8% |
| 1953-03-01 | 5.0% |
| 1953-04-01 | 3.9% |
| 1953-05-01 | 2.9% |
| 1953-06-01 | 5.8% |
| 1953-07-01 | 4.4% |
| 1953-08-01 | 4.0% |
| 1953-09-01 | 3.8% |
| 1953-10-01 | 3.4% |
| 1953-11-01 | 4.5% |
| 1953-12-01 | 4.0% |
| 1954-01-01 | 4.9% |
| 1954-02-01 | 4.6% |
| 1954-03-01 | 6.5% |
| 1954-04-01 | 7.6% |
| 1954-05-01 | 8.5% |
| 1954-06-01 | 8.8% |
| 1954-07-01 | 9.1% |
| 1954-08-01 | 11.0% |
| 1954-09-01 | 10.6% |
| 1954-10-01 | 12.3% |
| 1954-11-01 | 12.3% |
| 1954-12-01 | 12.1% |
| 1955-01-01 | 13.3% |
| 1955-02-01 | 14.7% |
| 1955-03-01 | 13.4% |
| 1955-04-01 | 13.5% |
| 1955-05-01 | 13.1% |
| 1955-06-01 | 12.2% |
| 1955-07-01 | 11.4% |
| 1955-08-01 | 9.9% |
| 1955-09-01 | 9.2% |
| 1955-10-01 | 8.6% |
| 1955-11-01 | 9.9% |
| 1955-12-01 | 10.4% |
| 1956-01-01 | 9.6% |
| 1956-02-01 | 10.6% |
| 1956-03-01 | 8.6% |
| 1956-04-01 | 7.7% |
| 1956-05-01 | 6.9% |
| 1956-06-01 | 6.2% |
| 1956-07-01 | 7.1% |
| 1956-08-01 | 8.7% |
| 1956-09-01 | 9.1% |
| 1956-10-01 | 9.5% |
| 1956-11-01 | 8.4% |
| 1956-12-01 | 9.2% |
| 1957-01-01 | 6.5% |
| 1957-02-01 | 8.6% |
| 1957-03-01 | 8.6% |
| 1957-04-01 | 9.0% |
| 1957-05-01 | 8.7% |
| 1957-06-01 | 8.9% |
| 1957-07-01 | 9.2% |
| 1957-08-01 | 8.4% |
| 1957-09-01 | 7.4% |
| 1957-10-01 | 9.6% |
| 1957-11-01 | 8.2% |
| 1957-12-01 | 7.4% |
| 1958-01-01 | 7.7% |
| 1958-02-01 | 8.1% |
| 1958-03-01 | 7.7% |
| 1958-04-01 | 10.5% |
| 1958-05-01 | 11.6% |
| 1958-06-01 | 14.2% |
| 1958-07-01 | 16.6% |
| 1958-08-01 | 19.0% |
| 1958-09-01 | 20.7% |
| 1958-10-01 | 20.3% |
| 1958-11-01 | 19.5% |
| 1958-12-01 | 19.2% |
| 1959-01-01 | 19.4% |
| 1959-02-01 | 18.3% |
| 1959-03-01 | 18.1% |
| 1959-04-01 | 18.2% |
| 1959-05-01 | 16.7% |
| 1959-06-01 | 15.9% |
| 1959-07-01 | 14.0% |
| 1959-08-01 | 13.4% |
| 1959-09-01 | 11.8% |
| 1959-10-01 | 11.4% |
| 1959-11-01 | 12.1% |
| 1959-12-01 | 12.6% |
| 1960-01-01 | 12.9% |
| 1960-02-01 | 13.0% |
| 1960-03-01 | 11.7% |
| 1960-04-01 | 11.9% |
| 1960-05-01 | 10.8% |
| 1960-06-01 | 10.5% |
| 1960-07-01 | 10.5% |
| 1960-08-01 | 10.4% |
| 1960-09-01 | 12.0% |
| 1960-10-01 | 13.4% |
| 1960-11-01 | 12.8% |
| 1960-12-01 | 11.8% |
| 1961-01-01 | 13.6% |
| 1961-02-01 | 13.7% |
| 1961-03-01 | 14.5% |
| 1961-04-01 | 16.9% |
| 1961-05-01 | 17.7% |
| 1961-06-01 | 18.9% |
| 1961-07-01 | 19.9% |
| 1961-08-01 | 19.0% |
| 1961-09-01 | 18.0% |
| 1961-10-01 | 17.9% |
| 1961-11-01 | 17.8% |
| 1961-12-01 | 17.3% |
| 1962-01-01 | 16.5% |
| 1962-02-01 | 17.7% |
| 1962-03-01 | 16.3% |
| 1962-04-01 | 16.2% |
| 1962-05-01 | 16.5% |
| 1962-06-01 | 15.2% |
| 1962-07-01 | 14.9% |
| 1962-08-01 | 14.7% |
| 1962-09-01 | 13.1% |
| 1962-10-01 | 13.3% |
| 1962-11-01 | 11.1% |
| 1962-12-01 | 12.8% |
| 1963-01-01 | 13.3% |
| 1963-02-01 | 14.0% |
| 1963-03-01 | 14.8% |
| 1963-04-01 | 14.7% |
| 1963-05-01 | 14.4% |
| 1963-06-01 | 12.4% |
| 1963-07-01 | 13.5% |
| 1963-08-01 | 13.2% |
| 1963-09-01 | 14.0% |
| 1963-10-01 | 13.3% |
| 1963-11-01 | 12.6% |
| 1963-12-01 | 12.3% |
| 1964-01-01 | 12.5% |
| 1964-02-01 | 12.4% |
| 1964-03-01 | 12.8% |
| 1964-04-01 | 12.1% |
| 1964-05-01 | 13.4% |
| 1964-06-01 | 13.1% |
| 1964-07-01 | 14.5% |
| 1964-08-01 | 13.7% |
| 1964-09-01 | 12.4% |
| 1964-10-01 | 11.7% |
| 1964-11-01 | 12.3% |
| 1964-12-01 | 11.9% |
| 1965-01-01 | 11.1% |
| 1965-02-01 | 11.0% |
| 1965-03-01 | 10.2% |
| 1965-04-01 | 10.3% |
| 1965-05-01 | 10.2% |
| 1965-06-01 | 10.7% |
| 1965-07-01 | 9.8% |
| 1965-08-01 | 10.0% |
| 1965-09-01 | 11.1% |
| 1965-10-01 | 10.8% |
| 1965-11-01 | 10.1% |
| 1965-12-01 | 9.9% |
| 1966-01-01 | 9.9% |
| 1966-02-01 | 9.5% |
| 1966-03-01 | 9.2% |
| 1966-04-01 | 9.0% |
| 1966-05-01 | 9.5% |
| 1966-06-01 | 7.9% |
| 1966-07-01 | 7.3% |
| 1966-08-01 | 7.0% |
| 1966-09-01 | 7.1% |
| 1966-10-01 | 7.9% |
| 1966-11-01 | 7.3% |
| 1966-12-01 | 7.5% |
| 1967-01-01 | 6.9% |
| 1967-02-01 | 6.9% |
| 1967-03-01 | 6.2% |
| 1967-04-01 | 6.1% |
| 1967-05-01 | 5.3% |
| 1967-06-01 | 5.0% |
| 1967-07-01 | 5.2% |
| 1967-08-01 | 6.7% |
| 1967-09-01 | 5.4% |
| 1967-10-01 | 5.6% |
| 1967-11-01 | 5.9% |
| 1967-12-01 | 6.5% |
| 1968-01-01 | 6.6% |
| 1968-02-01 | 5.9% |
| 1968-03-01 | 6.2% |
| 1968-04-01 | 5.5% |
| 1968-05-01 | 5.0% |
| 1968-06-01 | 5.4% |
| 1968-07-01 | 5.5% |
| 1968-08-01 | 5.5% |
| 1968-09-01 | 4.9% |
| 1968-10-01 | 5.0% |
| 1968-11-01 | 4.8% |
| 1968-12-01 | 6.0% |
| 1969-01-01 | 4.9% |
| 1969-02-01 | 4.3% |
| 1969-03-01 | 4.4% |
| 1969-04-01 | 4.8% |
| 1969-05-01 | 4.7% |
| 1969-06-01 | 4.4% |
| 1969-07-01 | 5.6% |
| 1969-08-01 | 4.6% |
| 1969-09-01 | 4.9% |
| 1969-10-01 | 4.5% |
| 1969-11-01 | 5.1% |
| 1969-12-01 | 4.6% |
| 1970-01-01 | 4.5% |
| 1970-02-01 | 4.6% |
| 1970-03-01 | 5.0% |
| 1970-04-01 | 5.3% |
| 1970-05-01 | 5.9% |
| 1970-06-01 | 5.5% |
| 1970-07-01 | 5.7% |
| 1970-08-01 | 5.9% |
| 1970-09-01 | 6.3% |
| 1970-10-01 | 5.6% |
| 1970-11-01 | 6.7% |
| 1970-12-01 | 7.6% |
| 1971-01-01 | 8.5% |
| 1971-02-01 | 9.2% |
| 1971-03-01 | 9.3% |
| 1971-04-01 | 9.2% |
| 1971-05-01 | 10.2% |
| 1971-06-01 | 10.9% |
| 1971-07-01 | 11.3% |
| 1971-08-01 | 10.6% |
| 1971-09-01 | 11.0% |
| 1971-10-01 | 11.7% |
| 1971-11-01 | 11.2% |
| 1971-12-01 | 11.4% |
| 1972-01-01 | 11.7% |
| 1972-02-01 | 13.4% |
| 1972-03-01 | 12.8% |
| 1972-04-01 | 13.6% |
| 1972-05-01 | 11.9% |
| 1972-06-01 | 11.2% |
| 1972-07-01 | 10.6% |
| 1972-08-01 | 10.8% |
| 1972-09-01 | 11.2% |
| 1972-10-01 | 10.6% |
| 1972-11-01 | 10.2% |
| 1972-12-01 | 10.2% |
| 1973-01-01 | 9.5% |
| 1973-02-01 | 8.4% |
| 1973-03-01 | 8.9% |
| 1973-04-01 | 7.5% |
| 1973-05-01 | 8.0% |
| 1973-06-01 | 7.5% |
| 1973-07-01 | 6.5% |
| 1973-08-01 | 7.7% |
| 1973-09-01 | 6.8% |
| 1973-10-01 | 8.0% |
| 1973-11-01 | 8.0% |
| 1973-12-01 | 7.4% |
| 1974-01-01 | 7.2% |
| 1974-02-01 | 7.1% |
| 1974-03-01 | 7.1% |
| 1974-04-01 | 7.6% |
| 1974-05-01 | 7.5% |
| 1974-06-01 | 7.4% |
| 1974-07-01 | 7.7% |
| 1974-08-01 | 7.7% |
| 1974-09-01 | 7.2% |
| 1974-10-01 | 7.2% |
| 1974-11-01 | 7.1% |
| 1974-12-01 | 8.1% |
| 1975-01-01 | 8.3% |
| 1975-02-01 | 9.7% |
| 1975-03-01 | 9.7% |
| 1975-04-01 | 11.9% |
| 1975-05-01 | 13.0% |
| 1975-06-01 | 15.8% |
| 1975-07-01 | 17.3% |
| 1975-08-01 | 18.3% |
| 1975-09-01 | 19.6% |
| 1975-10-01 | 18.0% |
| 1975-11-01 | 21.0% |
| 1975-12-01 | 20.3% |
| 1976-01-01 | 20.8% |
| 1976-02-01 | 21.0% |
| 1976-03-01 | 20.7% |
| 1976-04-01 | 19.7% |
| 1976-05-01 | 17.5% |
| 1976-06-01 | 18.3% |
| 1976-07-01 | 16.8% |
| 1976-08-01 | 16.9% |
| 1976-09-01 | 16.0% |
| 1976-10-01 | 16.4% |
| 1976-11-01 | 16.8% |
| 1976-12-01 | 17.6% |
| 1977-01-01 | 16.6% |
| 1977-02-01 | 16.2% |
| 1977-03-01 | 16.0% |
| 1977-04-01 | 16.1% |
| 1977-05-01 | 15.6% |
| 1977-06-01 | 14.4% |
| 1977-07-01 | 14.3% |
| 1977-08-01 | 12.9% |
| 1977-09-01 | 13.7% |
| 1977-10-01 | 13.4% |
| 1977-11-01 | 13.2% |
| 1977-12-01 | 13.4% |
| 1978-01-01 | 12.6% |
| 1978-02-01 | 10.6% |
| 1978-03-01 | 11.2% |
| 1978-04-01 | 11.1% |
| 1978-05-01 | 11.3% |
| 1978-06-01 | 10.5% |
| 1978-07-01 | 10.4% |
| 1978-08-01 | 10.1% |
| 1978-09-01 | 10.2% |
| 1978-10-01 | 10.0% |
| 1978-11-01 | 8.8% |
| 1978-12-01 | 8.2% |
| 1979-01-01 | 8.8% |
| 1979-02-01 | 9.0% |
| 1979-03-01 | 9.6% |
| 1979-04-01 | 9.0% |
| 1979-05-01 | 8.8% |
| 1979-06-01 | 8.8% |
| 1979-07-01 | 7.8% |
| 1979-08-01 | 8.5% |
| 1979-09-01 | 8.6% |
| 1979-10-01 | 8.5% |
| 1979-11-01 | 9.0% |
| 1979-12-01 | 8.6% |
| 1980-01-01 | 8.3% |
| 1980-02-01 | 7.6% |
| 1980-03-01 | 9.1% |
| 1980-04-01 | 9.3% |
| 1980-05-01 | 8.9% |
| 1980-06-01 | 9.6% |
| 1980-07-01 | 10.7% |
| 1980-08-01 | 11.3% |
| 1980-09-01 | 12.0% |
| 1980-10-01 | 13.1% |
| 1980-11-01 | 14.2% |
| 1980-12-01 | 14.8% |
| 1981-01-01 | 15.7% |
| 1981-02-01 | 15.5% |
| 1981-03-01 | 15.2% |
| 1981-04-01 | 14.4% |
| 1981-05-01 | 14.0% |
| 1981-06-01 | 14.0% |
| 1981-07-01 | 13.8% |
| 1981-08-01 | 14.5% |
| 1981-09-01 | 13.5% |
| 1981-10-01 | 13.2% |
| 1981-11-01 | 12.7% |
| 1981-12-01 | 12.6% |
| 1982-01-01 | 12.6% |
| 1982-02-01 | 13.2% |
| 1982-03-01 | 13.6% |
| 1982-04-01 | 14.6% |
| 1982-05-01 | 15.5% |
| 1982-06-01 | 17.0% |
| 1982-07-01 | 16.8% |
| 1982-08-01 | 17.0% |
| 1982-09-01 | 17.8% |
| 1982-10-01 | 19.5% |
| 1982-11-01 | 19.5% |
| 1982-12-01 | 21.3% |
| 1983-01-01 | 22.9% |
| 1983-02-01 | 23.5% |
| 1983-03-01 | 24.4% |
| 1983-04-01 | 24.6% |
| 1983-05-01 | 24.9% |
| 1983-06-01 | 26.0% |
| 1983-07-01 | 24.5% |
| 1983-08-01 | 23.6% |
| 1983-09-01 | 23.5% |
| 1983-10-01 | 23.1% |
| 1983-11-01 | 22.7% |
| 1983-12-01 | 22.0% |
| 1984-01-01 | 22.4% |
| 1984-02-01 | 20.8% |
| 1984-03-01 | 20.4% |
| 1984-04-01 | 20.3% |
| 1984-05-01 | 20.0% |
| 1984-06-01 | 19.3% |
| 1984-07-01 | 18.7% |
| 1984-08-01 | 17.6% |
| 1984-09-01 | 17.2% |
| 1984-10-01 | 17.1% |
| 1984-11-01 | 17.4% |
| 1984-12-01 | 16.7% |
| 1985-01-01 | 15.5% |
| 1985-02-01 | 16.2% |
| 1985-03-01 | 16.1% |
| 1985-04-01 | 16.4% |
| 1985-05-01 | 14.8% |
| 1985-06-01 | 15.3% |
| 1985-07-01 | 15.0% |
| 1985-08-01 | 14.9% |
| 1985-09-01 | 14.8% |
| 1985-10-01 | 14.5% |
| 1985-11-01 | 16.0% |
| 1985-12-01 | 14.8% |
| 1986-01-01 | 13.9% |
| 1986-02-01 | 14.1% |
| 1986-03-01 | 14.0% |
| 1986-04-01 | 13.9% |
| 1986-05-01 | 13.8% |
| 1986-06-01 | 15.0% |
| 1986-07-01 | 14.7% |
| 1986-08-01 | 14.7% |
| 1986-09-01 | 14.8% |
| 1986-10-01 | 14.8% |
| 1986-11-01 | 14.3% |
| 1986-12-01 | 14.6% |
| 1987-01-01 | 14.3% |
| 1987-02-01 | 14.2% |
| 1987-03-01 | 14.3% |
| 1987-04-01 | 14.4% |
| 1987-05-01 | 14.8% |
| 1987-06-01 | 14.5% |
| 1987-07-01 | 13.5% |
| 1987-08-01 | 14.5% |
| 1987-09-01 | 13.9% |
| 1987-10-01 | 13.3% |
| 1987-11-01 | 13.1% |
| 1987-12-01 | 13.0% |
| 1988-01-01 | 12.5% |
| 1988-02-01 | 12.9% |
| 1988-03-01 | 12.3% |
| 1988-04-01 | 12.3% |
| 1988-05-01 | 12.5% |
| 1988-06-01 | 12.3% |
| 1988-07-01 | 11.9% |
| 1988-08-01 | 11.7% |
| 1988-09-01 | 12.3% |
| 1988-10-01 | 11.8% |
| 1988-11-01 | 10.8% |
| 1988-12-01 | 11.4% |
| 1989-01-01 | 11.0% |
| 1989-02-01 | 10.0% |
| 1989-03-01 | 10.7% |
| 1989-04-01 | 11.0% |
| 1989-05-01 | 9.9% |
| 1989-06-01 | 9.3% |
| 1989-07-01 | 9.5% |
| 1989-08-01 | 8.7% |
| 1989-09-01 | 9.1% |
| 1989-10-01 | 9.8% |
| 1989-11-01 | 9.8% |
| 1989-12-01 | 9.6% |
| 1990-01-01 | 9.7% |
| 1990-02-01 | 9.4% |
| 1990-03-01 | 9.6% |
| 1990-04-01 | 9.5% |
| 1990-05-01 | 9.5% |
| 1990-06-01 | 9.5% |
| 1990-07-01 | 9.8% |
| 1990-08-01 | 10.2% |
| 1990-09-01 | 10.6% |
| 1990-10-01 | 10.4% |
| 1990-11-01 | 10.8% |
| 1990-12-01 | 10.6% |
| 1991-01-01 | 10.9% |
| 1991-02-01 | 10.9% |
| 1991-03-01 | 11.1% |
| 1991-04-01 | 11.6% |
| 1991-05-01 | 11.9% |
| 1991-06-01 | 12.6% |
| 1991-07-01 | 12.9% |
| 1991-08-01 | 13.5% |
| 1991-09-01 | 13.7% |
| 1991-10-01 | 13.9% |
| 1991-11-01 | 15.4% |
| 1991-12-01 | 16.4% |
| 1992-01-01 | 17.5% |
| 1992-02-01 | 18.1% |
| 1992-03-01 | 18.8% |
| 1992-04-01 | 18.9% |
| 1992-05-01 | 20.6% |
| 1992-06-01 | 21.3% |
| 1992-07-01 | 21.5% |
| 1992-08-01 | 21.0% |
| 1992-09-01 | 21.5% |
| 1992-10-01 | 23.1% |
| 1992-11-01 | 20.7% |
| 1992-12-01 | 21.4% |
| 1993-01-01 | 21.2% |
| 1993-02-01 | 20.7% |
| 1993-03-01 | 20.0% |
| 1993-04-01 | 18.2% |
| 1993-05-01 | 19.6% |
| 1993-06-01 | 19.5% |
| 1993-07-01 | 19.8% |
| 1993-08-01 | 20.1% |
| 1993-09-01 | 20.2% |
| 1993-10-01 | 20.4% |
| 1993-11-01 | 21.0% |
| 1993-12-01 | 20.8% |
| 1994-01-01 | 20.1% |
| 1994-02-01 | 20.7% |
| 1994-03-01 | 21.2% |
| 1994-04-01 | 21.3% |
| 1994-05-01 | 21.3% |
| 1994-06-01 | 19.9% |
| 1994-07-01 | 19.6% |
| 1994-08-01 | 19.6% |
| 1994-09-01 | 20.0% |
| 1994-10-01 | 20.8% |
| 1994-11-01 | 19.7% |
| 1994-12-01 | 18.9% |
| 1995-01-01 | 18.3% |
| 1995-02-01 | 17.2% |
| 1995-03-01 | 18.8% |
| 1995-04-01 | 18.7% |
| 1995-05-01 | 17.5% |
| 1995-06-01 | 16.8% |
| 1995-07-01 | 16.7% |
| 1995-08-01 | 16.3% |
| 1995-09-01 | 16.9% |
| 1995-10-01 | 16.5% |
| 1995-11-01 | 16.7% |
| 1995-12-01 | 16.4% |
| 1996-01-01 | 16.2% |
| 1996-02-01 | 16.5% |
| 1996-03-01 | 18.2% |
| 1996-04-01 | 18.3% |
| 1996-05-01 | 18.1% |
| 1996-06-01 | 19.4% |
| 1996-07-01 | 18.3% |
| 1996-08-01 | 18.2% |
| 1996-09-01 | 17.4% |
| 1996-10-01 | 16.7% |
| 1996-11-01 | 15.7% |
| 1996-12-01 | 16.1% |
| 1997-01-01 | 16.1% |
| 1997-02-01 | 15.7% |
| 1997-03-01 | 15.6% |
| 1997-04-01 | 16.2% |
| 1997-05-01 | 15.7% |
| 1997-06-01 | 15.8% |
| 1997-07-01 | 16.3% |
| 1997-08-01 | 16.2% |
| 1997-09-01 | 16.2% |
| 1997-10-01 | 16.0% |
| 1997-11-01 | 14.8% |
| 1997-12-01 | 15.4% |
| 1998-01-01 | 15.7% |
| 1998-02-01 | 15.2% |
| 1998-03-01 | 14.1% |
| 1998-04-01 | 14.7% |
| 1998-05-01 | 13.8% |
| 1998-06-01 | 12.6% |
| 1998-07-01 | 13.3% |
| 1998-08-01 | 13.2% |
| 1998-09-01 | 14.5% |
| 1998-10-01 | 13.6% |
| 1998-11-01 | 14.4% |
| 1998-12-01 | 13.5% |
| 1999-01-01 | 12.0% |
| 1999-02-01 | 13.2% |
| 1999-03-01 | 12.2% |
| 1999-04-01 | 11.4% |
| 1999-05-01 | 12.4% |
| 1999-06-01 | 13.7% |
| 1999-07-01 | 12.3% |
| 1999-08-01 | 12.1% |
| 1999-09-01 | 12.0% |
| 1999-10-01 | 12.4% |
| 1999-11-01 | 11.9% |
| 1999-12-01 | 12.1% |
| 2000-01-01 | 12.7% |
| 2000-02-01 | 10.8% |
| 2000-03-01 | 11.0% |
| 2000-04-01 | 10.7% |
| 2000-05-01 | 11.1% |
| 2000-06-01 | 11.2% |
| 2000-07-01 | 12.3% |
| 2000-08-01 | 12.2% |
| 2000-09-01 | 11.5% |
| 2000-10-01 | 11.3% |
| 2000-11-01 | 10.6% |
| 2000-12-01 | 11.4% |
| 2001-01-01 | 11.3% |
| 2001-02-01 | 11.7% |
| 2001-03-01 | 11.1% |
| 2001-04-01 | 11.0% |
| 2001-05-01 | 10.0% |
| 2001-06-01 | 11.2% |
| 2001-07-01 | 10.8% |
| 2001-08-01 | 12.2% |
| 2001-09-01 | 11.5% |
| 2001-10-01 | 11.8% |
| 2001-11-01 | 13.9% |
| 2001-12-01 | 13.6% |
| 2002-01-01 | 14.6% |
| 2002-02-01 | 14.9% |
| 2002-03-01 | 15.9% |
| 2002-04-01 | 16.8% |
| 2002-05-01 | 18.8% |
| 2002-06-01 | 19.6% |
| 2002-07-01 | 19.0% |
| 2002-08-01 | 18.9% |
| 2002-09-01 | 19.1% |
| 2002-10-01 | 19.9% |
| 2002-11-01 | 20.5% |
| 2002-12-01 | 22.1% |
| 2003-01-01 | 20.5% |
| 2003-02-01 | 21.8% |
| 2003-03-01 | 21.0% |
| 2003-04-01 | 21.9% |
| 2003-05-01 | 21.6% |
| 2003-06-01 | 22.8% |
| 2003-07-01 | 22.0% |
| 2003-08-01 | 22.2% |
| 2003-09-01 | 22.5% |
| 2003-10-01 | 22.4% |
| 2003-11-01 | 23.4% |
| 2003-12-01 | 23.1% |
| 2004-01-01 | 22.7% |
| 2004-02-01 | 22.9% |
| 2004-03-01 | 23.6% |
| 2004-04-01 | 22.1% |
| 2004-05-01 | 21.9% |
| 2004-06-01 | 22.5% |
| 2004-07-01 | 20.7% |
| 2004-08-01 | 20.3% |
| 2004-09-01 | 21.4% |
| 2004-10-01 | 21.5% |
| 2004-11-01 | 21.4% |
| 2004-12-01 | 20.8% |
| 2005-01-01 | 21.2% |
| 2005-02-01 | 20.4% |
| 2005-03-01 | 21.8% |
| 2005-04-01 | 21.0% |
| 2005-05-01 | 20.1% |
| 2005-06-01 | 18.5% |
| 2005-07-01 | 18.7% |
| 2005-08-01 | 18.9% |
| 2005-09-01 | 18.9% |
| 2005-10-01 | 18.9% |
| 2005-11-01 | 18.0% |
| 2005-12-01 | 18.7% |
| 2006-01-01 | 16.7% |
| 2006-02-01 | 18.7% |
| 2006-03-01 | 18.6% |
| 2006-04-01 | 18.6% |
| 2006-05-01 | 18.9% |
| 2006-06-01 | 16.6% |
| 2006-07-01 | 18.3% |
| 2006-08-01 | 18.3% |
| 2006-09-01 | 18.1% |
| 2006-10-01 | 15.9% |
| 2006-11-01 | 16.4% |
| 2006-12-01 | 16.2% |
| 2007-01-01 | 16.3% |
| 2007-02-01 | 18.0% |
| 2007-03-01 | 18.6% |
| 2007-04-01 | 17.4% |
| 2007-05-01 | 16.5% |
| 2007-06-01 | 16.4% |
| 2007-07-01 | 18.3% |
| 2007-08-01 | 17.5% |
| 2007-09-01 | 17.5% |
| 2007-10-01 | 17.7% |
| 2007-11-01 | 18.9% |
| 2007-12-01 | 17.4% |
| 2008-01-01 | 18.5% |
| 2008-02-01 | 17.8% |
| 2008-03-01 | 16.9% |
| 2008-04-01 | 17.7% |
| 2008-05-01 | 18.3% |
| 2008-06-01 | 18.2% |
| 2008-07-01 | 18.9% |
| 2008-08-01 | 19.8% |
| 2008-09-01 | 21.3% |
| 2008-10-01 | 22.3% |
| 2008-11-01 | 21.1% |
| 2008-12-01 | 23.1% |
| 2009-01-01 | 22.6% |
| 2009-02-01 | 23.4% |
| 2009-03-01 | 24.2% |
| 2009-04-01 | 27.1% |
| 2009-05-01 | 27.0% |
| 2009-06-01 | 29.0% |
| 2009-07-01 | 34.0% |
| 2009-08-01 | 34.3% |
| 2009-09-01 | 36.6% |
| 2009-10-01 | 36.6% |
| 2009-11-01 | 39.3% |
| 2009-12-01 | 40.4% |
| 2010-01-01 | 41.6% |
| 2010-02-01 | 40.8% |
| 2010-03-01 | 43.4% |
| 2010-04-01 | 45.3% |
| 2010-05-01 | 44.9% |
| 2010-06-01 | 44.8% |
| 2010-07-01 | 44.7% |
| 2010-08-01 | 42.6% |
| 2010-09-01 | 42.2% |
| 2010-10-01 | 42.6% |
| 2010-11-01 | 42.3% |
| 2010-12-01 | 44.7% |
| 2011-01-01 | 44.0% |
| 2011-02-01 | 43.3% |
| 2011-03-01 | 44.9% |
| 2011-04-01 | 42.9% |
| 2011-05-01 | 44.7% |
| 2011-06-01 | 44.3% |
| 2011-07-01 | 44.6% |
| 2011-08-01 | 43.2% |
| 2011-09-01 | 45.0% |
| 2011-10-01 | 42.7% |
| 2011-11-01 | 43.1% |
| 2011-12-01 | 42.9% |
| 2012-01-01 | 43.1% |
| 2012-02-01 | 41.8% |
| 2012-03-01 | 41.6% |
| 2012-04-01 | 40.8% |
| 2012-05-01 | 42.6% |
| 2012-06-01 | 41.9% |
| 2012-07-01 | 40.7% |
| 2012-08-01 | 40.0% |
| 2012-09-01 | 40.4% |
| 2012-10-01 | 40.9% |
| 2012-11-01 | 39.8% |
| 2012-12-01 | 39.1% |
| 2013-01-01 | 37.9% |
| 2013-02-01 | 39.7% |
| 2013-03-01 | 39.1% |
| 2013-04-01 | 37.4% |
| 2013-05-01 | 37.4% |
| 2013-06-01 | 36.9% |
| 2013-07-01 | 37.2% |
| 2013-08-01 | 38.0% |
| 2013-09-01 | 36.9% |
| 2013-10-01 | 36.0% |
| 2013-11-01 | 37.4% |
| 2013-12-01 | 37.7% |
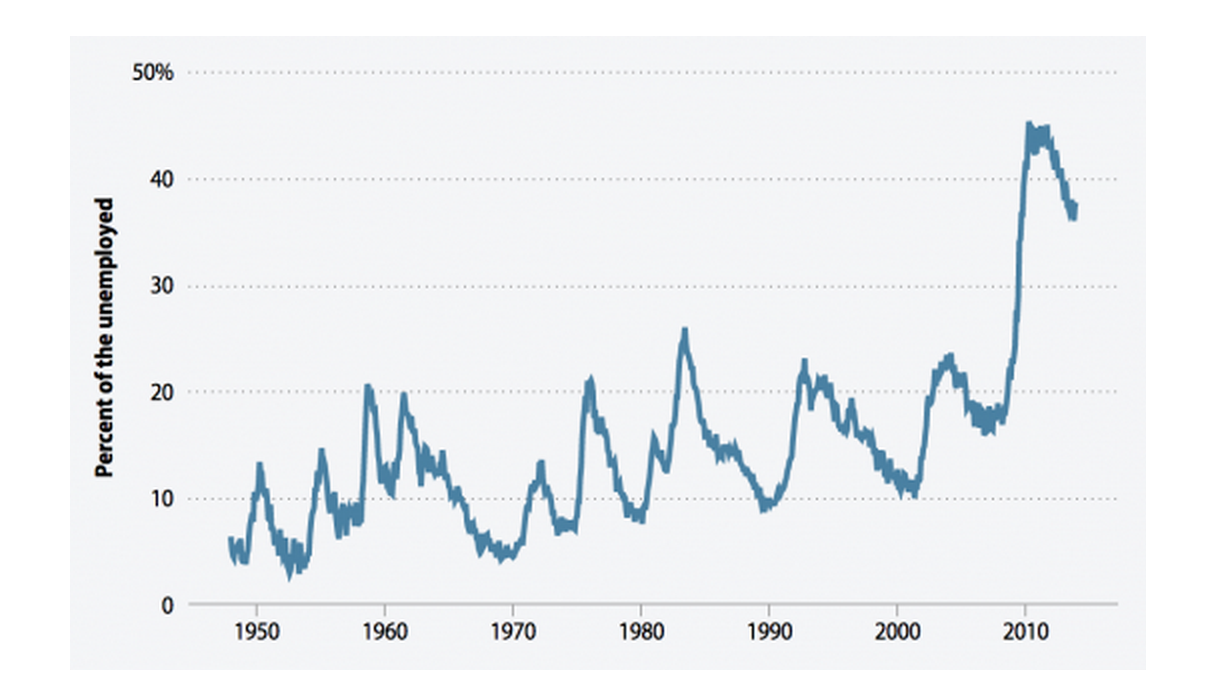

Source: Author's analysis of Bureau of Labor Statistics Current Population Survey public data series
Extensions of unemployment insurance benefits were allowed to expire last month—an unprecedented move given the weak state of the labor market. As Figure B shows, the share of the workforce that is long-term unemployed (i.e., jobless for more than six months) is nearly twice as high today as it was in any other period when we allowed an extended benefits program to expire following earlier recessions.
Long-term unemployment rate and months when extended unemployment insurance benefits were allowed to expire following recessions, January 1957–December 2013
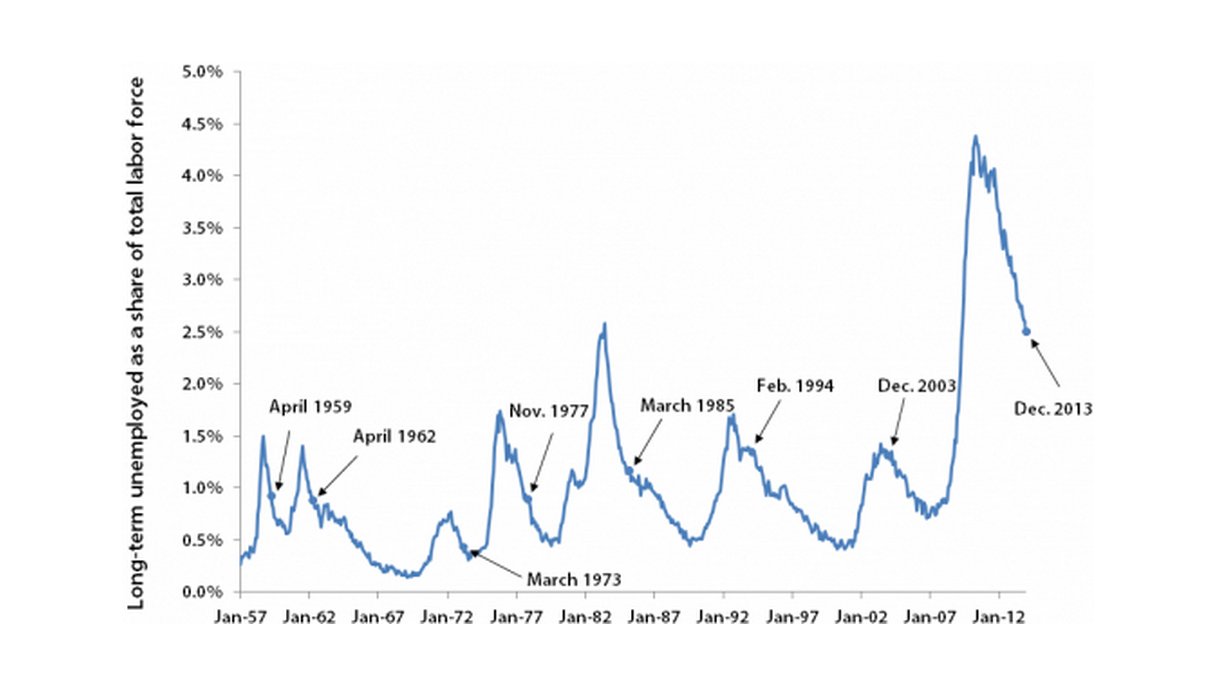
Note: Months in which a special extended benefits program expired are labeled.
Source: Author's analysis of Current Population Survey public data series; and Council of Economic Advisers/U.S. Department of Labor, The Economic Benefits of Extending Unemployment Insurance, December 2013, http://www.whitehouse.gov/sites/default/files/docs/uireport-2013-12-4.pdf
Wage growth is weak, and hours ticked down
Average hourly wages for all private-sector workers increased by two cents in December. Over the last three months, average hourly wages grew at a 1.3 percent annualized rate, a substantial decline from the pre-recession rate of wage growth. The length of the average workweek also ticked down, to 34.4 hours, which does not bode well for future growth. Average weekly wages, a measure that combines both hours and hourly wages, decreased by $1.73 in December. Consumer spending is unlikely to rise unless wage growth picks up, but wage growth is unlikely to pick up without robust job growth. The economic link between high unemployment and low wage growth is straightforward; employers do not need to pay sizable wage increases to get and keep the workers they need when job opportunities are so weak that workers lack other options.
Though the unemployment rate dropped in December, underemployment didn’t
The “underemployment rate” (officially, the U-6 measure of labor underutilization) is the Bureau of Labor Statistics’ most comprehensive measure of labor market slack. It includes not just the officially unemployed, but also the marginally attached (jobless workers who want a job and are available to work but have given up actively seeking work), and people who want full-time jobs but have had to settle for part-time work. This measure held steady at 13.1 percent in December. In December there were 20.6 million workers who were either unemployed or underemployed (10.4 million officially unemployed, 7.8 million involuntary part-time workers, and 2.5 million marginally attached). Racial and ethnic minorities have been particularly hard-hit by underemployment.
Unemployment remains elevated across the board
I described above how declines in the official unemployment rate in this recovery are dramatically overstating improvements in the health of the labor market due to potential workers dropping out of or never entering the labor market because job opportunities are so weak. However, it is useful to look at the unemployment rate across groups to examine how various groups are faring relative to one another. Table 1 shows the current unemployment rate and the unemployment rate in 2007, along with the ratio of those two values, for various demographic and occupational categories. There is currently substantial variation in unemployment rates across groups, as is always the case (note, for example, that it was true in 2007, before the recession began). It is important to note, however, that the unemployment rate is between 1.3 and 1.7 times as high now as it was six years ago for all age, education, occupation, gender, and racial and ethnic groups. Today’s sustained high unemployment relative to 2007 across all major groups underscores that the jobs crisis stems from a broad-based lack of demand. In particular, unemployment is not high because workers lack adequate education or skills; rather, a lack of demand for goods and services makes it unnecessary for employers to significantly ramp up hiring.
Unemployment rates of various demographic groups, 2007 and today
| 2007 | December 2013 | Ratio | |
|---|---|---|---|
| All | 4.6 | 6.7 | 1.5 |
| Male | 4.7 | 6.8 | 1.4 |
| Female | 4.5 | 6.5 | 1.4 |
| White | 4.1 | 5.9 | 1.4 |
| Black | 8.3 | 11.9 | 1.4 |
| Hispanic | 5.6 | 8.3 | 1.5 |
| Age 16–24 | 10.5 | 13.5 | 1.3 |
| Age 25–54 | 3.7 | 5.8 | 1.6 |
| Age 55+ | 3.1 | 5.1 | 1.6 |
| Workers age 25 and older | |||
| Less than high school | 7.1 | 9.8 | 1.4 |
| High school | 4.4 | 7.1 | 1.6 |
| Some college | 3.6 | 6.1 | 1.7 |
| Bachelor’s and advanced degree | 2.0 | 3.3 | 1.7 |
| Workers under age 25, not enrolled in further schooling | |||
| High school degree | 12.0 | 18.9* | 1.6 |
| Bachelor’s and advanced degree | 5.4 | 8.2* | 1.5 |
| Occupation | |||
| Management, professional, and related occupations | 2.1 | 3.6* | 1.7 |
| Service occupations | 5.9 | 8.6* | 1.5 |
| Sales and office occupations | 4.3 | 7.2* | 1.7 |
| Construction and extraction occupations | 7.6 | 12.5* | 1.6 |
| Installation, maintenance, and repair occupations | 3.4 | 5.4* | 1.6 |
| Production, transportation, and material moving occupations | 5.8 | 9.1* | 1.6 |
* This is a 12-month average (January 2013–December 2013), since this series is not seasonally adjusted.
Source: Author's analysis of the Current Population Survey public data series
— With research assistance from Alyssa Davis, William Kimball, and Hilary Wething