Briefing Paper #226
The offshoring of high-skill jobs, especially to low-cost countries like India and China, has received significant attention by America’s public and policy makers. It has been frequently highlighted in American media reports, and the U.S. Congress has held a number of hearings on it. The new offshoring phenomenon has arisen in a variety of policy debates, including health care, employment adjustment assistance, education, taxes, old-age pensions, and innovation. Innovation policy, in fact, has not only received attention, but unlike many of the other policy areas, changes have already been adopted through legislation (COMPETES 2007).1 Currently the policy approaches to how offshoring intersects with national innovation roughly fall into two camps. One set of leading experts asserts that America’s national innovation system (NIS) provides us a significant comparative advantage over other countries, an advantage that needs to be maintained and strengthened as high-skill jobs and sectors increasingly become internationalized (Blinder 2007b; Kenney 2007; Atkinson 2007). Maintaining the innovation advantage is paramount as other countries, especially developing ones, catch up technologically with the United States (National Academies 2005). These experts believe the primary problem with the U.S. NIS is a shortfall in research spending and human resources, thus they advocate for increases in government spending on basic research, especially in physical sciences and engineering, and in increases in human resource capacity. Increasing this human resource capacity would require a two-pronged approach: improving primary and secondary science and math education in order to increase the potential pool of students who could opt for tertiary science or engineering education, and promoting policies that will lead to an increase in the number of science and engineering degrees. But in addition to cultivating domestic human capital, these experts also call for a more liberal immigration regime to allow firms to import foreign scientists and engineers to meet human resource needs (National Academies 2005). These proposals, which often characterize the issue as a “crisis” for the United States, are made with an eye toward emerging economies like India and China, who are rapidly increasing their science and engineering capabilities. These proposals focus primarily on resource inputs (i.e., research spending and workers) for the U.S. innovation system, and ensuring that enough of those inputs are domestic. Although calls to strengthen domestic innovation and research spending are seen as a response to offshoring, in reality both innovation and R&D spending are increasingly being offshored.
Another group of policy experts sees the geographic distribution changes in science- and engineering-based inputs to innovation differently. They believe the emerging internationalization of science and engineering will offer the United States significant opportunities and that we are poised to capitalize on them. Hill (2007) believes we are now entering the “post-scientific society” where the United States should focus on assimilating and commercializing the research being done overseas. Hill believes that the natural sciences and engineering will become less important, and as a result, the location of where this expertise is produced is less important. Bhide (2008) believes that public benefits of R&D have been overstated, and that U.S. advantages are in entrepreneurship, where ideas and knowledge are commercialized. He argues that it is acceptable for U.S. resource inputs to move overseas because America can benefit from a greater stock of knowledge without paying for it, and because it reallocates those resources to speed up the diffusion and adoption of technologies. Salzman and Lynn (2006) argue that, rather than try to compete with other countries that are producing knowledge and innovation, U.S. policies need to focus on improving the ways in which the United States should see the opportunities for mutual gain in these partnerships and thus collaborate in global innovation networks.
Gomory (2007) is a notable exception to other experts in both his diagnosis and solutions to the offshoring of innovation. He suggests that increasing resource inputs is probably a good thing to do, but it is not sufficient. Instead he proposes changes in tax policy that favor employers who create high value-added jobs in the United States.
The larger problem faced by policy makers is that these various proposals are being made and adopted with limited knowledge about how much innovation and R&D is actually being done in low-cost countries. The indicators of India’s and China’s innovation and research capabilities offer a decidedly mixed picture. The data are sometimes conflicting, with some showing an unmistakable rise in their technological prowess, while other data show these countries terribly lagging. For example, in 2006 China was by far the leading exporter of advanced technology products to the United States, surpassing all of the European Union combined. While it was also a significant importer, China is running a large and increasing trade surplus in these types of products with the United States (National Science Foundation 2008). Yet not a single publicly traded Chinese company is a top 100 spender on R&D (Hira and Ross 2008). And the number of triadic patents—those filed in Europe, the United States, and Japan—awarded to Chinese inventors in 2002 was a mere 177 versus more than 18,000 for American and more than 13,000 for Japanese inventors (NSF 2007a, Table 15).
India’s indigenous information technology services companies, like Infosys and Wipro, have become the market leaders in their sector, forcing U.S.-based competitors like IBM and HP to adopt their offshore outsourcing business model. But, in 2003, India only produced 779 engineering doctorates compared to the 5,265 produced in the United States (NSF 2007a, Table 3).
What further complicates policy decisions is that the standard indicators in this area are backward looking and are often quite old before being published. Some more recent data on particular indicators point to a rapid rise in the innovative capabilities of India and China (Hu and Mathews 2008). R&D investment announcements by multinational firms provide a forward-looking indication of where China and India’s innovative capabilities are expected to be.
Another set of factors has been largely absent from the policy discussion, including a number of significant structural and institutional changes affecting the U.S. NIS that have been taking place. These include shifts in employment relations and the rise of the globally integrated enterprise; the internationalization of U.S. universities; and the uncertainty of the U.S. science and engineering labor market.
This paper reviews the structural changes affecting the NIS; examines some of the data on India and China’s capabilities; presents new data on the rise of the Indian information technology (IT) services industry (which defies traditional innovation indicators); compares innovation indicators with data on R&D investment announcements by multinational corporations; and finally presents some implications for U.S. innovation policy.
Structural and institutional changes affecting U.S. NIS
A number of significant structural and institutional changes are occurring in the United States. These changes will affect the nature of the U.S. NIS, the economic benefits flowing from it, and the effectiveness of particular policies designed to shape it. The Organisation for Economi
c Co-operation and Development (OECD) says that the NIS concept “stresses that the flows of technology and information among people, enterprises, and institutions are key to the innovative process.” (OECD 1997, 7). Outlined below are some of the changes in strategic behavior of key actors in the NIS. Because of the incipient nature of many of these changes, it is difficult to predict precisely how they will affect the U.S. NIS, and one can only speculate on some of the implications.
U.S. high-technology employment relations & the rise of globally integrated enterprises
During the past two decades there has been a significant shift in the employment relations between U.S. employers and their American scientists and engineers. Corporate decisions are increasingly being made with little regard to how they affect workers. IBM, a leading employer, shows how radically these practices have changed over the past 20 years. As recently as 1992 IBM never laid off an employee, but since 2002 it has policies in place that force its U.S. workers to train foreign replacements as a condition of severance and unemployment insurance (Bulkeley 2004). These practices have become quite widespread in the American technology sector. An American software engineer (Engineer 2007) working at a major semiconductor company put it this way, “The basic plan where I worked was to hire H-1Bs [foreign workers in the United States on temporary work permits], train them, and use them as a way to outsource and transfer technology to China. I trained my replacement who was here on an H-1B visa from India.” When asked if he would tell his story publicly, he demurred saying, “The company I worked for required I sign a several page agreement stating I would not discuss company information. My human resources representative and manager both made it clear that the company has never lost any challenge and has gone out of its way to destroy the lives of the people who have caused issues. They tell everybody this, not just me. They would brag about cases.” At the same time that this American engineer was training his foreign replacement, the CEO of his company was publicly complaining to Washington policy makers about a shortage of U.S. engineers.2
The breakdown of employment relations in the United States also adversely impacts private investments in workforce development. A recent InformationWeek magazine survey of nearly 10,000 IT professionals found that only 30% received tuition reimbursement (McGee 2008).
U.S. corporate leaders have been explicit about how they now manage their technology human resources. For example, in response to the discussion on offshoring and U.S. competitiveness, Craig Barrett, then CEO of Intel Corporation, said that his company can succeed without ever hiring another American (Friedman 2005). And in an article in Foreign Affairs magazine (Palmisano 2006), IBM CEO Sam Palmisano gave the eulogy for the multinational corporation (MNC), and introduced us to the globally integrated enterprise (GIE). Palmisano said, “Many parties to the globalization debate mistakenly project into the future a picture of corporations that is unchanged from that of today or yesterday….But businesses are changing in fundamental ways—structurally, operationally, culturally—in response to the imperatives of globalization and new technology.” The MNC model, where firms replicated their organization for each country where they sold, is now giving way to the GIE model, where firms geographically separate their production from the markets in which they sell. When discussing his firm’s aggressive moves to shift its share of workers to low-cost countries, Ron Rittenmeyer, CEO of EDS, the largest U.S.-based IT services firm, said he “is agnostic specifically about where” EDS locates its workers, choosing the place that reaps the best economic efficiency. By 2008, EDS had 43% of its workforce in low-cost countries, up from virtually zero in 2002 (Jackson 2008).
Firms are significant actors in the innovation process, and changes in their behavior will impact the U.S. NIS as well as the distribution of its benefits and costs. For example, advanced tools and technologies created or purchased by firms, will likely diffuse much more rapidly across borders, giving domestic technology workers diminished preferred-access advantage. There will also be larger shares of technology workers in low-cost countries, and possibly smaller workforces in the United States. This may affect new firms in the United States because technology workers not only create new knowledge, but they also are often an important source of entrepreneurship and start-up firms. Cross-border high-skilled labor-flow patterns are already beginning to shift, with greater numbers of foreign workers coming to the United States for temporary periods of time. These new arrangements may also make innovations less geographically sticky, raising questions about payoffs to public investments in R&D. Global firms will have access to knowledge created in low-cost countries, if they are not creating it themselves, and will be able to diffuse and exploit that new knowledge in their U.S. operations. In short, the distribution of inputs and the flow of technology, knowledge, and people will be altered by these changes in firm behavior.
Low-cost countries attract R&D sites
Another new phenomenon is competition by low-cost countries for R&D site selection. Defying the product life-cycle pattern of technological investments proposed by Vernon (1966), India and China have successfully attracted R&D and innovation facilities (Kenney 2007). Vernon argued that newly invented products were initially produced in developed countries, and only after they matured did production move to developing countries. Any R&D done in developing countries would be limited to localization, customizing the product for the domestic market (Hedge and Hicks 2008). The criteria used for placing R&D facilities are multifaceted, including lower labor and capital costs, proximity to markets, specialized talent, as well as government subsidies and incentives. Experts have also pointed out that some governments, especially China, are requiring companies to place R&D facilities and transfer technologies as a condition of access to the Chinese market (Atkinson 2007; McMillion 2007).
Recent surveys of corporate R&D managers indicate that India and China have become much more attractive as destinations for R&D investments. A survey by the U.N. Conference on Trade and Development of the top 300 worldwide R&D spenders found that China was the top destination for future R&D expansion, followed by the United States, India, Japan, the United Kingdom, and Russia (United Nations Conference on Trade and Development 2005). A survey of 248 R&D managers of U.S. and European MNCs, conducted by Thursby and Thursby (2007) for the National Academies Government University Industry Research Roundtable, found more firms had new or planned facilities, “central to overall R&D strategy,” to be located in China than the United States, and a large number are slated for India. The study also found that the managers expected R&D employment growth in India and China, and more respondents expected U.S. R&D employment to decline than those that expected it to increase. Their findings also point to a division of labor between R&D, where “new science” tended to be located in developed countries, whereas “familiar science” tended to be located in emerging economies. In 2007 The Economist magazine surveyed 300 executives about R&D site selection. They asked them to name the best overall location for R&D, excluding their home country. India was the top choice, followed by the United States and China (Canada followed as a distant fourth) (Kenney 2007). Eight of the top 10 R&D spending companies have R&D facilities in China or India, (Microsoft, Pfizer, DaimlerChrysler, General Motors, Siemens, Matsush
ita Electric, IBM, and Johnson & Johnson) (Atkinson 2007).
It appears that the emerging economies of India and China have leap-frogged certain stages of economic development by attracting private-sector R&D production. This may result in greater competitions amongst regions for attracting R&D investments. An important rationale for public sector investments in R&D is that it helps to attract co-located private-sector R&D investments. These public-sector investments, often accompanied by tax and other subsidies, may become less effective at attracting those private investments.
U.S. universities begin to internationalize
U.S. universities, long seen as providing a central role in the U.S. NIS, are beginning to internationalize in new ways. While these institutions have traditionally attracted large numbers of foreign students, particularly at the graduate level in science and engineering fields, they are beginning to take their education to foreign students by building campuses and offering science, technology, engineering, and mathematics (STEM) degree programs in other countries. Some, like Cornell, already identify themselves as transnational universities.
Offshoring is giving high-quality foreign students new job opportunities in their home countries making it less desirable to come to the United States to study. Those opportunities are increasingly with U.S.-based MNCs, creating new markets for universities. As a result, prominent U.S. universities are expanding their global footprints to tap a more geographically diffuse student pool, especially in India and China. While there are no definitive counts of foreign campuses and programs established by American universities, experts believe that more universities, particularly high-prestige ones, are venturing abroad. And the World Bank estimates that 150 of the 700 foreign degree programs operating in China are American. The American Council on Education identifies eight different drivers of the internationalization of American universities. Some of these include: increasing revenue; enhancing prestige; enhancing international research collaborations; exponential growth in demand in emerging economies of China and India; and enhancing study abroad opportunities for U.S. students (Green 2007). Cornell, which already operates a medical school in Qatar, sent its president to explore opportunities in India in 2007. And Cornell is not alone—many other engineering-intensive colleges, such as Rice, Purdue, Georgia Tech, and Virginia Tech, have made similar exploratory visits (Selingo 2007). Various programs have already been initiated by major engineering colleges. Carnegie-Mellon offers its technology degrees in India in partnership with a small private college there. Students take most of the courses in India, because it is less expensive, and then they spend six months in Pittsburgh to complete the Carnegie-Mellon degree (Sengupta 2007).
In parallel, to make their U.S. students more desirable in the job market, engineering colleges are providing more international experience for them. Most engineering educators expect that an increasing number of their graduates will be working in global teams on projects, so international educational experience is expected to translate into more effective workers. Currently, engineering students participate in study-abroad programs in disproportionately small numbers, so a number of engineering colleges have set goals to increase participation. About half of Worcester Polytechnic Institute’s graduating class goes overseas in some capacity. And through partnerships with universities around the world, Rensselaer Polytechnic Institute has set a goal to have 25% of its 2010 class study or travel abroad. Other universities, like the University of Rhode Island, are approaching internationalization of STEM education by emphasizing foreign-language training. Still others, like Purdue University, match up its students with students in other countries on international design teams.
University internationalization is still in its early stages and is still small in scale, but reports indicate that high-prestige U.S. universities have serious plans in the works to ramp up their overseas operations. Training U.S. students to be global may make them more competitive, but it may also accelerate offshoring, as they are better able to coordinate tasks spread out across countries. By creating campuses abroad, U.S. universities may change the patterns of flow of foreign students, at the undergraduate and graduate levels. It also creates more competition for U.S. STEM students who could have one of their competitive advantages diminished.
Uncertainty for U.S. STEM workers and students
The emerging opportunities for GIEs to take advantage of high-skilled talent in low-cost countries have introduced career uncertainty for the U.S. STEM workforce. Many U.S. STEM workers worry about offshoring’s impact on their career prospects (Hira and Hira 2008). According to the Taulbee survey, conducted by the Computing Research Association, enrollments in bachelors programs in computer science dropped an astounding 50% from 2002 to 2007. Rising risks for job loss in information technology, caused in part by offshoring, was a major factor in students shying away from computer science degrees (Zweben 2008). Other factors, such as the bursting of the dot-com bubble and record unemployment levels for IT workers, were also important contributors. But even as those factors have been mitigated, enrollments have not come back.
Offshoring concerns have been mostly concentrated on IT occupations, but many other STEM occupations may be at risk. Blinder (2007a) examined all 838 occupations as defined by the Bureau of Labor Statistics. He estimated that nearly all (35 of 39) STEM occupations are offshorable, many of which he describes as “highly vulnerable.” By vulnerable, Blinder is not claiming that all, or even a large share, of jobs in those occupations will actually be lost overseas. Instead, he claims that those occupations have characteristics that mean they will face significant new wage competition from low-cost countries. Blinder finds that there is no correlation between vulnerability and education level; that is, even occupations that require advanced education and skills are vulnerable.
Workers need to know which jobs will be geographically sticky and which are likely to be offshored. But because offshoring of white-collar jobs is still an incipient phenomenon, there is a great deal of uncertainty about how globalization will affect the level and mix of domestic STEM labor demand. The response of some workers appears to be to play it safe and opt for occupations that are likely to stay. In addition to the uncertainty introduced by offshoring, employment opportunities for some STEM occupations have become much more volatile (Hira 2003).
The uncertainty, caused by offshoring and labor market volatility, is changing the relative attractiveness of entering and staying in STEM fields, altering the makeup of the U.S. STEM workforce now and in the future. One immediate effect is that fewer students are opting for careers in STEM. Longer-term impacts on the national innovation system will depend on the makeup of the STEM workers.
Offshoring of innovation and R&D and its potential
Traditional leaders in science and technology are the United States, the European Union, Japan, and more recently Taiwan, Israel, Ireland, Singapore, and South Korea. The rise of India and China seem to be reported widely in the press, but many of the common R&D and innovation metrics provide a more nuanced picture. Some of those common indicators are examined below.
R&D services trade
The research, development, and testing (RDT) services sector is a relatively small and specialized industry sector comprising firms that complete contract research and other activities, such as environmental lab testing.
3 In 2003, RDT accounted for $12.5 billion (around 6%) of the $204 billion of R&D performed by industry in the United States (NSF 2007b). (The Bureau of Economic Analysis has only been capturing trade data for RDT since 1999.)
The United States ran a trade surplus in RDT of $3.4 billion, exporting $10.1 billion while importing $6.7 billion worth of these services in 2005 (NSF 2008). The surplus in 2005 was the lowest recorded level in the 2001-05 timeframe. While exports increased by 33% between 2001 and 2005 imports increased at almost double the rate (64%).
RDT trade data is further broken down by “affiliated” cross-border transactions within a multinational corporation (MNC), and “unaffiliated” cross-border transactions between independent firms. Most RDT trade, 79%, is between affiliates, and the United States ran a trade surplus in 2005, but imports are rising much faster than exports. Trade between affiliates is not reported by country, so we do not know the sources of the shifts in trade.
In unaffiliated trade, RDT went from a small surplus in 2001 of $321 million to a deficit of $1.0 billion in 2005, most of which was attributable to trade with Europe. For unaffiliated trade with India, the balance went from a very modest $15 million surplus in 2001 to a deficit of $43 million in 2005. Similarly, unaffiliated trade with China went from a $5 million surplus to a $15 million deficit. While the numbers are moving in a direction indicating a shift toward offshoring, the scale of the RDT trade with India and China are puny. The two countries combined only account for 3% of unaffiliated trade in RDT.
But RDT trade with many other locations with high-levels of R&D and innovation production are also quite small. For example, Japan, which is the third largest R&D spending country, accounts for only 7.6% of unaffiliated RDT trade, and other countries well-known for their innovation—Taiwan, South Korea, Israel—each account for about 1.0% (NSF 2007a). Even in well-established countries, RDT may be a poor indicator of shifts in R&D across borders. If R&D and innovation is increasingly produced in, and shifted to, India and China, then RDT may not reveal it.
It is also possible that cross-border RDT is undercounted. In 2005, unaffiliated imports from India were reportedly worth $61 million. HCL Technologies, a major India-based engineering firm, claims to have sold $512 million worth of R&D services in 2008 (Hira and Ross 2008). It is possible that significant shares of cross-border technology activities, especially in services, are simply not being picked up by the official data. As Sturgeon has pointed out measures of the services sector, particularly with respect to trade, are woefully inadequate (Sturgeon 2006). And the numbers that are reported by different government sources can vary quite dramatically. The U.S. Government Accountability Office (GAO) found that India reported exporting 20 times more business, professional, and technical services to the United States than the United States reported as imports of those services from India (U.S. GAO 2006).
Advanced (high-technology) trade balance
Other trade measures provide insight into the kinds of skills and capabilities required to produce tradable products. Again, there is widespread belief that high-skill, high-technology products are made in high-cost countries, and that low-skill, low-technology products are made in low-cost countries. But that is not the case.
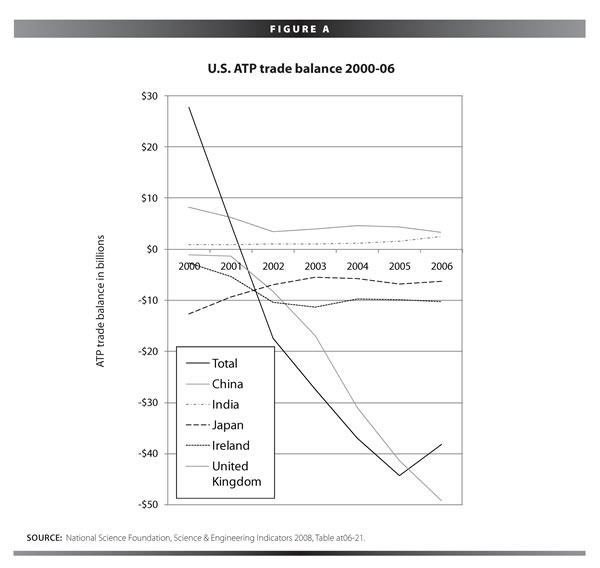
The United States is running large and growing trade deficits with China in the “advanced technology products” (ATP) category. Advanced technology products, defined by the Foreign Trade Statistics division of the Census Bureau, captures trade in goods (services are excluded) that require a high amount of research and development to produce. The ATP series was created in the late 1980s specifically to more easily identify the U.S. trade position in high-technology.
The United States began running a trade deficit in advanced technology products in 2002, and that deficit increased to $38 billion in 2006 as shown in Figure A. Much of the deficit can be attributed to the rapidly declining trade position with China, dating to its accession to the World Trade Organization in 2001.
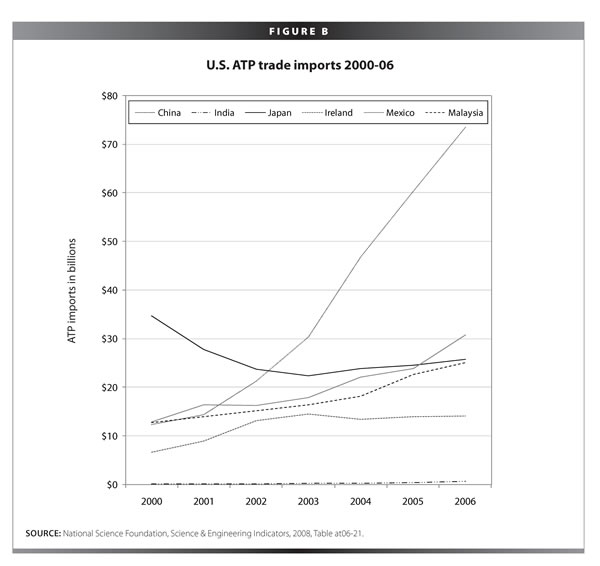
Now looking at exports and imports separately, China ranks number one for both exports and imports. The United States exported more ATP—$24 billion—to China than any other country in 2006, up more than two-fold from $11 billion and eighth place in 2000. But the remarkable story, as shown in Figure B, is the massive five-fold increase in ATP imports from China between 2000 and 2006, going from $12 billion and seventh place to $73 billion and a dominant first place (Mexico is a distant second at $31 billion), accounting for one-quarter of all U.S. ATP imports.
The importance of China’s rapid rise in ATP trade is in dispute. Some (Preeg 2008) believe it shows rapid technological advances, and coupled with China’s plan to spur indigenous innovation, it poses a significant threat to U.S. competitiveness. While others (Amiti 2008) believe it exaggerates China’s high-technology capabilities. They explain that it simply reflects global production networks, where production is increasingly fragmented across countries, and the rise in Chinese ATP exports is the result of export processing. While the end product might indeed be high-technology (i.e., China has content that required R&D and high-skilled labor), the portion produced in China only required relatively low-skill. Others explain that the increase in Chinese ATP exports are due mostly to foreign multinational investments, either wholly foreign-owned or joint-ventures, and that indigenous Chinese firms account for less than 10% of ATP exports. Furthermore, those exports are mostly in two sectors, information and communications technology and opto-electronics (Ferrantino et al. 2007).
In the case of India, the United States ran a slight surplus of $2.6 billion in 2006, up from $913 million in 2000. Exports to India increased from $1 billion and a rank of 28th in 2000 to $3 billion and a rank of 20th in 2006. Many predicted that India would become a large market for U.S. ATP exports, as the offshoring of IT services and “business process outsourcing” exploded. The prediction was that Indian workers would be buying “Dell computers” and telecommunications equipment from Americans. But it simply has not materialized. Information and communications ATP exports to India increased $470 million between 2003 and 2007, increasing from $650 million to $1.12 billion, while the Indian offshoring industry exploded (U.S. Census Bureau n.d.). Aerospace is the one sector that U.S. ATP exports have increased significantly.
R&D spending
When the OECD released data estimating that China overtook the Japan as the number two country in R&D spending, it raised a lot of eyebrows. As Figure C shows, China overtook Germany in 2002 and Japan in 2006 in R&D spending. While China remains below the United States, at $136 billion versus $338 billion in 2006, its recent (1999-2003) R&D spending growth has averaged 23% in comparison to 5% for the United States. (OECD 2006)
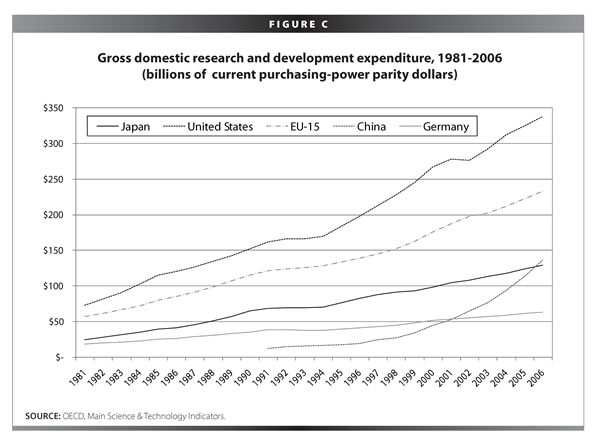
China’s spending on R&D is substantial and growing. A number of analysts have argued that, by using Purchasing Power Parity (PPP) exchange rates, the OECD is overstating China’s real R&D spending. While wage rates for researchers may be lower in China compared to the United States, the market prices for the lab equipment are likely equivalent. So absent an R&D specific PPP, ob
taining an apples-to-apples comparison is difficult. China’s spending is heavily weighted towards the development side of research and development (Einhorn 2007). (India’s R&D spending is not reported.)
Multinational R&D investments and linkages
U.S. MNCs performed about 85% of their R&D ($152 billion) at the parent company in the United States in 2004.4 About 15% ($28 billion) was performed by majority-owned foreign affiliates, most of which was performed in Europe. The foreign-affiliate share has risen slightly from 12% in 1994 (NSF 2008). China’s share was a modest 2% of the foreign affiliate R&D spending, accounting for just $622 million. India’s share was even less at 0.6%, or $163 million (NSF 2008).
Foreign MNCs performed $30 billion of R&D at their affiliates in the United States. The amounts from Chinese and Indian MNCs are so small that they do not appear in the data. About three-quarters of the R&D performed in the United States comes from European MNCs. While Foreign multinational R&D spending in the United States is higher than U.S. multinational spending abroad ($30 billion vs. $28 billion), the difference is small. The United States does not appear to be a major magnet for R&D (NSF 2008, Table 4-17).
Patents
Patents are another common proxy for research and innovation output. By this measure, the inventive activity of developing countries like India and China is quite low. In 2003, inventors from China were granted only 573 (0.3% of the total) U.S. patents, and inventors from India received only 341 (0.2% of the total). That same year U.S inventors received 87,901 patents (52% of the total), and Japanese inventors were awarded 35,517 (21%) (NSF 2007a). Some have argued that because many patents have limited economic value, analysts should use so-called triadic patents—those patents that are granted in Japan, Europe, and the United States, the three major markets—to try to identify high-value patents for products with global markets. By this measure, in 2002 Chinese inventors received 177 triadic patents (0.3% of the total), and Indian inventors were awarded 78 (0.2%). U.S. inventors were granted 18,324 (35.6%), and Japanese inventors received 13,195 (26%) of the worldwide total of triadic patents (NSF 2007a).
By patent measures, inventors in China and India are not inventing many products for the United States or global markets. But it may be just a matter of time before this activity increases. If we look at patent activity from South Korea and Taiwan, often referred to as the East Asian Tigers, we see that patents granted have increased markedly from 1990 to 2003. In the case of South Korea, the number of U.S. patents granted grew from 225 to 3,944, and in Taiwan’s case from 732 to 5,298 (NSF 2007a).
As of 2003, China and India were not very inventive, but then again their innovation systems are also quite immature. It may be simply a matter of time before we begin to see increases in patenting activity. Weak intellectual property regimes, however, may continue to hinder inventive activity in those countries.
Royalties from intellectual property
Royalties from intellectual property are another indicator of cross border flows of technology. The size of the flows is relatively small, with the United States receiving $4.8 billion from other countries and paying them $2.2 billion in 2003. The two-way royalty flow for the United States with both India and China are very small. The U.S. receipts from China were $100 million, and from India they were $22 million. U.S. payouts were even smaller, $3 million and $1 million, respectively (NSF 2007a).
While these values may begin to rise, they are unlikely to ever be very substantial. U.S. royalties from Japan were $1.3 billion, and payments to it were $524 million in 2003 (NSF 2007a).
Science and engineering articles
A significant output of research activities, especially academic research, is publishing articles. China’s article output increased more than four-fold between 1995 and 2005, moving it from being ranked 14th to fifth in just a decade. The 2005 Chinese output of around 42,000 articles still significantly lags the United States and European Union, each of which accounted for over 200,000 articles, but China’s scholarly article contribution is now three-quarters the size of Japan’s. India’s output, which was nearly equal to China’s in 1995, has increased at a much slower rate, with about 15,000 articles published by its scientists and engineers in 2005. It began 1995 and ended 2005 as the 12th ranked country.
A potentially more significant figure is how China has focused its efforts on particular technical fields. The data above include social as well as natural and physical sciences. China appears to be primarily investing in the physical sciences (engineering and mathematics). In engineering and chemistry, China became the second leading publisher of articles, supplanting Japan. And in physics and mathematics, it moved into third place (behind Japan and France, respectively) (NSF 2007a). In the leading-edge field of nanotechnology, China is now ranked number two, behind the United States, in number of nanotechnology papers published (Preeg 2008). By contrast, India was only in the top 10 in chemistry (seventh) and physics (10th), maintaining the same country ranking it had in 1995.
Just like patents, articles vary in quality, so citation counts are often used as a proxy for quality. China and India’s citation numbers still lag the United States, European Union, and Japan significantly. In the case of China, the citation counts are increasing, indicating improved quality, but this increase in citations has occurred at the same time as the overall quantity of articles has increased (NSF 2007a).
Human capital measures
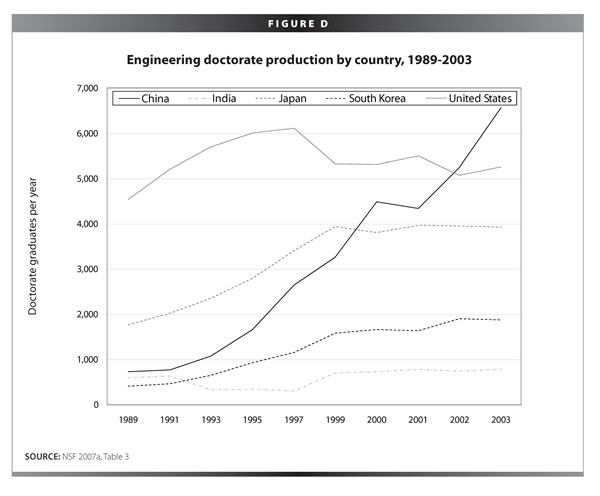
Chinese and Indians are responding to the increased opportunities in STEM occupations, from offshoring as well as overall growth. In India the response has been mostly in the private sector through a proliferation of private colleges and training academies. In China, the state has played a bigger role in expanding the talent pool at all levels, with a dramatic difference especially at the doctorate level.
As Figure D shows, India’s engineering doctorate production hardly budged from 1989 to 2003, but China’s production increased nine-fold, surpassing Japan in 1999 and America in 2002, moving to first place (NSF 2007a).
Explaining the competitive advantage of the Indian IT services industry
One of the most important high-technology stories of the past decade has been the remarkably swift rise of the Indian IT services industry. This sector includes India-based firms like Wipro, Infosys, TCS, Satyam, as well as U.S.-based firms like Cognizant and iGate that use the same business model. We do not need to speculate about whether the Indian firms will eventually take the lead in the sector sometime in the future; they already have become market leaders. By introducing an innovative, disruptive, operational business model, the Indian firms have turned the whole industry upside down in four short years. It caught the U.S. IT services firms—like IBM, EDS, CSC, and ACS—flat-footed. Not a single one of those firms would have considered Infosys, Wipro, or TCS as direct competitors as recently as 2003. The U.S. firms are now moving as fast as possible to adopt the Indian business model, moving as much work to low-cost countries as possible. The speed and size of the shift is breathtaking. IBM held a historic meeting with Wall Street analysts in Bangalore in June 2006, where the whole IBM executive team pitched their strategy to adopt the Indian offshore outsourcing business model. During the two-day event, accompanied by more than three
-hundred PowerPoint slides, the entire IBM executive team explained why they believed the talent pool in India and other low-cost countries will continue to deepen, and that IBM would be investing $6 billion to build their Indian operations (IBM 2006).
IBM’s headcount in India has grown from 6,000 in 2003 to 73,000 in 2007, and it is projected to be 110,000 by 2010 (Lakshman 2007). This compares to a headcount in the United States of about 120,000. Accenture passed a historic milestone in August 2007, when their India headcount of 35,000, surpassed any of their other country headcounts, including the United States, where it had 30,000 workers (Chatterjee 2007). In a 2008 interview with an IT trade publication, EDS chief executive Ron Rittenmeyer extolled the profitability of shifting tens-of-thousands of the company’s workforce from the United States to low-cost countries like India, and he outlined plans to continue the process through 2008. He said, “It’s [outsourcing], not just a passing fancy. It is a pretty major change that is going to continue. If you can find high-quality talent at a third of the price, it’s not too hard to see why you’d do this” (Jackson 2008). ACS recently told Wall Street analysts that it plans its largest increase in offshoring for 2009, when nearly 35% of its workforce will be in low-cost countries. The 2009 offshoring efforts will involve more complex and higher-wage jobs than in prior offshoring efforts, including jobs in application development and project management (Thibodeau 2008).
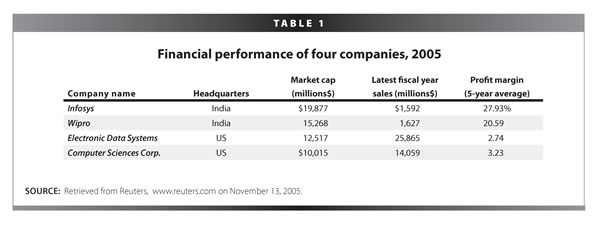
So, why have the U.S. firms so aggressively increased their low-cost country headcounts? The answer is that the Indian offshore outsourcing business model is significantly more profitable. Table 1 compares financial performance of four companies, two offshore outsourcing firms (Infosys and Wipro) against two of the largest U.S.-based IT service firms (EDS and CSC). The data are from 2005 because this was when U.S.-based IT services firms began to seriously ramp up their offshore presence. As can be readily discerned, the market capitalizations of Infosys and Wipro were much higher than EDS and CSC even though their sales were a small fraction. In other words, Wall Street was saying loud and clear that Infosys and Wipro were market leaders. The reason for the extraordinary valuations of Infosys and Wipro was their net profit margins (based on sales) were multiple times those of EDS and CSC. Infosys averages a remarkable 28% profit margin in an industry where 6% to 8% is considered a good year. Infosys maintained these margins while growing its revenues and headcount by 40% per year, so it comes with little surprise that the CEOs of EDS and CSC began to slash U.S. and European workforces and ramped up hiring in India and other low-cost countries.
Rapid growth has also enabled offshore outsourcing firms to raise extraordinary sums from public offerings on stock markets. At the same time in 2003 that Google was raising $1 billion in an initial public offering (IPO) on Wall Street, Tata Consultancy Services, the largest Indian IT firm, raised a similar amount with an IPO on the Indian stock exchanges.
R&D activities in China and India
Trends in R&D site selection are simply not tracked by the U.S. government, but recent announcements show that many are being placed in low-cost countries. For example, Applied Materials announced the opening of a major R&D complex in China in March 2007. According to Site Selection magazine, 22 of the 25 largest facility investments in semiconductor plants since January 2006 have occurred in Asia, including nine of the top 10. A University of Texas study recently found that of the 57 major global telecommunications R&D announcements in the past year, more than 60% (35 announcements) were located in Asia, whereas a meager 9% (five) were located in the United States.
According to the China’s Ministry of Commerce, Foreign MNCs have established 1,160 research institutions. There were 30 such institutions in 1999, approximately 200 by 2001, and 700 by 2005. These research institutions have to meet certain government standards to be counted.
And the major corporations are using many tactics to ensure that these investments pay-off. For example, the leading professional group representing R&D managers from U.S. MNCs is the Industrial Research Institute (IRI). A major initiative of the group, and “one of IRI’s fastest growing programs,” is what is called the China Forum for Senior Technology Executives. IRI has a program specifically targeted at foreign MNCs setting up shop in China and wanting to take advantage of indigenous innovation there. This is not an isolated effort. For example, Oracle Corporation underwrote a 2007 R&D meeting in China called China and R&D Globalisation: Integration and Mutual Benefits. The goals of the meeting were to explore:
• How can foreign R&D further contribute to the Chinese national innovation system?
• How can China better contribute to the global knowledge pool, through further integration into the global knowledge system, outward investments, exchanges of highly skilled human resources, and increasing international trade in knowledge, etc.?
• How to explore the unfulfilled potential for fruitful international cooperation between Chinese and foreign players in R&D and innovation.
• What specific aspects of framework conditions for innovation need to be improved in China in order to nurture a more fruitful interface between foreign R&D activities and Chinese domestic innovation capabilities?
• How can the design of China’s future NIS better integrate the role of foreign R&D activities with the outgoing R&D investment by Chinese firms?
There is no comprehensive list of R&D investments by U.S. multinational corporations, and they are not required to disclose geographic segment activities of R&D in financial filings. Below are some of the R&D activities. Two patterns seem to emerge from the data: the R&D activities and investments in India and China are relatively new, and they are growing. Figures in the parentheses show the firm’s R&D spending ranking (for U.S.-based firms only) and its spending for fiscal year 2007.
General Motors (#1, $8.1 billion)
GM in India
The India Science Lab, one of eight General Motors research labs, is located in Bangalore and was established in 2003. More than 70% of its researchers hold a Ph.D. (General Motors 2008b). Also, GM has created collaborative research laboratories with two Indian universities to focus on specific R&D topics. GM has nine such labs with universities, and two of the three outside the United States are in India (General Motors 2008a).
GM in China
In October 2007 General Motors announced it would build a wholly owned advanced research center in Shanghai to develop hybrid technology and other advanced designs. GM already has a 1,300-employee research center in Shanghai through a joint venture with Shanghai Automotive Industry Corporation (Bradsher 2007).
Pfizer (#2, $8.1 billion)
Pfizer in India
Pfizer has been outsourcing significant drug development services to India. Forty-four new drugs are under clinical trials involving 143 medical institutions and at least 1,800 patients. The company is now looking to expand into drug research in India through collaborations (Unnikrishnan 2007).
Pfizer in China
Pfizer has approximately 200 employees at its Shanghai R&D center, which supports global clinical development. It also uses a number contract research firms for some R&D there. It plans significant expansion of its R&D in China (Wadhwa, Rissing, Gereffi, Trumpbour, and Engardio 2008).
Microsoft (#5, $7.1 billion)
Microsoft in India
I
t employs more than 4,000 workers in India. The Microsoft India Development Center (an R&D center) was established in 1998. It has grown more than 10-fold since 2003, when it had 120 people (Economic Times 2007). With over 1,500 workers now, it is the largest development center outside the United States (Microsoft 2008c).
Microsoft in China
The Microsoft China R&D Group is over 10 years old and currently employs 1,500 workers. Activities are for both localization and global markets. The Microsoft China R&D Group focuses on the five areas: mobile and embedded technology, Web technology products and service, digital entertainment, server and tools, and emerging markets (Microsoft 2008b). Microsoft broke ground on a new $280 million R&D campus in Beijing in May 2008 (Microsoft 2008a). In November 2008, Microsoft announced it is significantly expanding its R&D operations in China by investing an additional $1 billion over the next three years, thus making it the largest R&D center behind the United States (Chien and Wei 2008).
Intel (#6, $5.8 billion)
Intel in India
Intel began with a sales office in 1988 and established an R&D center in 1998. It now has about 2,500 R&D workers in India, and it has invested approximately $1.7 billion in its Indian operations (Krishnadas 2008). In 2007, Intel’s Bangalore Development center contributed about half the work toward its “teraflop research chip” (Ribiero 2007). In September 2008, Intel unveiled its first microprocessor designed entirely in India, and the first time that 45 nanometer technology was designed outside of the United States. The Xeon 7400 microprocessor is used for high-end servers (Krishnadas 2008; Economic Times 2008). In 2005, Intel announced a planned investment of $800 million in India to expand research operations and an additional $250 million to launch a venture capital fund targeted at Indian start-ups (Hesseldahl 2005).
Intel in China
Intel is building a $2.5 billion 300mm semiconductor fabrication facility in Dalian, China, its first such facility in Asia (King and Ong 2008). In April 2008, Intel announced a $500 million Intel Capital China Technology Fund II to be used for investments in wireless broadband, technology, media, telecommunications, and “clean tech.” The first fund’s size was $200 million. Examples of Intel’s first China Fund company investments include Neusoft Group, Supcon Group, A8 Music, Chinacache International, Chipsbank Microelectronics, DAC, HiSoft Technology International, Kingsoft, Legend Silicon, Montage Technology, and Palm Commerce. Notable liquidity events involving portfolio companies from the first fund include Actions Semiconductor, Kingsoft, and Neusoft Group (Mutschler 2008).
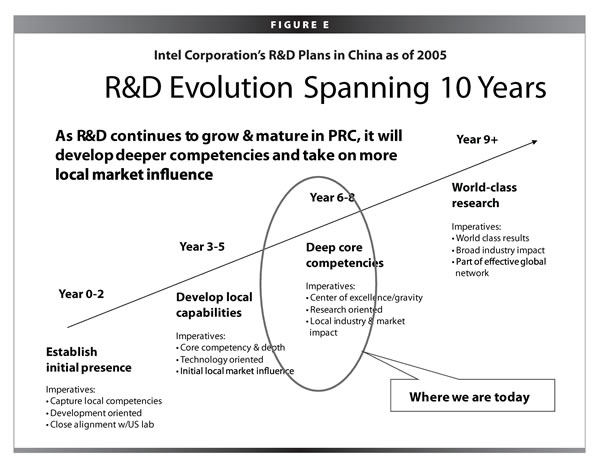
Figure E reproduces a slide from a May 2005 presentation by Peter Liou, former director Intel China Research Center on the future direction Intel’s R&D strategy in China (Liou 2005). The slide indicates that Intel’s China Research operations are expected to achieve world-class status before 2010.
Why the stats don’t match the business reality
If one read only the typical science and engineering indicators, as reported by the NSF, a particular image seems to appear. China is investing large sums in building up its R&D and innovation infrastructure, but the innovation outputs have been mixed, with healthy increases in publications and production of Ph.D.s, but a very limited number of patents. The huge increases in ATP trade seem almost independent of these actions. One view of China is that it is a matter of time before it becomes home to indigenous innovation. On the other hand, India appears to be significantly backward when it comes to the traditional innovation indicators. The government is not investing in R&D and innovation, and its research outputs, publications, and Ph.D. production have been stagnant for the past 20 years, yet it is able to attract foreign investments in R&D.
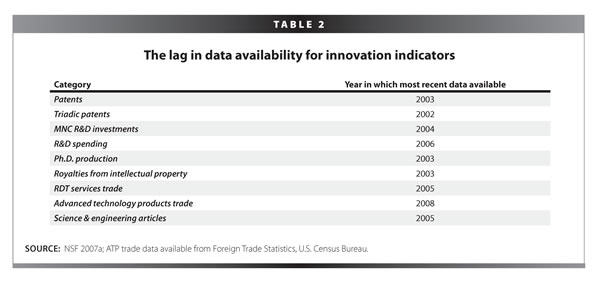
Contrast the official statistics with the buzz by management consultants and business school professors who promote India and China’s research capability right now. Why does the large gap exist? For one thing, Table 2 shows that the official data are stale. High-end offshoring is relatively new and growing fast. For example, IBM has increased its headcount in India more than ten-fold, from 6,000 in 2003 to 74,000 in 2007. Contrast that with the most recently available date that data are available.
Conclusion
China and India are both defying Vernon’s traditional product life-cycle model for international investments in technology. Businesses are making and increasing investments in R&D and innovation in emerging countries like China and India. However, the scale and scope of these investments is still not clear. China and India are likely on very different technological development trajectories.
China, whose export prowess is based on manufacturing, appears to be building its innovation system through major investments in R&D spending, attracting foreign firms and advanced education. While it has a major initiative to spur indigenous innovation, it is still too early to tell how fruitful those efforts will be. India, on the other hand, has built a specialization in white-collar services exports. These sectors generally do little formal R&D or patenting even though they are innovative. Indian indigenous firms are market leaders in key sectors like IT services, but India does not appear to be investing heavily in building its innovation system, instead relying on the private sector to take the lead.
The rise of India and China in these sectors will affect the U.S. NIS, which is already undergoing structural changes from shifts in employment relations, private-sector management strategies, university internationalization, and a more uncertain and volatile domestic STEM labor market. The U.S. NIS appears to be at the beginning stages of a significant transformation and the U.S. policy discussion needs to catch up.
Most forward-looking indicators point to a rapid increase in the offshoring of R&D and innovation, yet we have poor information on the nature of the work moving overseas. Is it advanced or mundane? Is there indigenous innovation, or is mostly being done by U.S.-based multinationals. The private sector has strong incentives to withhold from the public information on the offshoring of innovation, and our trade data on services are woeful. If, as many experts believe, leadership in innovation is key to U.S. competitiveness, the government needs to immediately collect detailed information on offshoring, including new data series that capture the realities of trade, investment, and job distribution in the age of globally integrated enterprises.
It is also clear that the structural changes in the U.S. NIS mean that the system will react differently to policy changes. Will government R&D investments result in the same kind of domestic production payoffs as in the past? Or do the downstream benefits of the development and production jobs leak out rapidly to countries that have lower costs, the technological capacity (human and infrastructure) to absorb those jobs, and the globally integrated enterprises that are able to transfer the technologies and knowledge more rapidly. The economic and national security outcomes of increased resource input into the innovation process are going to be different than they have been in the past. We need fresh thinking about policies that will re-shape the new NIS to achieve desired outcomes.
—Ron Hira is an assistant professor of public policy at Rochester Institute of Technology and author of Outsourcing America (AMACOM 2008).
The work for this paper was supported by a grant from the Alfred P. Sloan Foundation.
Endnotes
1. The America COMPETES Act was passed by Congress and signed into law as U.S. P.L. 110-69 in 2007. As the name suggests it was specifically crafted as a response to the perception that U.S. competitiveness is slipping.
2. To keep the worker’s identity anonymous, the company’s name is withheld.
3. RDT is NAICS industry group, 5417 and includes “establishments conducting original investigation undertaken on a systematic basis to gain new knowledge (research) and/or the application of research findings or other scientific knowledge for the creation of new or significantly improved products or processes (experimental development).” (http://www.census.gov/prod/ec02/ec0254slls.pdf, p.122)
4. http://www.nsf.gov/statistics/seind08/c4/c4s6.htm
References
Amiti, Mary. 2008. “Research and Development, Technological Advances in Key Industries, and Changing Trade Flows with China.” Testimony Before U.S. China Economic and Security Review Commission. July 16.
Atkinson, Robert D. 2007. “The Globalization of Innovation and R&D: How Do Companies Choose Where to Build R&D Facilities?” Testimony Before U.S. House Committee on Science and Technology, Subcommittee on Technology and Innovation. October 4.
Bhide, Amar. 2008. The Venturesome Economy: How Innovation Sustains Prosperity in a More Connected World. Princeton, N.J.: Princeton University Press.
Blinder, Alan S. 2007a. How Many U.S. Jobs Might Be Offshorable? Center for Economic Policy Studies Working Paper No. 142. Princeton, N.J.: CEPS.
Blinder, Alan S. 2007b. “The Globalization of Innovation and R&D: Overview.” Testimony Before U.S. House Committee on Science and Technology. June 12.
Bradsher, Keith. 2007. G.M. to build hybrid research center in China. The New York Times. October 29.
Bulkeley, William M. 2004. New IBM jobs can mean fewer jobs elsewhere. The Wall Street Journal. March 8, B1.
Chatterjee, Sumeet. 2007. Accenture to raise India staff to 35,000 by August. Reuters. January 29.
Chien, Kirby, and Michael Wei. 2008. Microsoft to spend $1bln on R&D in China. Reuters. November 13.
COMPETES. 2007. “U.S. Public Law 110-69.” America Creating Opportunities to Meaningfully Promote Excellence in Technology, Education, and Science Act. Washington D.C.
Economic Times. 2008. Intel unveils first made-in-India chip. Economic Times of India. September 17.
Economic Times. 2007. MS India Centre plans tie-ups with universities. Economic Times of India. June 8.
Einhorn, Bruce. 2007. “The OECD Takes a Second Look at Chinese R&D.” Eye on Asia Blog, BusinessWeek.com. August 30. http://www.businessweek.com/globalbiz/blog/eyeonasia/archives/2007/08/the_oecd_takes.html. (accessed November 10, 2008).
Engineer. 2007. Interview by Ron Hira. Personal interview with author, June 1.
Ferrantino, Michael, Robert Koopman, Zhi Wang, Falan Yinug, Ling Chen, Fengjie Qu, and Haifeng Wang. 2007. Classification and Statistical Reconciliation of Trade in Advanced Technology Products: The Case of China and the United States. Brookings-Tshingua Center for Public Policy Working Paper Series.
Friedman, Thomas L. 2005. Tuning in to Jon Stewart, and Britney Schmidt. The New York Times. May 6.
General Motors. 2008a. “Global R&D Network.” http://www.gm.com/experience/technology/research/global_rd_network/index.jsp.
General Motors. 2008b. “India Science Lab.” Research & Development Organization Overview. http://www.gm.com/experience/technology/research/overview/isl/isl.jsp (accessed November 10, 2008).
Gomory, Ralph E. 2007. “The Globalization of Innovation and R&D: Overview.” Testimony Before U.S. House Science and Technology Committee. June 12.
Green, Madeleine. 2007. Venturing Abroad: Delivering U.S. Degrees Through Overseas Branch Campus. Washington D.C.: American Council on Education.
Hedge, Deepak, and Diana Hicks. 2008. The maturation of global corporate R&D: Evidence from the activity of U.S. foreign subsidiaries. Research Policy. Vol. 37, pp. 390-406.
Hesseldahl, Arik. 2005. Intel’s eager passage to India. BusinessWeek. December 6.
Hill, Christopher T. 2007. The post-scientific society. Issues in Science & Technology. Fall.
Hira, Ron. 2003. Boom-bust: New paradigm for EE jobs. Research Technology Management. Vol. 46, No. 2 (March/April), pp. 5-8.
Hira, Ron, and Anil Hira. 2008. Outsourcing America: The True Cost of Shipping Jobs Overseas and What Can Be Done About It. New York: AMACOM.
Hira, Ron, and Phillip E. Ross. 2008. “R&D Goes Global.” IEEE Spectrum On-Line. November 2008.
Hu, Mei-Chih, and John A. Mathews. 2008. China’s national innovative capacity. Research Policy. Vol. 37, pp. 1465-79.
IBM. 2006. IBM global briefing. IBM.com. June 6. http://www.ibm.com/investor/events/global0606/.
Jackson, Brian. 2008. “EDS CEO says no problem.” ITBusiness.ca. April 23. http://www.itbusiness.ca/it/client/en/home/DetailNewsPrint.asp?id=48091.
Kenney, Martin. 2007. “The Globalization of Innovation and R&D: How Do Companies Choose Where to Build R&D Facilities? Testimony before U.S. House Committee on Science and Technology. October 4.
King, Ian, and Janet Ong. 2008. “Intel Forms $500 Million Fund for China Investments.” Bloomberg.com. April 8.
Krishnadas, K.C. 2008. With assist from Intel, India designs first microprocessor. EE Times. September 16.
Lakshman, Nandini. 2007. IBM’s big deal in India. BusinessWeek. December 28.
Liou, Peter. 2005. May 28. http://www.csun.edu/~ys9503/Nanjing_meeting/Open%20Forum/Peter_Liou.ppt.
McGee, Marianne Kolbasuk. 2008. “Info Tech Salaries Drop, Our Survey Finds. What’s Holding U.S. Pay Down?” InformationWeek.com. April 26. http://www.informationweek.com/news/management/careers/showArticle.jhtml?articleID=207401820 (accessed August 30, 2008).
McMillion, Charles W. 2007. China’s Soaring Financial, Industrial and Technological Power. Unpublished. Washington D.C.: Small Business Administration.
Microsoft. 2008a. “Microsoft Breaks Ground on New R&D Campus.” Press Release. http://www.microsoft.com/china/CRD/en/newsrelease/press20080506.mspx.
Microsoft. 2008b. “Microsoft China R&D Group Overview.” http://www.microsoft.com/china/CRD/EN/overview.mspx.
Microsoft. 2008c. “Microsoft India Development Center.” http://www.microsoft.com/india/msidc/default.aspx.
Mutschler, Ann Steffora. 2008. Intel puts $500M toward 2nd China fund. EDN. April 8.
Nation
al Academies. 2005. Rising Above The Gathering Storm. Washington D.C.: National Academy of Sciences.
National Science Foundation. 2007a. Asia’s Rising Science & Technology Strength: Comparative Indicators for Asia, European Union, and the United States. NSF 07-319. Arlington, Va.: NSF.
National Science Foundation. 2007b. Research and Development in Industry: 2003. Arlington, Va.: NSF.
National Science Foundation. 2008. Science & Engineering Indicators 2008. Arlington, Va.: NSF.
Organization for Economic Cooperation & Development. 2006. “China will become world’s second highest investor in R&D by end of 2006, finds OECD.” OECD.org. http://www.oecd.org/document/26/0,2340,en_2649_201185_37770522_1_1_1_1,00.html (accessed August 2, 2008).
Organization for Economic Cooperation & Development. 1997. National Innovation Systems. Paris: OECD.
Palmisano, Samuel J. 2006. The globally integrated enterprise. Foreign Affairs. Vol. 85, No. 3 (May/June): 127.
Preeg, Ernest H. 2008. “Technological Advances in Key Industries in China.” Testimony before the U.S.-China Economic and Security Review Commission. Washington D.C. July 16.
Ribiero, John. 2007. India plays growing role in Intel R&D. Infoworld. February 22. http://www.infoworld.com/article/07/02/22/HNindiaintelrandd_1.html.
Salzman, Harold, and Leonard Lynn. 2006. Collaborative Advantage. Issues in Science & Technology. Winter, pp. 74-82.
Selingo, Jeffrey. 2007. Cornell courts a subcontinent. Chronicle of Higher Education. March 2.
Sengupta, Somini. 2007. India attracts universities from the U.S. The New York Times. March 26.
Sturgeon, Timothy J. 2006. Why We Can’t Measure The Economic Effects Of Services Offshoring: The Data Gaps And How To Fill Them. Industrial Performance Center, MIT. Cambridge, Mass.: MIT.
Thibodeau, Patrick. 2008. Outsourcing vendor ACS to move ‘higher-level’ IT jobs offshore. ComputerWorld. November 3.
Thursby, Jerry, and Marie Thursby. 2007. “Factors in International Location and Type of Corporate R&D.” Testimony before the U.S. House Committee on Science & Technology. Washington D.C. October 4.
U.S. Census Bureau. “Foreign Trade Statistics, Advanced Technology Product Data.”
http://www.census.gov/foreign-trade/statistics/product/atp/select-atpctry.html (accessed November 12, 2008).
U.S. Government Accountability Office. 2006. U.S. and India Data on Offshoring Show Significant Differences. Washington D.C.: U.S. GAO.
United Nations Conference on Trade and Development. 2005. World Investment Report 2005: Transnational Corporations and the Internationalization of R&D. New York: United Nations.
Unnikrishnan, C.H. 2007. Pfizer to look at India, China for collaborations. The Wall Street Journal. December 18.
Vernon, Raymond. 1966. International investment and international trade in the product cycle. The Quarterly Journal of Economics (The MIT Press). Vol. 80, No. 2 (May), pp. 190-207.
Wadhwa, Vivek, Ben Rissing, Gary Gereffi, John Trumpbour, and Pete Engardio. 2008. The Globalization of Innovation: Pharmaceuticals. Duke University, Kauffman Foundation, Vol. 43.
Zweben, Stuart. 2008. 2006-2007 Taulbee survey. Computing Research News. May.