Briefing Paper #224
See also EPI’s Basic Family Budget Calculator
How much income do families need to make ends meet? The question has profound implications for public and social policy, yet it is a challenge to answer with precision because, though seemingly simple, it is actually quite complex. First of all, we need to ask, which type of family? Working families, single-parent families, families with two adults and two children, four children? And what does it mean to make ends meet? Are we thinking about basic sustenance levels—housing, food, clothing—and keeping a step ahead of hunger or eviction? Or do we have something in mind more in keeping with middle-class levels of consumption? And what about savings? Does making ends meet include setting aside funds for a medical emergency, college tuition, or retirement?
These questions form the core of family budget research, which attempts to move beyond relative comparisons of economic well-being and derive the absolute amounts of resources that families need to meet their basic needs.1
Research on poverty measurement, a particularly useful field given that the official poverty measure is vastly outdated, is a cousin of family budget analysis yet it differs in fundamental ways. First, family budgets set a higher consumption bar than the poverty thresholds, meaning they allow for more consumption of goods and services than do poverty lines. Second, constructing these budgets, though it involves vast amounts of data from every metropolitan statistical area in the country, is a simpler endeavor than measuring poverty. Family budgets tally the various costs of each budget component, with no regard for the income adjustments that are critical to poverty research. For example, family budgets cost out health insurance for each geographic area and for each type of family that might theoretically buy it, but much contemporary poverty research attempts to figure out how much individuals are actually spending out-of-pocket on health care. Third, family budgets have more geographical variation than poverty thresholds. Finally, these budgets are derived for only a few representative family types, while poverty thresholds cover all possible family types.2
The key findings of this report, which updates an earlier EPI study calculating family budgets (Allegretto 2005), include the following:
- On average nationwide, working families with two parents and two children require an income of $48,778 to meet the family budget. In major urban areas, expenses for this four-person family range from $42,106 in Oklahoma City to $71,913 in Nassau/Suffolk, N.Y.; families in small towns and rural areas start from a low of $35,733 in Marshall County, Miss. to $73,345 in Nantucket and Dukes Counties, Mass.
- Much of the regional variation in family budgets is pushed by price differences in just a few items: housing, health care, and child care.
- Young families, families with a low degree of education, and minority families face substantially greater difficulties meeting the economic standards set out by these budgets.
- Over three times as many families fall below family budget thresholds as fall below the official poverty line.
What do family budgets consist of?
Family budgets calculated by EPI represent the pre-tax (taxes are included as a budget category) annual family income required to maintain a safe but modest standard of living. The budgets have seven components (see “2008 Economic Policy Institute Family Budgets, Technical Documentation” for details):
Housing: Family budget calculations assume that families rent their housing and are paying the 40th percentile (sometimes 50th percentile) market price in each area (roughly the median rent in an area or a little below). The numbers used are gross rent estimates, which include “shelter rent plus the cost of all tenant-paid utilities, except telephones, cable or satellite television service, and internet service.”3 Data are derived from the fair market rents calculated by the U.S. Department of Housing and Urban Development.
Food: Costs of food are based on the U.S. Department of Agriculture official food plans, which estimate a family’s cost for a nutritionally adequate diet. Our calculations use the “low-cost plan,” which is a very basic diet that assumes almost all food is prepared in the home.
Child care: Child care data, derived from the Children’s Defense Fund, represent (in most cases) the cost of sending a four-year-old and/or eight-year-old child to center-based child care. These data were adjusted with the consumer price index (CPI) child care and nursery school index, rather than the CPI-U index, which is the price index for “all urban consumers,” because costs for child care increased more rapidly than did the overall price index.
Transportation: Data on distance traveled per household were extracted from the National Household Travel Survey, a national-level survey inventorying civilian travel habits, and the cost of traveling that distance was calculated using the Internal Revenue Service’s cents-per-mile estimate, which is the standard rate employers use to reimburse employees for work travel.
Health care: Although evidence suggests that health insurance is an expense that many families forego in order to make ends meet, family budgets assume that all families have health insurance either through an employer or through a non-group plan they have purchased independently. We estimate this cost for all families by taking the weighted averages of the employee share of employer-sponsored health care premiums, the share of families in non-group health insurance plans, and the share of expenses that go to out-of-pocket costs such as co-payments. Our estimate of the cost of non-group health insurance plans is based on a health maintenance/preferred provider organization modest-coverage plan with a $500 deductible, a 20% co-insurance rate, and a $15-20 co-payment.
Other necessities: These represent costs incurred by families for items that are not included above, such as clothing, entertainment, personal care products and services, reading materials, educational materials, and other miscellaneous but mostly necessary items.
Taxes: The portion of family budgets that are paid as state and federal taxes was computed as follows. First, we sum the above categories in order to calculate the post-tax income required for a family to meet its basic needs. We then calculate a gross income level such that, after paying federal and state taxes (if it owes any), the family would be left with that amount of post-tax income.
Higher expenses for bigger families
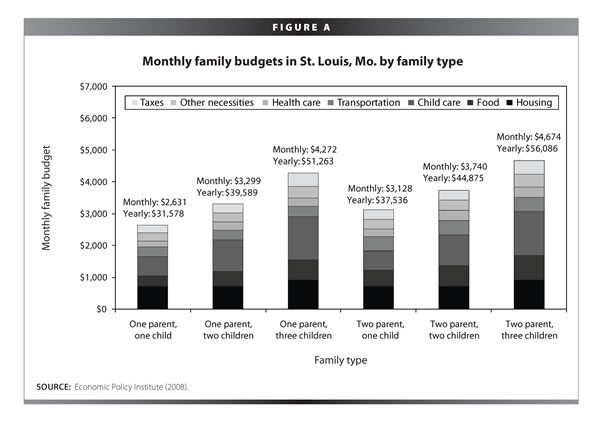
Budgets rise significantly with family size (see Figure A), since more children require more housing, food, health care, and child care. Some items, such as transportation, don’t change much with family size, but an expense like child care does. In St. Louis, the example used in the figure, child care consumes about a fifth of the budget for a one-child family, but for a family with three children it accounts for nearly a third.
Big geographic differences across the United States
As with family types, many costs also vary widely by geographic area, yet neither the consumer price index nor the poverty measure accounts for these differences.4
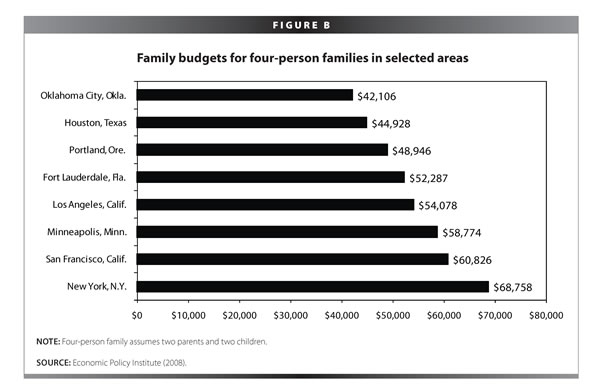
Figure B, which compares the budgets for a family of four in several different urban areas, depicts the importance of accounting for geographic differences in the cost of living. For a family to afford the same standard of living in New York City as in Oklahoma City, it would need over $26,000 more in annual income. The difference is even greater—almost $30,000—between Oklahoma City and Nassau and Suffolk Counties in New York, where a family needs $71,913 in annual income. Boston and San Francisco follow closely behind New York City. Among small towns and rural areas, annual budgets range from $35,733 in Marshall County, Miss. to $73,345 in Nantucket and Dukes Counties, Mass. For the nation overall, the average family budget for a two-parent family with two children is $48,778, far above the official poverty threshold of $21,027.
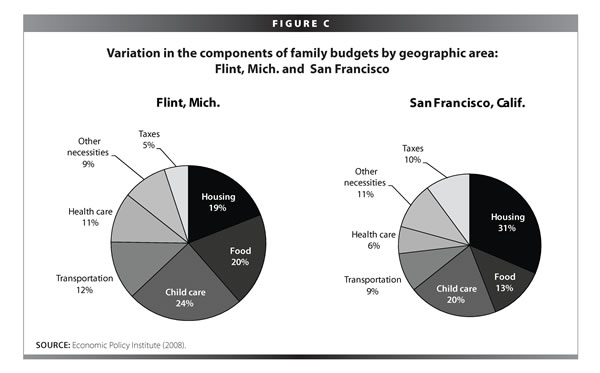
This high degree of variation in family budgets across geographic areas is due to the range of costs for three particular items: housing, health care, and child care. Figure C compares the share of family budgets taken up by each of these components in two different areas—Flint, Mich. and San Francisco for two-parent, two-child families. In Flint, families can expect about a fifth of their budgets to be spent on housing, a tenth on health care, and a quarter on child care. For a family in San Francisco, housing requires nearly a third of family income, child care about a fifth, and health care just 6%. Taxes consume about twice as much income for San Franciscans as they do for families in Flint, whereas families in Flint have to spend a much higher share on food (20% versus 13%).
The characteristics of families below the family budget line
Given that half of American families earned less than the median family income of about $61,000 in 2007 (the latest year of available data), it should not be surprising that a large share are also earning less than the family budget average of $48,778.5 Table 1 compares the share of these families to the share making less than the poverty line and the share making less than twice the poverty line. In the United States, about 30% of people live in families with incomes below family budgets, about the same as those below twice the poverty threshold (27.9%). A much smaller share—less than 10%—falls below the poverty threshold (these statistics are only for persons in the family types shown in Figure A). Overall, young families, larger families, urban families, families headed by a non-college-educated person, and minority families are more likely to fall below the budget levels. Among the latter, over 50% of African American and Hispanic families fall below family budgets, compared to about 20% of white families.
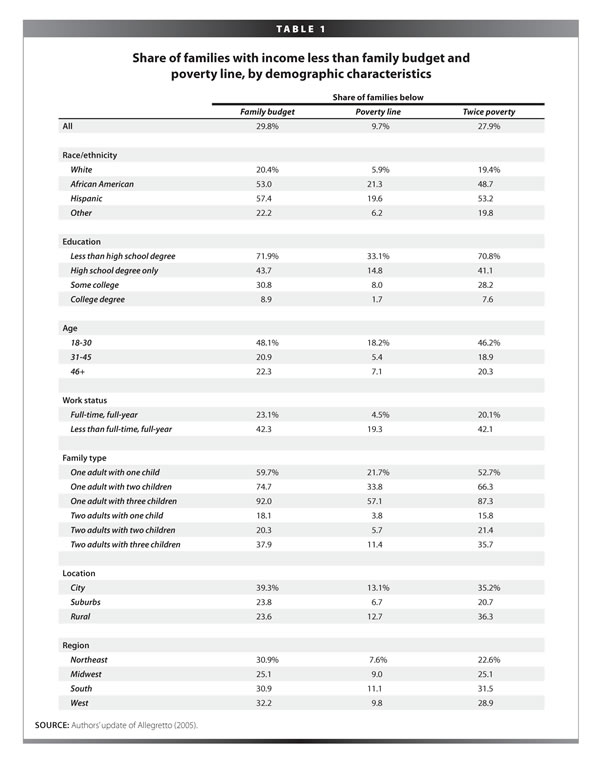
Single-parent families are particularly likely to have incomes below the family budgets, especially as the number of children increases. More than 90% of single-parent families with three children have incomes below the budgets, around the same share as below twice poverty. Adding a second parent lowers this statistic significantly: the share of families with two parents and three children with annual incomes under family budgets falls dramatically, to 37.9%.
The variation by region in the family budgets are driven by price differences, a factor the poverty measures fail to account for. Of these differences, housing tends to be the most important. Note, for example, that the share of families below the budgets in the Northeast is eight percentage points higher than the share below twice poverty. A smaller but similar difference exists for urban areas. Conversely, the fact that certain prices, such as housing, are generally lower in rural areas leads to lower rural shares falling below the family budgets compared to those falling below twice the poverty line.
Conclusion
Determining the extent of budget constraints faced by working families with children in today’s economy requires an income benchmark, a budget that reflects the costs of basic material needs. Family budgets provide this benchmark, and further examination yields the finding that about 30% of families fall below it. How should these findings be interpreted? They imply, of course, that many families lack the income to reliably and safely meet their basic needs. Do families with incomes below the budgets truly have difficulty making ends meet? What tradeoffs do they make? For example, the budgets assume a level of child care quality that is probably beyond that enjoyed by many low-income families. Is this an area in which low-income families “under-consume” from the perspective of family budgets?
Future research (which might, for example, map family budgets against data on expenditures from the Bureau of Labor Statistics Consumer Expenditure Survey) should investigate these implications.
—The authors would like to thank Sylvia Allegretto, Heidi Shierholz, Jin Dai, and Indivar Dutta-Gupta for their invaluable support.
Endnotes
1. EPI and others’ work on family budgets has tried to add to this branch of living standards research. See Johnson et al. (http://www.bls.gov/opub/mlr/2001/05/art3exc.htm) for a history. University of Washington Professor Diana Pearce is one of the modern pioneers of family budget work.
2. Typically, poverty measurement accomplishes this by deriving a base case and adjusting for different family types and sizes using an equivalence scale.
3. http://www.huduser.org/datasets/fmr/fmrs/index.asp?data=fmr08
4. See Bettina Aten’s path-breaking work in this area. See, for example, http://www.bea.gov/papers/pdf/InterareaPriceLevels.pdf.
5. This section uses the Current Population Survey’s March supplement to update Allegretto’s analysis of the share of families whose incomes are below family budgets. Published by the Census Bureau, the supplement includes detailed demographic and family income information as well as information on the demographic characteristics of respondents.
References
Allegretto, S. 2005. Basic Family Budgets: Working Families’ Incomes Often Fail to Meet Living Expenses Around the U.S. Briefing Paper No. 165. Washington, D.C.: Economic Policy Institute.
Bernstein, J. 2001. “Let the War on the Poverty Line Commence.” Working Paper Series. New York, N.Y.: Foundation for Child Development.
Boushey, H., C. Brocht, B. Gundersen, and J. Bernstein. 2001. Hardships in America: The Real Story of Working Families. Washington, D.C.: Economic Policy Institute.
Mishel, L., J. Bernstein, and S. Allegretto. 2007. The State of Working America 2006/2007. Ithaca, N.Y.: Cornell University Press.
National Academy of Sciences. 2007. “Alternative Poverty Estimates Based on National Academy of Sciences Recommendations, by Geographic and Inflationary Adjustments.” Washington, D.C.: NAS.
U.S. Department of Housing and Urban Development. 2008. “Final Fair Market Rents for Fiscal Year 2008 for the Housing Choice Voucher Program and Moderate Rehabilitation Single Room Occupancy Program.” Washington, D.C.: HUD.
This research was funded by the Annie E. Casey Foundation. We thank them for their support but acknowledge that the findings and conclusions presented in this report are those of the authors alone, and do not necessarily reflect the opinions of the Foundation.