There’s More to Economic Security than the Official Poverty Measure
Next week, the Census Bureau will release its estimates of the number of Americans who lived in poverty in 2014. The official poverty measure is an important metric—particularly since it’s been in place for nearly 50 years, and its measurement methodology hasn’t had major revisions over that time. As shown in the figure below, the share of Americans living at or below the official poverty line fell in the 1960s and stayed within a small range over the last four decades or so, generally rising in recessions and falling in expansions. Since 2000, the official poverty rate has seen a lot more up than down—the poverty rate at the end of the business cycle in 2007 was higher than at the beginning. 2013 was the first year the poverty rate turned the corner and saw some meaningful improvement since the start of the Great Recession. On Wednesday, September 16, we will see whether that progress has continued. While it would be great to see reductions in poverty over the last year, the fact is had economic growth over the last four decades been broadly shared, we could have made much more progress in reducing poverty, rather than just treading water.
Poverty rate, 1959–2013
| Actual poverty rate | |
|---|---|
| 1959-01-01 | 22.4% |
| 1960-01-01 | 22.2% |
| 1961-01-01 | 21.9% |
| 1962-01-01 | 21.0% |
| 1963-01-01 | 19.5% |
| 1964-01-01 | 19.0% |
| 1965-01-01 | 17.3% |
| 1966-01-01 | 14.7% |
| 1967-01-01 | 14.2% |
| 1968-01-01 | 12.8% |
| 1969-01-01 | 12.1% |
| 1970-01-01 | 12.6% |
| 1971-01-01 | 12.5% |
| 1972-01-01 | 11.9% |
| 1973-01-01 | 11.1% |
| 1974-01-01 | 11.2% |
| 1975-01-01 | 12.3% |
| 1976-01-01 | 11.8% |
| 1977-01-01 | 11.6% |
| 1978-01-01 | 11.4% |
| 1979-01-01 | 11.7% |
| 1980-01-01 | 13.0% |
| 1981-01-01 | 14.0% |
| 1982-01-01 | 15.0% |
| 1983-01-01 | 15.2% |
| 1984-01-01 | 14.4% |
| 1985-01-01 | 14.0% |
| 1986-01-01 | 13.6% |
| 1987-01-01 | 13.4% |
| 1988-01-01 | 13.0% |
| 1989-01-01 | 12.8% |
| 1990-01-01 | 13.5% |
| 1991-01-01 | 14.2% |
| 1992-01-01 | 14.8% |
| 1993-01-01 | 15.1% |
| 1994-01-01 | 14.5% |
| 1995-01-01 | 13.8% |
| 1996-01-01 | 13.7% |
| 1997-01-01 | 13.3% |
| 1998-01-01 | 12.7% |
| 1999-01-01 | 11.9% |
| 2000-01-01 | 11.3% |
| 2001-01-01 | 11.7% |
| 2002-01-01 | 12.1% |
| 2003-01-01 | 12.5% |
| 2004-01-01 | 12.7% |
| 2005-01-01 | 12.6% |
| 2006-01-01 | 12.3% |
| 2007-01-01 | 12.5% |
| 2008-01-01 | 13.2% |
| 2009-01-01 | 14.3% |
| 2010-01-01 | 15.1% |
| 2011-01-01 | 15.0% |
| 2012-01-01 | 15.0% |
| 2013-01-01 | 14.5% |

Source: EPI analysis of Current Population Survey Annual Social and Economic Supplement Historical Poverty Tables (Tables 2 and 4), Bureau of Economic Analysis National Income Product Accounts public data, and Danziger and Gottschalk (1995)
The poverty measure has an important function of historical significance, but it also has limitations. It shows how many people live in severe economic deprivation, but that’s not to say that people who live above the poverty line are doing well. In an admittedly oversimplified characterization, the official poverty threshold is a family-composition-adjusted basic food budget in 1963 multiplied by three, adjusted for inflation over time. The official poverty measure includes Social Security and unemployment insurance as a form of income, but misses some important government supports, like food stamps (SNAP) or the Earned Income Tax Credit. It fails to take into account the fact that the prices of some necessary items, like health care, have grown much faster than overall inflation. It fails to change the items in the basket of costs it measures, neglecting the cost of child care, which became increasingly important as women entered the labor force over the last 50 years. And, it fails to take into account for the vast differences in the cost of living across the country.
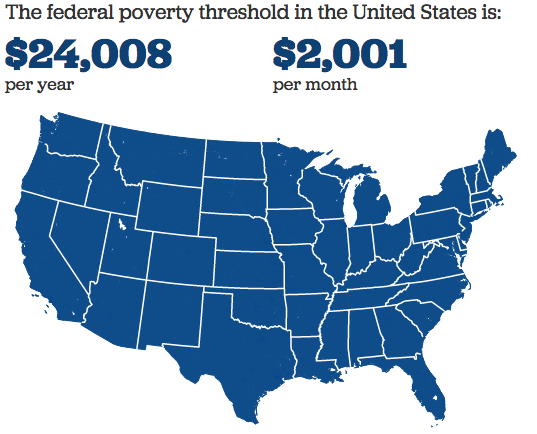
The map below shows the poverty threshold for a two-parent, two-child family in 2014—$24,008, everywhere throughout the country, despite the fact that it costs significantly more to live in New York City than it does in Tennessee.
The poverty threshold is not only insufficient at capturing differences in the cost-of-living across the country, but it is insufficient at measuring what it truly costs to get by. EPI’s Family Budget Calculator measures the income a family needs in order to attain a secure yet modest standard of living in 618 metropolitan and rural areas across the country. The budgets are calculated by estimating community-specific costs of housing, food, child care, transportation, health care, other necessities, and taxes. The budgets differ by location, since certain costs, such as housing, vary significantly depending on where one resides. Compared with the federal poverty line, EPI’s family budgets provide a more accurate and complete measure of economic security in America.
Annual income necessary to secure a modest yet adequate standard of living for a two-parent, two-child family, 2014
Notably, these budgets do not include several components of what might be considered part of a middle-class lifestyle. In particular, they do not include any savings: There are no savings for a rainy day (e.g., job loss or unexpected medical bills), savings for retirement (except through Social Security payments), or further investments in their children (e.g., enrichment activities or college savings). Thus, these are adequate but decidedly modest family budgets—they show what it takes to get by, but not to thrive. To show just how inadequate the poverty threshold is compared to the real cost of living, the map below subtracts the federal poverty threshold from the family budget for each area across the country.
The difference between the federal poverty line and the actual cost of living for a two-parent, two-child family
This map illustrates just how insufficient the poverty threshold is in measuring economic well-being. It takes an additional $25,106 to live in the cheapest budget area (Morristown, Tenn.) and another $82,485 above the poverty threshold to live in the most expensive (Washington, D.C.). In the median family budget area for this family type (Des Moines, Iowa) a two-parent, two-child family needs an additional $39,733 to make ends meet, above the poverty line.
Reducing poverty is a low bar for policy. It’s important to help those having the hardest time make ends meet, but it’s also important to raise our standards and find ways to increase economic security.
Enjoyed this post?
Sign up for EPI's newsletter so you never miss our research and insights on ways to make the economy work better for everyone.