The Bottom Line of this Jobs Report: The Fed Should Hold the Line and Let the Economy Continue to Recover
The official unemployment rate (the U3) is only one data point—one that doesn’t include workers who have left the labor force because of weak opportunities or workers who want to be working full-time but can only get part-time work. The fact is that the economy is still not adding jobs fast enough, and the recovery is not creating strong wage growth. The best advice is for the Federal Reserve to continue doing what they’re rightfully doing—keeping rates low to let the economy recovery. Many pundits have been quick to encourage the Federal Reserve to raise rates, but a close look at the data shows that the economy still needs time to grow.
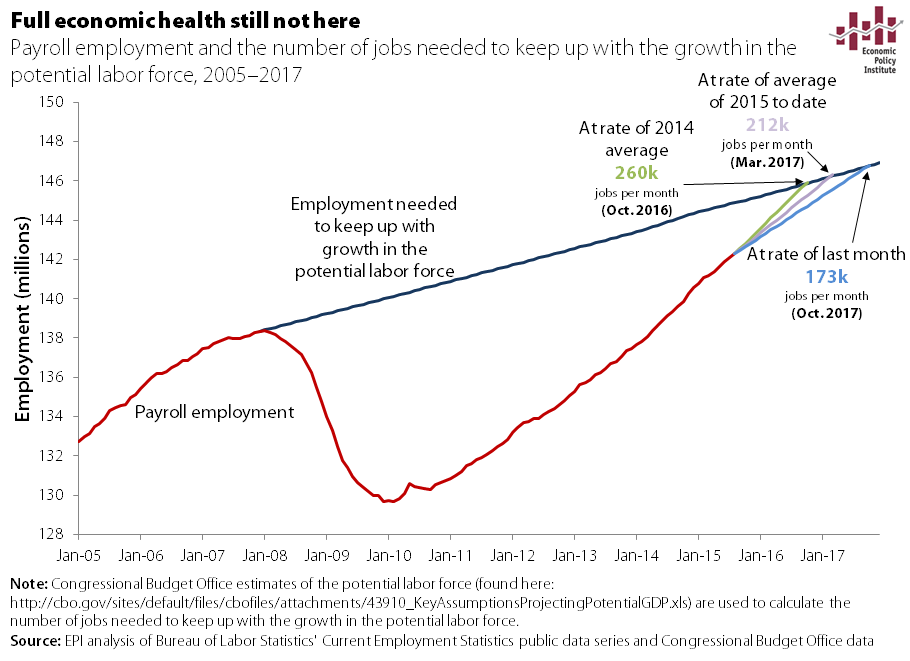
Nonfarm payroll employment rose by only 173,000 in August. While it’s best not to read too much into one month’s data, this brings average monthly job growth down to 212,000 so far in 2015. 2014 saw faster jobs growth: an average of 260,000. By that measure alone, we aren’t seeing an accelerating recovery. In fact, at this slower rate of growth, a full jobs recovery is still two years away.
A great example of just how slow this job recovery is going is the flat prime-age employment-to-population ratio (EPOP). This means the economy is only adding enough jobs to keep up with prime-age population growth—nothing more, nothing less. It means the economy is moving at a pace where we are not working off any of the joblessness that remains from the Great Recession. The prime-age EPOP in August (77.2 percent) is still below the lowest trough of the last two recessions (78.1 percent). We have a long way to go before this data point says recovery.
Employment-to-population ratio of workers ages 25-54, 2006-2015
| Month | Employment-to-population ratio |
|---|---|
| 2006-01-01 | 79.6% |
| 2006-02-01 | 79.7% |
| 2006-03-01 | 79.8% |
| 2006-04-01 | 79.6% |
| 2006-05-01 | 79.7% |
| 2006-06-01 | 79.8% |
| 2006-07-01 | 79.8% |
| 2006-08-01 | 79.8% |
| 2006-09-01 | 79.9% |
| 2006-10-01 | 80.1% |
| 2006-11-01 | 80.0% |
| 2006-12-01 | 80.1% |
| 2007-01-01 | 80.3% |
| 2007-02-01 | 80.1% |
| 2007-03-01 | 80.2% |
| 2007-04-01 | 80.0% |
| 2007-05-01 | 80.0% |
| 2007-06-01 | 79.9% |
| 2007-07-01 | 79.8% |
| 2007-08-01 | 79.8% |
| 2007-09-01 | 79.7% |
| 2007-10-01 | 79.6% |
| 2007-11-01 | 79.7% |
| 2007-12-01 | 79.7% |
| 2008-01-01 | 80.0% |
| 2008-02-01 | 79.9% |
| 2008-03-01 | 79.8% |
| 2008-04-01 | 79.6% |
| 2008-05-01 | 79.5% |
| 2008-06-01 | 79.4% |
| 2008-07-01 | 79.2% |
| 2008-08-01 | 78.8% |
| 2008-09-01 | 78.8% |
| 2008-10-01 | 78.4% |
| 2008-11-01 | 78.1% |
| 2008-12-01 | 77.6% |
| 2009-01-01 | 77.0% |
| 2009-02-01 | 76.7% |
| 2009-03-01 | 76.2% |
| 2009-04-01 | 76.2% |
| 2009-05-01 | 75.9% |
| 2009-06-01 | 75.9% |
| 2009-07-01 | 75.8% |
| 2009-08-01 | 75.6% |
| 2009-09-01 | 75.1% |
| 2009-10-01 | 75.0% |
| 2009-11-01 | 75.2% |
| 2009-12-01 | 74.8% |
| 2010-01-01 | 75.1% |
| 2010-02-01 | 75.1% |
| 2010-03-01 | 75.1% |
| 2010-04-01 | 75.4% |
| 2010-05-01 | 75.1% |
| 2010-06-01 | 75.2% |
| 2010-07-01 | 75.1% |
| 2010-08-01 | 75.0% |
| 2010-09-01 | 75.1% |
| 2010-10-01 | 75.0% |
| 2010-11-01 | 74.8% |
| 2010-12-01 | 75.0% |
| 2011-01-01 | 75.2% |
| 2011-02-01 | 75.1% |
| 2011-03-01 | 75.3% |
| 2011-04-01 | 75.1% |
| 2011-05-01 | 75.2% |
| 2011-06-01 | 75.0% |
| 2011-07-01 | 75.0% |
| 2011-08-01 | 75.1% |
| 2011-09-01 | 74.9% |
| 2011-10-01 | 74.9% |
| 2011-11-01 | 75.3% |
| 2011-12-01 | 75.4% |
| 2012-01-01 | 75.6% |
| 2012-02-01 | 75.6% |
| 2012-03-01 | 75.7% |
| 2012-04-01 | 75.7% |
| 2012-05-01 | 75.7% |
| 2012-06-01 | 75.7% |
| 2012-07-01 | 75.6% |
| 2012-08-01 | 75.7% |
| 2012-09-01 | 75.9% |
| 2012-10-01 | 76.0% |
| 2012-11-01 | 75.8% |
| 2012-12-01 | 75.9% |
| 2013-01-01 | 75.7% |
| 2013-02-01 | 75.9% |
| 2013-03-01 | 75.9% |
| 2013-04-01 | 75.9% |
| 2013-05-01 | 76.0% |
| 2013-06-01 | 75.9% |
| 2013-07-01 | 76.0% |
| 2013-08-01 | 75.9% |
| 2013-09-01 | 75.9% |
| 2013-10-01 | 75.5% |
| 2013-11-01 | 76.0% |
| 2013-12-01 | 76.1% |
| 2014-01-01 | 76.5% |
| 2014-02-01 | 76.5% |
| 2014-03-01 | 76.6% |
| 2014-04-01 | 76.5% |
| 2014-05-01 | 76.4% |
| 2014-06-01 | 76.8% |
| 2014-07-01 | 76.6% |
| 2014-08-01 | 76.8% |
| 2014-09-01 | 76.8% |
| 2014-10-01 | 76.9% |
| 2014-11-01 | 76.9% |
| 2014-12-01 | 77.0% |
| 2015-01-01 | 77.2% |
| 2015-02-01 | 77.3% |
| 2015-03-01 | 77.2% |
| 2015-04-01 | 77.2% |
| 2015-05-01 | 77.2% |
| 2015-06-01 | 77.2% |
| 2015-07-01 | 77.1% |

Source: EPI analysis of Bureau of Labor Statistics' Current Population Survey public data
Arguably, the most important measure for the Federal Reserve as they decide whether to raise rates in September is nominal average hourly earnings. Over the year, average hourly earnings rose only 2.2 percent, in line with the same slow growth we’ve seen for the last six years. And wages for production/nonsupervisory workers rose even more slowly, at 1.9 percent over the year. The annual growth rates are slow by any measure, but are certainly far below any reasonable wage target.
Nominal wage growth has been far below target in the recovery: Year-over-year change in private-sector nominal average hourly earnings, 2007-2016
| All nonfarm employees | Production/nonsupervisory workers | |
|---|---|---|
| Mar-2007 | 3.59% | 4.11% |
| Apr-2007 | 3.27% | 3.85% |
| May-2007 | 3.73% | 4.14% |
| Jun-2007 | 3.81% | 4.13% |
| Jul-2007 | 3.45% | 4.05% |
| Aug-2007 | 3.49% | 4.04% |
| Sep-2007 | 3.28% | 4.15% |
| Oct-2007 | 3.28% | 3.78% |
| Nov-2007 | 3.27% | 3.89% |
| Dec-2007 | 3.16% | 3.81% |
| Jan-2008 | 3.11% | 3.86% |
| Feb-2008 | 3.09% | 3.73% |
| Mar-2008 | 3.08% | 3.77% |
| Apr-2008 | 2.88% | 3.70% |
| May-2008 | 3.02% | 3.69% |
| Jun-2008 | 2.67% | 3.62% |
| Jul-2008 | 3.00% | 3.72% |
| Aug-2008 | 3.33% | 3.83% |
| Sep-2008 | 3.23% | 3.64% |
| Oct-2008 | 3.32% | 3.92% |
| Nov-2008 | 3.64% | 3.85% |
| Dec-2008 | 3.58% | 3.84% |
| Jan-2009 | 3.58% | 3.72% |
| Feb-2009 | 3.24% | 3.65% |
| Mar-2009 | 3.13% | 3.53% |
| Apr-2009 | 3.22% | 3.29% |
| May-2009 | 2.84% | 3.06% |
| Jun-2009 | 2.78% | 2.94% |
| Jul-2009 | 2.59% | 2.71% |
| Aug-2009 | 2.39% | 2.64% |
| Sep-2009 | 2.34% | 2.75% |
| Oct-2009 | 2.34% | 2.63% |
| Nov-2009 | 2.05% | 2.67% |
| Dec-2009 | 1.82% | 2.50% |
| Jan-2010 | 1.95% | 2.61% |
| Feb-2010 | 2.00% | 2.49% |
| Mar-2010 | 1.77% | 2.27% |
| Apr-2010 | 1.81% | 2.43% |
| May-2010 | 1.94% | 2.59% |
| Jun-2010 | 1.71% | 2.53% |
| Jul-2010 | 1.85% | 2.47% |
| Aug-2010 | 1.75% | 2.41% |
| Sep-2010 | 1.84% | 2.30% |
| Oct-2010 | 1.88% | 2.51% |
| Nov-2010 | 1.65% | 2.23% |
| Dec-2010 | 1.74% | 2.07% |
| Jan-2011 | 1.92% | 2.17% |
| Feb-2011 | 1.87% | 2.12% |
| Mar-2011 | 1.87% | 2.06% |
| Apr-2011 | 1.91% | 2.11% |
| May-2011 | 2.00% | 2.16% |
| Jun-2011 | 2.13% | 2.00% |
| Jul-2011 | 2.26% | 2.31% |
| Aug-2011 | 1.90% | 1.99% |
| Sep-2011 | 1.94% | 1.93% |
| Oct-2011 | 2.11% | 1.77% |
| Nov-2011 | 2.02% | 1.77% |
| Dec-2011 | 1.98% | 1.77% |
| Jan-2012 | 1.75% | 1.40% |
| Feb-2012 | 1.88% | 1.45% |
| Mar-2012 | 2.10% | 1.76% |
| Apr-2012 | 2.01% | 1.76% |
| May-2012 | 1.83% | 1.39% |
| Jun-2012 | 1.95% | 1.54% |
| Jul-2012 | 1.77% | 1.33% |
| Aug-2012 | 1.82% | 1.33% |
| Sep-2012 | 1.99% | 1.44% |
| Oct-2012 | 1.51% | 1.28% |
| Nov-2012 | 1.90% | 1.43% |
| Dec-2012 | 2.20% | 1.74% |
| Jan-2013 | 2.15% | 1.89% |
| Feb-2013 | 2.10% | 2.04% |
| Mar-2013 | 1.93% | 1.88% |
| Apr-2013 | 2.01% | 1.73% |
| May-2013 | 2.01% | 1.88% |
| Jun-2013 | 2.13% | 2.03% |
| Jul-2013 | 1.91% | 1.92% |
| Aug-2013 | 2.26% | 2.18% |
| Sep-2013 | 2.04% | 2.17% |
| Oct-2013 | 2.25% | 2.27% |
| Nov-2013 | 2.24% | 2.32% |
| Dec-2013 | 1.90% | 2.16% |
| Jan-2014 | 1.94% | 2.31% |
| Feb-2014 | 2.14% | 2.45% |
| Mar-2014 | 2.18% | 2.40% |
| Apr-2014 | 1.97% | 2.40% |
| May-2014 | 2.13% | 2.44% |
| Jun-2014 | 2.04% | 2.34% |
| Jul-2014 | 2.09% | 2.43% |
| Aug-2014 | 2.21% | 2.48% |
| Sep-2014 | 2.04% | 2.27% |
| Oct-2014 | 2.03% | 2.27% |
| Nov-2014 | 2.11% | 2.26% |
| Dec-2014 | 1.82% | 1.87% |
| Jan-2015 | 2.23% | 2.01% |
| Feb-2015 | 2.06% | 1.71% |
| Mar-2015 | 2.18% | 1.90% |
| Apr-2015 | 2.34% | 2.00% |
| May-2015 | 2.34% | 2.14% |
| Jun-2015 | 2.04% | 1.99% |
| Jul-2015 | 2.29% | 2.04% |
| Aug-2015 | 2.32% | 2.08% |
| Sep-2015 | 2.40% | 2.13% |
| Oct-2015 | 2.52% | 2.36% |
| Nov-2015 | 2.39% | 2.21% |
| Dec-2015 | 2.60% | 2.61% |
| Jan-2016 | 2.50% | 2.50% |
| Feb-2016 | 2.38% | 2.50% |
| Mar-2016 | 2.33% | 2.44% |
| Apr-2016 | 2.49% | 2.53% |
| May-2016 | 2.48% | 2.33% |
| Jun-2016 | 2.64% | 2.48% |
| Jul-2016 | 2.72% | 2.57% |
| Aug-2016 | 2.43% | 2.46% |
| Sep-2016 | 2.59% | 2.65% |
*Nominal wage growth consistent with the Federal Reserve Board's 2 percent inflation target, 1.5 percent productivity growth, and a stable labor share of income.
Source: EPI analysis of Bureau of Labor Statistics Current Employment Statistics public data series
Wage growth needs to be stronger—and consistently strong for a solid spell—before we can call this a healthy economy. As shown below, nominal wage growth since the recovery officially began in mid-2009 has been low and flat. This isn’t surprising—the weak labor market of the last seven years has put enormous downward pressure on wages. Employers don’t have to offer big wage increases to get and keep the workers they need. And this remains true even as a jobs recovery has consistently forged ahead in recent years.
Pressure is building on the Fed to reverse its monetary stimulus by raising short-term interest rates, slowing the recovery in the name of stopping wage-fueled inflation. Yes, interest rates have been low for a long time, but there’s no reason for the Fed to be impatient. Today’s jobs report shows little sign of the “some further improvement” Fed officials have said they are waiting for. A clear-eyed look at the entire economic picture provides clear evidence that the Fed should continue to hold the line, and let the economy continue to recovery before raising rates prematurely.
Enjoyed this post?
Sign up for EPI's newsletter so you never miss our research and insights on ways to make the economy work better for everyone.