A weekly presentation of downloadable charts and short analyses designed to graphically illustrate important economic issues. Updated every Wednesday.
Snapshot for October 24, 2001.
Comparing recessionary trends
Data on economic activity for July and August indicate that the economy was already on a downward slope prior to September 11. Overall economic activity continued to slump, far outweighing the declines in economic activity seen during the last recession in 1990 and 1991.
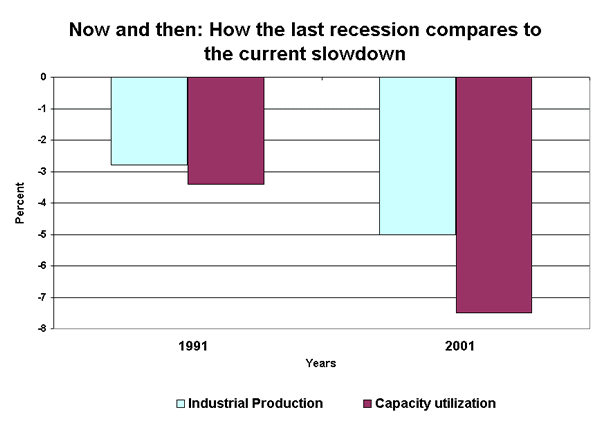
Total industrial product, which indicates the overall strength of the U.S. economy, fell in August for the eleventh month in a row, representing a 5% decline in industrial production since its peak in September 2000. During the last recession, industrial production declined by 2.4% from its peak in November 1999 to its trough in March 2001. In other words, industrial production fell more than twice as much since the recent slowdown began than it did during the last recession (see figure below).

Similarly, capacity utilization, which measures how hard industries have to work to keep up with consumer demand, continued to decline through August. The total decline in capacity utilization since its peak in June 2000 amounted to 8%. From September last year, when signs of weakness also emerged in other indicators, capacity utilization fell by 7.5%. During the last recession, capacity utilization fell by only 6.3% from its peak in March 1990 to its trough in March 1991, and by 3.4% from November 1990, when industrial production peaked, to March 1991 (see figure). In other words, depending what time frame is used, capacity utilization fell either one fourth more or more than twice as much as during the last recession. This is also reflected in the fact that following the declines in July and August, capacity utilization fell to its lowest level since October 1982.
Finally, the housing sector, which so far remained the only sector resilient to the economic slowdown, showed clear signs of weakness in August. New housing starts declined by 6.9% in August. New permits issued declined by 1.8% in July and by 0.7% in August, suggesting that, in the near future, housing construction will likely continue to decline.
So far, we have relied on monetary policy to get the economy growing again. While the Federal Reserve cut short-term interest rates, long-term interest rates remained stable. In a situation characterized by low consumer confidence and rising unemployment, providing businesses with cheap money is like pushing on a string. Only a fiscal stimulus can provide the impetus for faster growth that the economy needs. To stave off a sharp and prolonged recession, the government needs to increase its spending substantially. At a minimum, government spending should be sufficient to help stop increasing unemployment in the medium term. Since consumers and businesses are unlikely to increase their expenditures any time soon, additional government expenditures should amount to a little over $200 billion in the next 12 months.
This week’s Snapshot by EPI economist Christian Weller.
Check out the archive for past Economic Snapshots.
