Snapshot for October 29, 2008.
American consumers shopped but have now dropped
Bad signs for tomorrow’s GDP report
by L. Josh Bivens
For two years, consumer spending has managed to grow even in the face of trillions of dollars of evaporating housing wealth. As consumption spending is 70% of total U.S. gross domestic product (GDP), this resilience kept the overall economy from shrinking. Two recent government reports indicate that the U.S. consumer has finally surrendered, and this augurs badly for tomorrow’s Commerce Department report on third-quarter GDP growth.
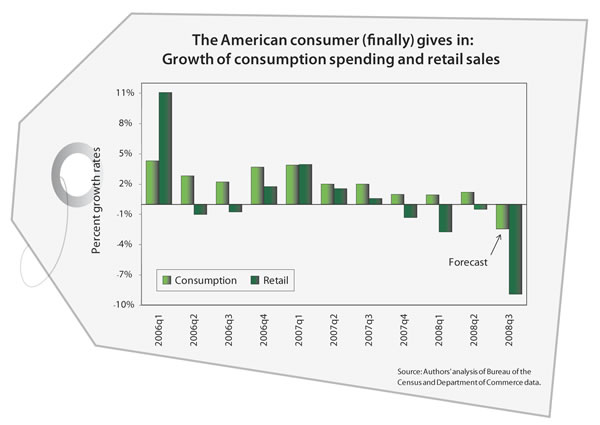
At the end of September, the Commerce Department reported no pickup in overall consumer spending in August, following a huge decline in July. A rough forecast based on these two months tells an ugly story: consumer spending probably fell by about 2.5% in the third quarter (see chart). If this happened, it will be the largest decline since 1990.1

Two weeks ago, the Census Bureau reported a large decline in retail sales for September, continuing a downturn that has now lasted an entire year. Retail sales are essentially a subset of overall consumption spending (and are the subset that fluctuate the most, falling more quickly than overall consumption in bad economic times). For the third quarter, inflation-adjusted retail sales fell more than 9%, the largest fall since the Census Bureau began tracking them consistently over time.2
The bursting of the housing bubble has forced what seemed impossible for so long—outright cutbacks from U.S. consumers. The result of these cutbacks will throw the entire U.S. economy into reverse in coming quarters, and the first sign of this will be tomorrow’s GDP report.
Notes
1. The September number for overall consumption spending will be released tomorrow. Using the “two-month method” employed here tends to give very accurate results for the overall quarter.
2. Retail sales are deflated using the overall personal consumption expenditures price index. The September value for this index is not yet available, so September prices were assumed to be unchanged from August—a conservative estimate. Further, the 9% decline is the quarter’s decline expressed as an annualized rate; this makes it comparable to the overall consumption figures reported above and the overall GDP numbers that will be reported tomorrow. 1992 is the first year that detailed time-series data on retail sales are kept.
