See Snapshots archive.
Snapshot for June 18, 2008.
Surging wage growth for topmost sliver
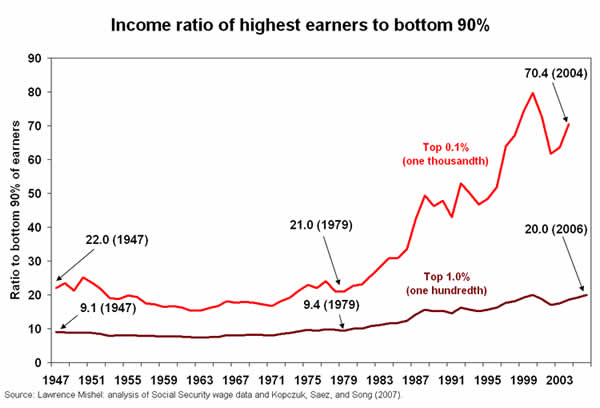
Inequality in the United States continues to worsen. Huge gains at the top of the income scale have been fueled by, among other things, a surging inequality in wages (illustrated in the chart below). The ratio of the wage income of the top 1% of earners to that of the bottom 90% more than doubled between 1979 and 2006, increasing from a ratio of 9.4-to-1 to 19.9-to-1. In contrast there was relatively little change in the earnings disparity from 1947 to 1979, when wages at all levels of the economy grew apace.
But when it comes to the wage income of the highest of the high earners, the staggering gap has become a chasm: in 2004 the upper one-tenth of 1% earned 70.4 times as much as the average person in the bottom 90% of the income scale. Just 25 years earlier in 1979, the ratio that was only 21.0-to-1. In other words, in 1979 it took the highest-paid earners 12.4 days to make what most other earners did in a year, but by 2004 that feat was accomplished in a mere 3.7days.

