See Snapshots Archive.
This Snapshot is part of a series; see also part 1, part 3 and part 4 of the series, or print the entire series.
Snapshot for May 4, 2006.
Critiquing misleading White House statements about the economy, part 2
International comparisons of employment growth
A recent White House news release contains this claim regarding employment growth:
Since August 2003, we have added more than 5.1 million new jobs—more than Japan and the European Union combined.
(http://www.whitehouse.gov/news/releases/2006/04/20060411-9.html)
International comparisons of employment growth are tricky—employment growth is very sensitive to the timing of different countries’ business cycles. In this case, the White House begins its comparison at the exact point when employment began to rise in the latest recovery, so as to avoid counting the longest jobless recovery on record.
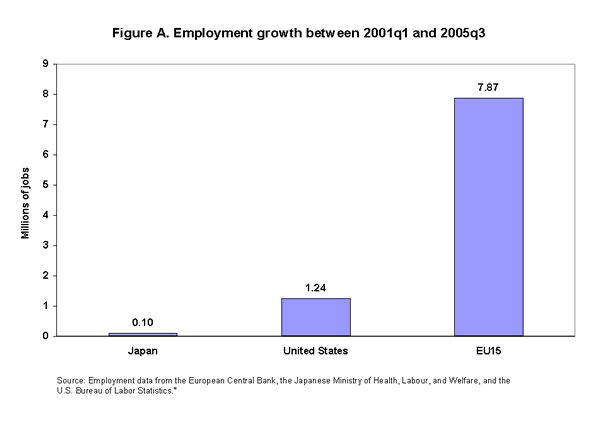
Counting over the full course of the Bush Administration, which also corresponds (for the United States) to the standard that one should measure employment growth from the previous business cycle peak (the first quarter of 2001), the most recent comparable data (the third quarter of 2005) shows that the United States added 1.2 million jobs compared to 7.9 million for the EU15 (the group of 15 European nations referenced by the Bush Administration in their release) and a gain of just under 100,000 for Japan over this time period (see Figure A).

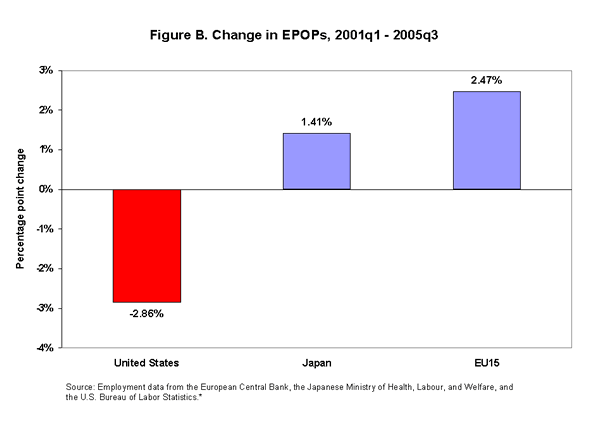
The White House result is due to “cherry-picking” the date when they start counting jobs, reinforcing the fact that international employment growth comparisons should be approached with some caution. More importantly, the United States should create more jobs than the EU15 or Japan because its working-age population is growing faster. Over the same time period, the working-age population grew by over 9 million in the United States compared to a rise of only 3 million for the Euro Area and a decline of over 1 million in Japan. The net effect of this differential employment and population growth is shown in Figure B, which shows the change in the employment to population ratio (or epop) for each of these areas. The employment to population ratio shows the share of the working-age population that is currently employed and is a key labor market indicator tracked by economists to measure labor market vitality.

From 2001q1 to 2005q3, epops in both the EU15 and Japan have risen, while the U.S. epop has fallen. In short, in terms of creating enough jobs to keep pace with growth in the working-age population, the United States actually lags both the EU15 and Japan since the beginning of 2001.
Coming Next: EPI critiques claims about international comparisons of economic growth.
* Note: Working-age population statistics are calculated using data from the Organisation of Economic Co-operation and Development, using 2001 levels and applying 2001-03 growth rates over the full period. The resulting epops are the author’s calculations from these data. Due to lack of data, Belgium is not included in the EU15 numbers.
This Snapshot was written by EPI Economist L. Josh Bivens.
This Snapshot is part of a series; see also part 1, part 3 and part 4 of the series, or print the entire series.
