August 29, 2006
Working families fall behind
Although income improves for the first time in the current recovery, poverty remains unchanged and inequality rose in 2005
by Jared Bernstein and Elise Gould
After falling each year since the economic recovery began in 2001, the income of the median household grew 1.1% (or $509) in inflation-adjusted terms last year. Poverty rates, which have risen consistently over the recovery, were unchanged, according to today’s release from the Census Bureau. Income inequality also rose in 2005, as households at the top of the income scale saw greater income growth than everyone else.
However, the median income of working-age households—those headed by someone less than 65—fell 0.5% last year, as has been the case consistently since 2000. In addition, today’s report reveals that the median earnings of both men and women fell significantly in 2005, by 1.8% for men and 1.3% for women. Together, these facts suggest that working families fell behind in 2005.
In fact, the only households with significant gains in 2005 were those headed by someone 65 or older, whose median income was up sharply by 2.8%. It will take more analysis to evaluate the source of this growth, but given the negative earnings outcomes, it is likely their gains came from non-labor income, including Social Security (a benefit that is automatically indexed to inflation).
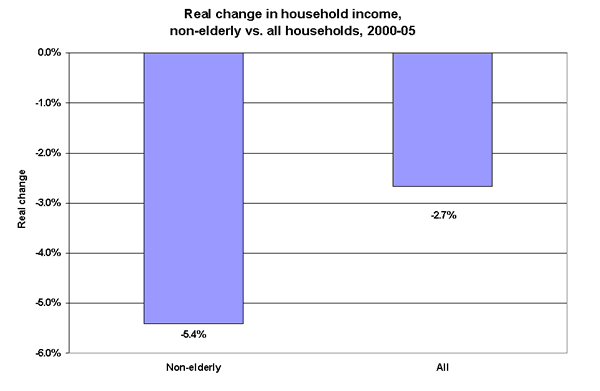
A longer-term view confirms the extent to which non-elderly families have fallen behind in recent years. Between 2000 and 2005, the real median income of households headed by someone under 65 is down 5.4%, twice that of the overall household median, which is down 2.7% over the past five years.

Thus, despite the positive overall median income growth of 1.1%, other evidence in today’s report suggests that this recovery is still leaving working families behind.
Two important concepts for understanding today’s Census data and the economic fortunes of Americans are the median household income and the poverty rate. The median household is the one right in the middle of the income scale: half of all households have higher incomes and half have lower. The poverty rate measures the share of persons in households with incomes below a minimum threshold, adjusted for family size. In 2005, the threshold for a four-person family was $19,971.
Last year’s gain in median household income is the first since 1999, and as such is a welcome reversal in trend. But it has come late in an economic recovery that is already losing steam. As noted, median income is still 2.7% below its level in 2000 (the last economic peak), a loss of about $1,280 to the typical household (in 2005 dollars).
Yet the economy has expanded considerably over these years. Gross domestic product (GDP), the broadest measure of economic growth, is up 12.5% from 2000 to 2005; productivity, or output per hour, is up 16.6% in that period. This latter measure is particularly important because it is widely considered to be a key determinant of living standards. Yet the income of the median household is still below its 2000 level, and the poverty rate, at 12.6%, remains well above its 11.3% level in that peak year.
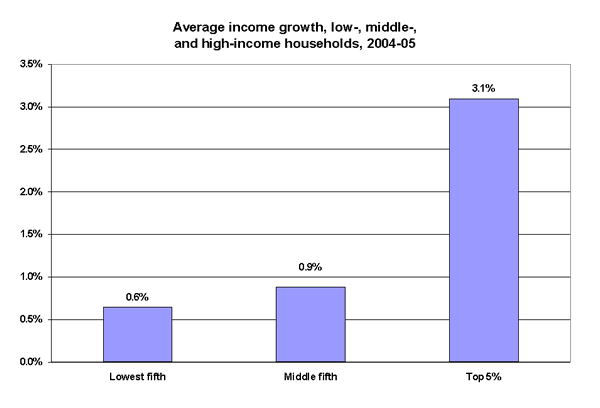
This pattern of faster overall growth amid worse economic outcomes for median households and working persons implies growing inequality, as those at the top of the scale claim a disproportionate share of the growth. This increase in inequality can be seen in the figure below, which plots the average income growth among low-, middle-, and high-income families over the past year. The staircase pattern, associated with higher inequality, is clearly evident. Over the longer term, today’s Census Bureau data reveals that the share of all national income accruing to the richest fifth of households—50.4%—is the highest share on record going back to 1967. The middle fifth—receiving 14.6% of total income—and the bottom fifth—receiving just 3.4%—are tied with recent years for the lowest shares on record.

As for health insurance coverage, the overall number of Americans without health insurance increased for the fifth year in a row. Up nearly seven million since 2000, to 46.6 million in 2005, the share of uninsured Americans has increased from 14.2% to 15.9%.
In another example of the difficulties facing working Americans, the greatest declines in health insurance coverage occurred in employment-based insurance, which has dropped every year since 2000. In 2000, 63.6% of the population had employment-based coverage. By 2005, this rate had dropped to 59.5%.
There was a significant increase in the number of uninsured workers between 2004 and 2005. In 2005, 18.7% of all workers were uninsured. Most strikingly, however, is the fact that full-time workers experienced lower rates of coverage in 2005, while part-time workers did not. There were nearly one million more uninsured full-time workers in 2005 than in 2004, with a significant increase of 2 percentage points in the share of uninsured workers since 2000.
In other words, the economic growth of the last few years has largely bypassed middle- and low-income families, and especially working families. Other data sources, such as the national income accounts, reveal historically high growth rates of “non-labor income” such as corporate profits, suggesting growth has been eluding wage earners and flowing up the income scale to those with high levels of assets. Today’s data corroborate this dynamic, showing that the gains that did occur tended to show up among higher income households, and not among those who depend on their paychecks to get ahead.
Note: This report deals exclusively with income and poverty data from the Current Population Survey (CPS). The Census Bureau also released data today from the American Community Survey. According to Census guidelines, the CPS data are preferable for evaluating national trends; the Census recommends the use of ACS data for state-level analysis.
To view archived editions of INCOME PICTURE, click here.
The Economic Policy Institute INCOME PICTURE is published upon the annual release of family income data from the Census Bureau.
EPI offers same-day analysis of income, price, employment, and other economic data released by U.S. government agencies. For more information, contact EPI at 202-775-8810.
