Key takeaways:
- The federal minimum wage is at its lowest real value in 77 years. Frozen at $7.25 since 2009, the federal minimum wage has lost 30% of its purchasing power during this 17-year freeze.
- Setting the federal minimum wage at two-thirds of the national median wage would raise pay for 39.6 million workers in 2030, about 1 in 4 of the wage-earning workforce.
- The policy would move the federal floor meaningfully toward one definition of a living wage, meeting EPI’s Family Budget Calculator thresholds in half of U.S. counties for a single adult working full time. But it falls short for many families, meaning that policies to strengthen unionization, provide a more robust safety net, and keep unemployment low remain essential.
- Decades of economic research support this two-thirds benchmark, finding little to no employment loss from ambitious minimum wage increases.
- Indexing the federal minimum wage to median wage growth would lock in these gains. Median wages typically outpace prices, so median wage indexing would prevent the kind of decades-long slide that has eroded the current floor.
Introduction
The federal minimum wage, frozen at $7.25 since 2009, is now at its lowest real value in 77 years and a major driver of the affordability crisis facing low-wage workers. For over a decade, the senior Democrats on the House and Senate’s labor committees have consistently introduced and championed the Raise the Wage Act, which would significantly raise the federal level (most recently, to $17 an hour in 2030) and index it to median wage growth going forward. But Congress as a whole has failed to take action on the legislation. In the absence of federal movement, states have moved on their own: Thanks in large part to the Fight for $15 campaign, 21 states and the District of Columbia, home to half of all U.S. wage earners, will have a minimum wage of at least $15 by 2028. But that patchwork still leaves 20 states—home to about 55 million workers—at $7.25, and updating the federal floor to a modern benchmark is the only way to reach these workers.
Raising the federal minimum wage to two-thirds of the national median wage would lift pay for nearly 40 million workers, about a quarter of the workforce. Two-thirds of the median—equivalent to roughly $17.70 today, a projected $20 in 2030, and a projected $25 in 2038—matches the benchmarks used in other high-income countries and tracks the direction of recent minimum wage research. Indexing to median wage growth thereafter would keep the floor from losing ground to inflation or falling behind the broader economy.
A federal minimum at two-thirds of the national median would eliminate poverty wages and move the floor meaningfully toward a living wage in much of the country: A single adult working full time could cover modest expenses in half of U.S. counties under EPI’s Family Budget Calculator thresholds. Maintaining the two-thirds minimum-to-median ratio would lock in those gains, improving affordability for U.S. workers and their families. It would also durably narrow the gap between low-wage workers and the typical worker, with Black workers and women seeing the largest benefits.
The two-thirds benchmark is also well-supported by economic research. Decades of studies of state and federal minimum wages find that higher floors raise pay for low-wage workers with little to no effect on employment, and a smaller but growing body of work on minimum wages approaching two-thirds of the median reaches the same conclusion. Setting the federal floor at two-thirds of the median, and updating it annually, would raise incomes at the bottom and prevent the kind of decades-long slide that has left the current minimum at its lowest real value in 77 years.
The outdated federal minimum wage and extent of low pay
The federal minimum wage is now at its lowest real value in 77 years. Stuck at $7.25 since 2009, it is in its longest stretch without an increase since the federal wage floor was established in 1938 (Figure A). Inflation has eroded 30% of its purchasing power over those 17 years, gradually cutting real pay for the lowest-wage workers in states still tied to the federal floor. Simply indexing the 2009 wage to inflation, a far weaker standard than this report proposes, would put the federal minimum at about $10.60 today.
FIGURE A
FIGURE A
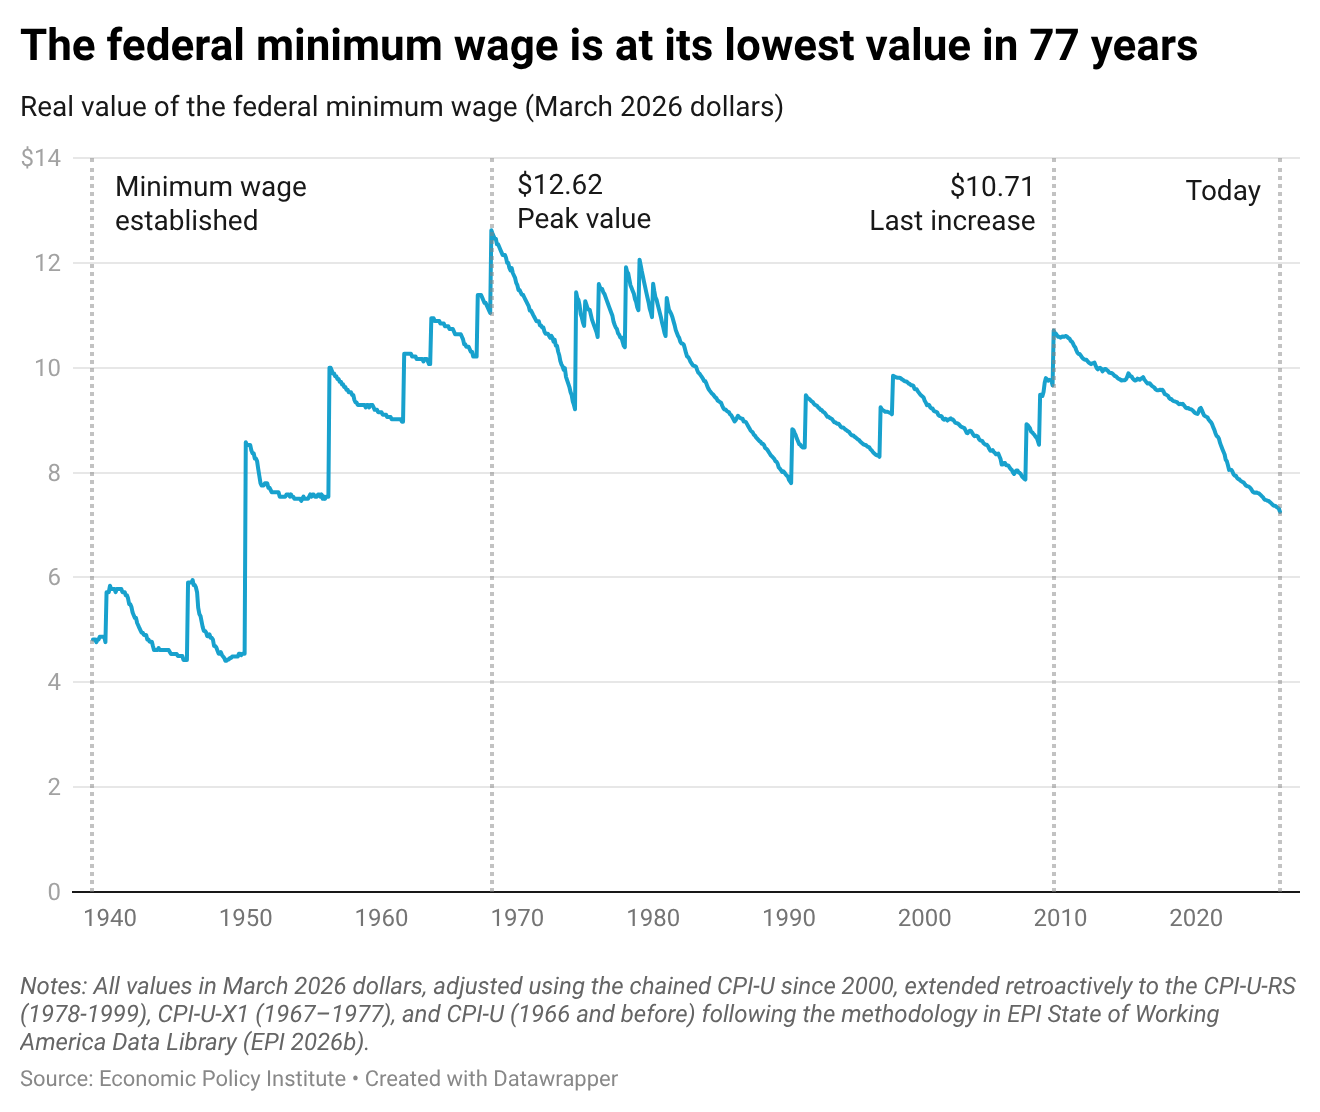
The minimum wage was once meaningfully higher in real terms. Civil rights organizers in the late 1960s pressed Congress not only to raise the wage floor but also to extend its coverage to service industries that had previously been excluded because they disproportionately employed Black workers. By 1968, the federal minimum wage reached $1.60 per hour, equivalent to $12.62 in 2026 dollars and roughly 61% of the national median wage at the time, close to the two-thirds benchmark this report proposes. Even a federal minimum wage of $12.62 today would raise the wages of about 12 million workers.
Because Congress has not raised the federal floor in 17 years, states and localities have moved on their own. Thirty states, the District of Columbia, and dozens of cities and counties have raised their minimum wages, many in response to the Fight for $15 campaign (EPI 2026a). By the end of 2028, more than half of the U.S. workforce, about 74 million workers, will live in a state with a minimum wage of at least $15.
The state-by-state patchwork has delivered real successes but also left tens of millions of workers behind. Roughly 55 million people work in the 20 states still tied to the $7.25 federal floor, and they are nearly twice as likely as workers elsewhere to earn less than $15 per hour. Nationally, almost no one is paid exactly $7.25 anymore: The floor is so low it rarely binds. Yet 14 million workers, about 9% of the workforce, still earn less than $15. Closing that gap and preventing the federal floor from eroding further requires a national standard pegged to a modern benchmark.
A new standard: Two-thirds of the median wage
The federal minimum wage suffers from two related deficiencies: Its level is too low, and it does not adjust as the economy grows. Both can be solved by tying the federal minimum to two-thirds of the national median wage. Congress would first raise the floor to that level, and each subsequent year the minimum would adjust to maintain the same ratio.
First, the new benchmark replaces a poverty-level federal floor (Hickey and Cid-Martinez 2025) with one that pushes the minimum wage toward a living wage. As Oakford (2026) argues, two-thirds of the median is “a realistic stepping stone to living wages,” and standards below that ratio leave too large a gap between earnings and the cost of necessary expenses. A federal minimum at two-thirds of the median also better fulfills the original promise of the federal standard, which Congress described in 1937 as protecting “this Nation from the evils and dangers resulting from wages too low to buy the bare necessities of life” (U.S. Congress 1937).
Second, maintaining the two-thirds ratio guarantees automatic increases as the economy grows, ending the recurring erosion that comes from a frozen federal floor. Because median wages typically outpace prices, median wage indexing produces real gains, not just inflation protection. In 2025, two-thirds of the national median wage was $17.11 per hour (Figure B), and today, it is estimated to be $17.70. By 2030, applying Congressional Budget Office (2026) Employment Cost Index projections, it would reach $20.02. A federal minimum tied to two-thirds of the median would likely reach or exceed $25 by 2038, four years sooner than if a $17.11 wage in 2025 had been indexed only to the cost of living going forward.1
FIGURE B
FIGURE B
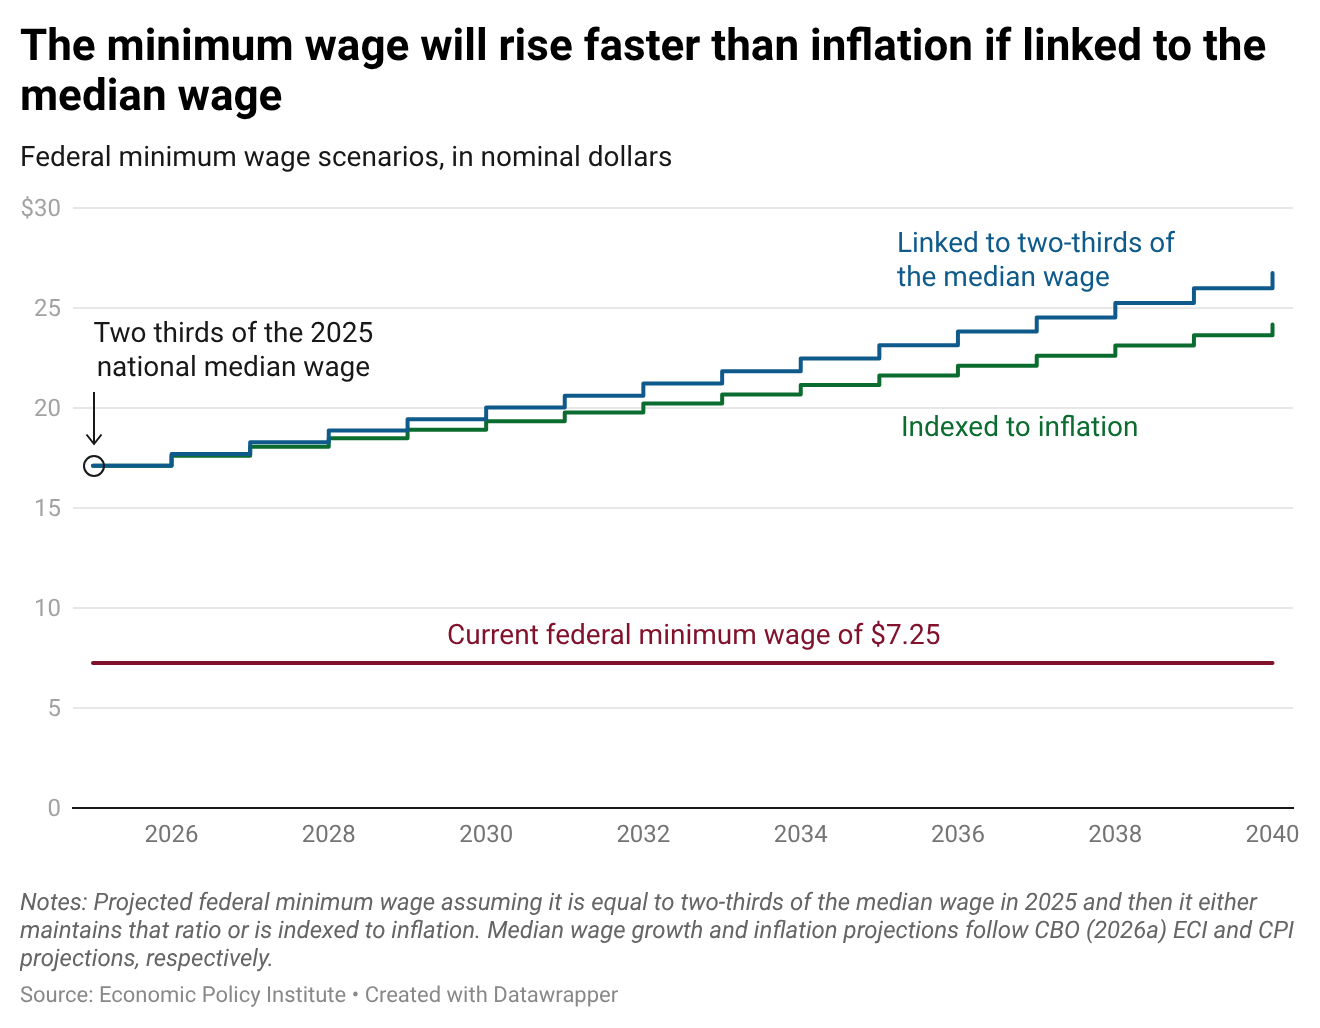
Nineteen states and the District of Columbia index their minimum wages to inflation, but Connecticut goes further by indexing to average wage growth and capturing the real gains that wage growth typically delivers above prices. Congress should follow Connecticut’s lead and link the federal minimum to the national median wage. Of course, indexing to price inflation would be an enormous improvement to current federal minimum wage policy and to state and local minimum wage policies that have also failed to implement automatic increases. Tying the minimum wage to median wages—i.e., indexing the minimum to typical workers’ wage growth—would yield even larger increases over time.
Tying the federal minimum to two-thirds of the median would also durably narrow inequality in the bottom half of the wage distribution. Whenever the minimum wage fails to keep pace with economy-wide wage growth, the gap between low and median earners widens. But a substantial increase in the minimum to a fixed ratio of the median shrinks and bounds that gap by construction. The gains disproportionately affect Black workers and women, who are overrepresented in low-wage jobs due to persistent racism and sexism (Banks 2019). Minimum wages are a major determinant of Black-white wage gaps (Derenoncourt and Montialoux 2020; Wursten and Reich 2023), and the long erosion of the federal minimum was a leading driver of widening pay inequality among women (Autor, Manning, and Smith 2016).
The state of minimum wage research and new policies
Minimum wages and job losses
A federal benchmark of two-thirds of the national median would significantly raise wages, and recent research strongly supports the conclusion that ambitious minimum wage targets work as intended, with little to no employment downsides. Across more than three decades of modern economic research, the median estimated employment effect is small; among studies that look at all low-wage workers rather than narrow subgroups, the effect is essentially zero (Zipperer 2024). The recurring scare stories about job losses are not borne out by the body of evidence.
Businesses adjust to higher minimum wages through what Dube (2026b) and Bernstein (2013) call the “Three P’s”: productivity, prices, and profits.2 Take productivity first. Higher wages reduce the rate at which workers quit, particularly in high-turnover sectors like restaurants and retail. That lowers hiring and training costs and means employment levels can hold steady even as new hiring slows. Better-paid workers, and workers with longer tenure, are also typically more productive, further offsetting the cost of the wage increase.
The minimum wage also redistributes income to low-wage workers when employers cover higher labor costs through reduced profits or modestly higher prices. Vergara (2026) and Coviello, Deserranno, and Persico (2022) both find that minimum wage increases shrink profits in low-wage industries. Price pass-through is small in aggregate terms because low-wage workers’ earnings are only a fraction of total labor costs, which are themselves a fraction of total business expenses. California’s $4 overnight increase in the fast-food minimum generated a one-time increase in fast-food prices of 2.1% to 3.6% (Sosinskiy and Reich 2026; Clemens et al. 2026). To put that in context: The price of a $6.00 hamburger would have risen to about $6.17.
How high is too high?
A common way to measure the level of a given minimum wage is to use the minimum-to-median wage ratio. Sometimes called the Kaitz index, the minimum-to-median wage ratio compares the minimum with the underlying distribution of wages by measuring the share of the typical wage that the floor reaches. This report proposes setting that ratio at about 67%. Most of the U.S. evidence base reflects periods when the ratio sat well below that level, because until recently, U.S. minimum wages were rarely considered high by today’s standards. But a growing body of recent research, together with recent state and local policies, has pushed the evidence into higher ratios—and the results are the same: There is substantial room for higher minimums without large employment losses.
Cengiz et al. (2019) found no negative employment effects at minimum-to-median ratios up to 59%. Dube and Lindner (2021), studying city-level minimum wages with ratios averaging 58% to 64%, found small and statistically insignificant effects. Godoy and Reich (2022) found no employment effect across localities with ratios ranging from 56% to 82%. And the 1968 federal minimum, which reached roughly 61% of the median,3 has been reexamined in two recent studies that likewise found small or no employment effects (Bailey, DiNardo, and Stuart 2021; Derenoncourt and Montialoux 2021).
The most direct evidence that the floor can go meaningfully higher comes from California’s $20 fast-food minimum wage. In April 2024, the state raised the wage for fast-food chain workers from $16 to $20, pushing the ratio of that minimum to the state’s median wage to about 74%, well above most U.S. precedents.4 One might worry that customers would substitute toward lower-priced independent restaurants exempt from the policy, generating job losses at the chains. The actual evidence shows otherwise. Despite the large wage increase, research finds little to no employment effect of the policy (Bivens and Zipperer 2026), and the median employment effect in Dube (2026a) is essentially zero. Evaluations of the UK minimum wage through 2019, when it reached nearly 60% of the median wage, also find small, statistically insignificant effects on the employment of low-wage workers (Giupponi et al. 2024).
A federal benchmark set at two-thirds of the national median will push some states above two-thirds of their own median wage. There is good reason to be optimistic about employment changes there as well. The studies above already span a wide range of Kaitz ratios, from the high 50s through the low 80s, and consistently find little or no employment effect. California’s $20 fast-food minimum extends this evidence to a 74% state-level ratio with essentially no employment losses, and only five states would have a minimum-to-median wage ratio above that threshold under the proposed federal benchmark. And while the minimum wage would be at a higher level relative to the state median in those states, it would still be less than a “living wage” for many families in those areas, as I discuss later.
Even if some employment loss does occur, that is not the right test of policy success. Low-wage labor markets are dominated by job-to-job churn, so reduced employment in response to a higher minimum typically shows up as longer gaps between jobs rather than workers permanently shut out of the labor market (Cooper, Mishel, and Zipperer 2018). On net, low-wage workers come out ahead in annual earnings when significantly higher hourly pay more than offsets a modest increase in unemployment.
Policymakers and organizers campaigning for minimum wage increases have considerable room to maneuver above the current federal floor before needing to worry about job losses. To assuage concerns about employment impacts, a federal proposal could be structured to limit annual increases of the federal minimum wage so that they never exceed two-thirds of the national median wage. States and localities, of course, can and should continue to push for higher minimum wages, as many will have higher median wages and costs of living than the national average.
Existing proposals and policies reaching two-thirds of the median
Some recent federal proposals already target or are consistent with the two-thirds benchmark. The recent Give America a Raise Act would raise the federal minimum to $20 by 2029, close to this report’s projection of two-thirds of the 2029 median wage ($19.44). The Living Wage for All Act names the two-thirds benchmark explicitly and locks in indexation in statute: “once the minimum wage equals two-thirds of the national median hourly wage, it shall thereafter be automatically adjusted each year to maintain that ratio.” The Bold Economic Program for America (Reich 2026) likewise proposes $20 by 2030, and Oakford (2026) embeds the two-thirds target in a broader portfolio that includes just cause protections and stronger wage theft enforcement.
The benchmark also aligns U.S. policy with international practice. The UK Low Pay Commission has targeted two-thirds of the median for the National Living Wage since 2024, and in the EU, 17 of 22 countries benchmark their statutory minimum wages to a ratio of the median or average wage. The 2022 European Union Minimum Wage Directive obligates member states to use “indicative reference values”—such as 60% of the gross median wage—to assess adequacy of their wage standards (Luebker and Schulten 2026).
Some of these international benchmarks may look numerically lower than two-thirds, but they are usually defined against a different denominator. Germany, for instance, benchmarks against the median wage of full-time workers. In the United States, the full-time median is about 10% higher than the overall median, so 60% of the full-time median is roughly equivalent to two-thirds of the overall median that this report proposes.
Implementing a minimum wage equal to two-thirds of the median wage
Any federal legislation will need a phase-in period, but it must specify two things: a clear path to the target and an explicit guarantee that automatic median wage indexing kicks in once the floor reaches two-thirds of the median.
Implementing the benchmark also requires choosing a wage source. Legislation should designate the Department of Labor (DOL)—which already publishes median wage estimates through the Bureau of Labor Statistics (BLS) Occupational Employment and Wage Statistics (OEWS)—to publish the official median wage each year. DOL has two ready sources: OEWS, an establishment survey, and the Current Population Survey (CPS), the household survey already used to produce the unemployment rate, which collects detailed wage and hours data.
Each source has tradeoffs. The CPS is timelier, with wage data available at a one- to two-month lag, but smaller samples, the difficulty of computing hourly earnings for salaried workers, and respondents’ tendency to round wages all introduce noise. OEWS uses an established BLS hourly wage methodology and median wage calculation that may be less volatile, but it is published with a one-year lag and pools data from earlier, lower-wage years. DOL could pick one source or use a weighted average; recent data show only about a $1 difference between the two surveys.5 Either way, expanding resources at BLS and the Census Bureau would strengthen the underlying data and support further refinements to the methodology.
Once DOL has a baseline median, indexing requires projecting that median forward to the year the new minimum takes effect. The UK Low Pay Commission, which recommends a two-thirds median target to the UK government, offers a useful template: It estimates a midyear median wage by combining lagged historical data with timely indicators and short-run forecasts (Low Pay Commission 2024). A concrete schedule illustrates the approach. To set the minimum for January 1, 2030, DOL would announce the new wage on July 1, 2029, six months in advance, based on its best projection of the July 2030 median, the midyear point representative of the median wage workers will face on average throughout 2030. The projection would proceed in three steps: compute the 2028 median from CPS or OEWS data; roll it forward to early-to-mid-2029 using a combination of available data—like the Current Employment Statistics, the Consumer Price Index, and the Employment Cost Index (ECI); and then roll it forward one more year using short-run wage projections like those in the CBO Budget and Economic Outlook (2026).
National and state effects of a federal minimum wage at two-thirds of the median
To estimate the economic benefits of a federal minimum wage set at two-thirds of the median wage, I model how many low-wage workers would see higher pay under this policy. I assume the policy is phased in over five years, so that if it went into effect today, the federal minimum would reach two-thirds of the median in 2030 and then automatically adjust each year to maintain that ratio.
Concretely, I assume the federal minimum rises to $12 immediately in 2026 and then increases incrementally to $20 in 2030, which is about two-thirds of the projected national median wage.6 Legislation should build in a path adjustment if 2030 median wages come in higher or lower than projected.
I focus on the effects in 2030. I assume the same phase-in path and automatic indexing applies to the federal tipped minimum wage, which has been frozen at $2.13 per hour since 1991.7 Wages elsewhere are assumed to grow in line with CBO ECI projections from 2026 to 2030, and the model incorporates the effects of scheduled state-level minimum wage increases (see the appendix for details).
In 2030, a federal minimum wage equal to two-thirds of the national median would raise pay for 39.6 million workers, about 1 in 4 of the wage-earning workforce (Table 1).8 Annual earnings would rise substantially, and the gains would be largest for Black workers: A full-time, full-year Black worker affected by the increase would earn about $5,000 more per year, compared with $4,400 for all affected workers. In line with other minimum wage increases, women would gain more than men, with 31% of women seeing higher pay compared with 23% of men.
Adults ages 20 and over would make up 9 in 10 affected workers (teens would have the largest share of affected workers of any age group, but they make up a small share of total employment). The problem of low pay is far from limited to the youngest workers.
TABLE 1
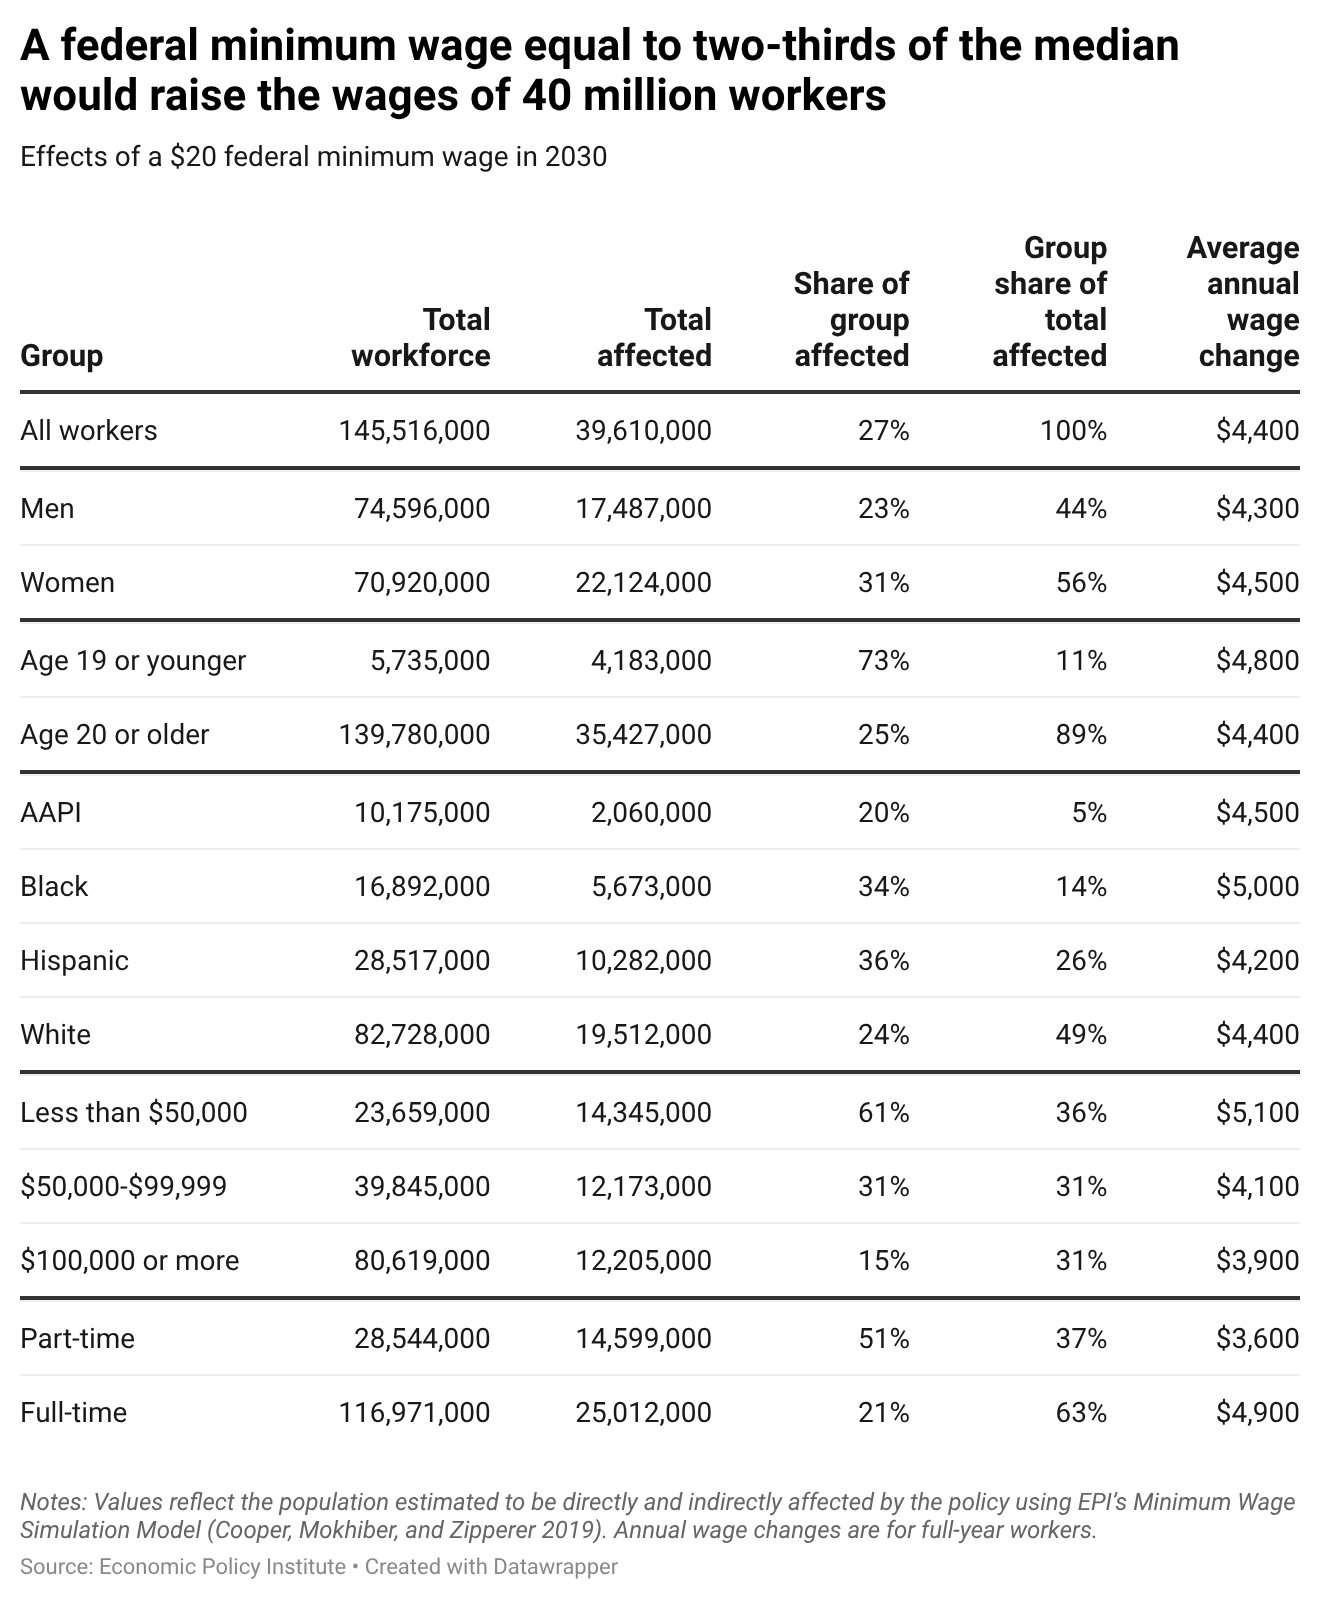
TABLE 1
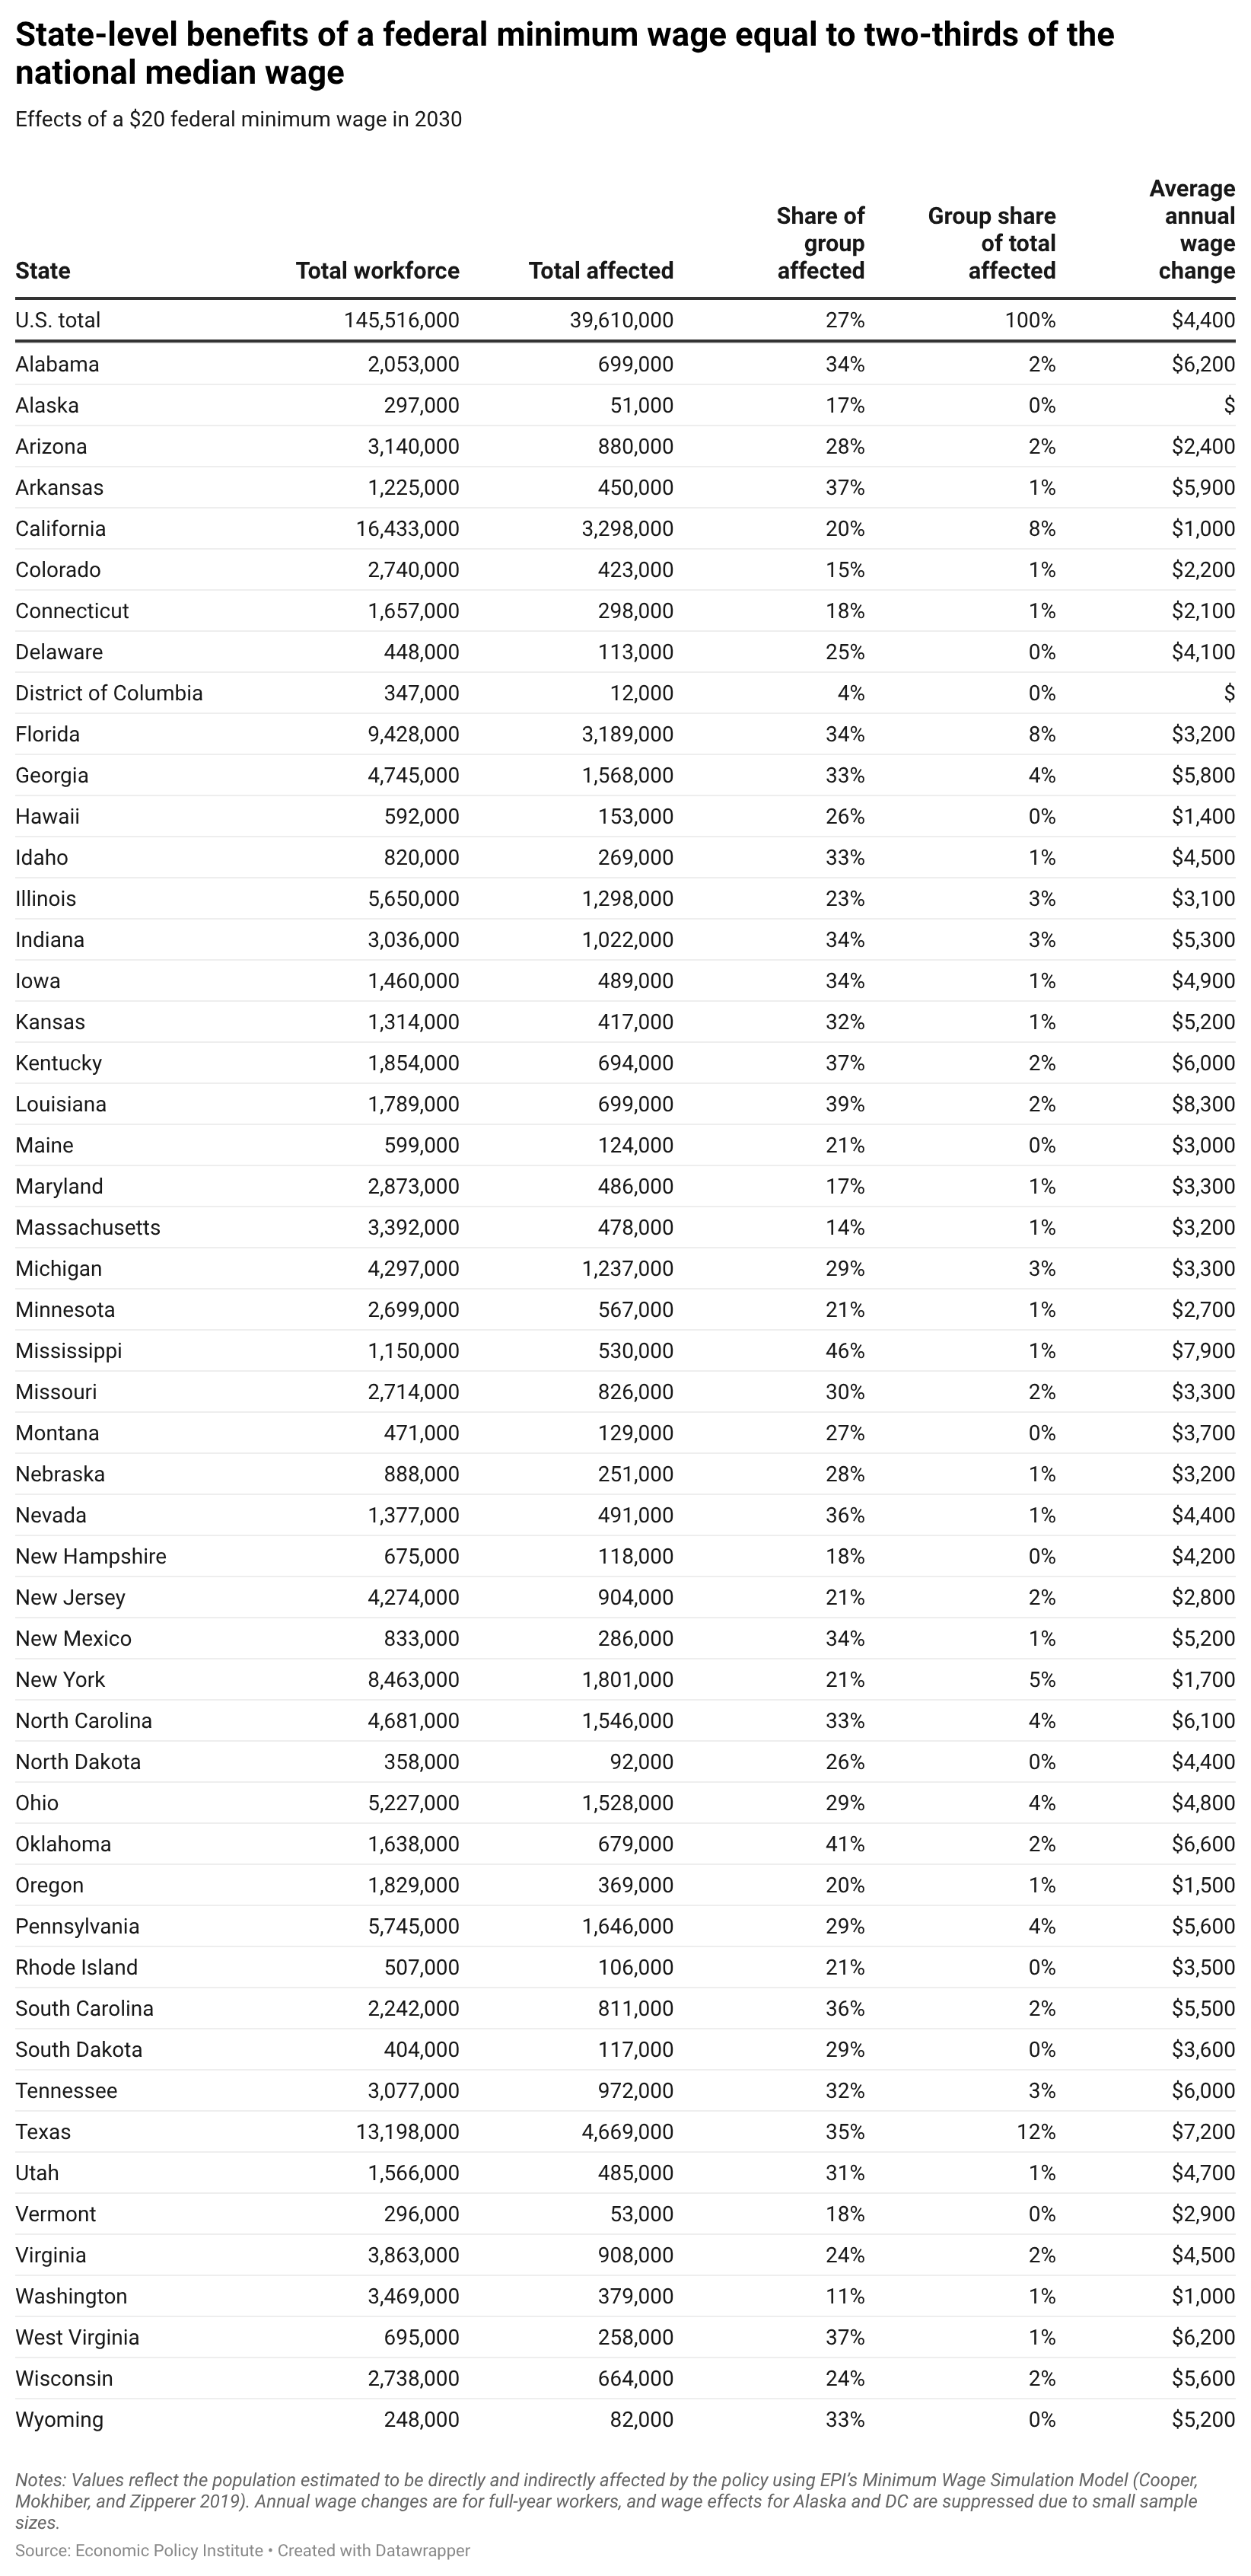
Although several states with scheduled minimum wage increases will see the gap between their minimum wage and the new federal floor shrink, workers in every state would still be affected (Figure C). With the exception of D.C., no state’s scheduled 2030 minimum wage reaches $20. The largest gains go to workers in the 20 states still tied to $7.25: 1 in 3 (33%) would see a raise, and annual pay for those affected would rise by about $6,200 on a full-time, full-year basis.
A federal minimum at two-thirds of the median wage would benefit workers in every state: Share of workers affected by a $20 federal minimum wage in 2030
| State | Share affected | Total affected | Average annual wage change |
|---|---|---|---|
| Alabama | 34.1% | 699,000 | $6,200 |
| Alaska | 17.1% | 51,000 | NA |
| Arizona | 28.0% | 880,000 | $2,400 |
| Arkansas | 36.7% | 450,000 | $5,900 |
| California | 20.1% | 3,298,000 | $1,000 |
| Colorado | 15.4% | 423,000 | $2,200 |
| Connecticut | 18.0% | 298,000 | $2,100 |
| Delaware | 25.3% | 113,000 | $4,100 |
| Washington D.C. | 3.5% | 12,000 | NA |
| Florida | 33.8% | 3,189,000 | $3,200 |
| Georgia | 33.0% | 1,568,000 | $5,800 |
| Hawaii | 25.9% | 153,000 | $1,400 |
| Idaho | 32.8% | 269,000 | $4,500 |
| Illinois | 23.0% | 1,298,000 | $3,100 |
| Indiana | 33.7% | 1,022,000 | $5,300 |
| Iowa | 33.5% | 489,000 | $4,900 |
| Kansas | 31.7% | 417,000 | $5,200 |
| Kentucky | 37.4% | 694,000 | $6,000 |
| Louisiana | 39.1% | 699,000 | $8,300 |
| Maine | 20.6% | 124,000 | $3,000 |
| Maryland | 16.9% | 486,000 | $3,300 |
| Massachusetts | 14.1% | 478,000 | $3,200 |
| Michigan | 28.8% | 1,237,000 | $3,300 |
| Minnesota | 21.0% | 567,000 | $2,700 |
| Mississippi | 46.1% | 530,000 | $7,900 |
| Missouri | 30.4% | 826,000 | $3,300 |
| Montana | 27.3% | 129,000 | $3,700 |
| Nebraska | 28.3% | 251,000 | $3,200 |
| Nevada | 35.6% | 491,000 | $4,400 |
| New Hampshire | 17.5% | 118,000 | $4,200 |
| New Jersey | 21.1% | 904,000 | $2,800 |
| New Mexico | 34.4% | 286,000 | $5,200 |
| New York | 21.3% | 1,801,000 | $1,700 |
| North Carolina | 33.0% | 1,546,000 | $6,100 |
| North Dakota | 25.7% | 92,000 | $4,400 |
| Ohio | 29.2% | 1,528,000 | $4,800 |
| Oklahoma | 41.4% | 679,000 | $6,600 |
| Oregon | 20.2% | 369,000 | $1,500 |
| Pennsylvania | 28.6% | 1,646,000 | $5,600 |
| Rhode Island | 20.9% | 106,000 | $3,500 |
| South Carolina | 36.2% | 811,000 | $5,500 |
| South Dakota | 28.9% | 117,000 | $3,600 |
| Tennessee | 31.6% | 972,000 | $6,000 |
| Texas | 35.4% | 4,669,000 | $7,200 |
| Utah | 31.0% | 485,000 | $4,700 |
| Vermont | 17.9% | 53,000 | $2,900 |
| Virginia | 23.5% | 908,000 | $4,500 |
| Washington | 10.9% | 379,000 | $1,000 |
| West Virginia | 37.1% | 258,000 | $6,200 |
| Wisconsin | 24.2% | 664,000 | $5,600 |
| Wyoming | 32.9% | 82,000 | $5,200 |

Note: Values reflect the population estimated to be directly and indirectly affected by a $20 minimum wage in 2030. Annual wage changes are for full-year workers, and wage effects for Alaska and DC are suppressed due to small sample sizes.
Source: EPI Minimum Wage Simulation Model (Cooper, Mokhiber, and Zipperer 2019).
Beyond who gets a raise and how much, a related question is whether the raise is enough to cover a family’s basic costs. Setting a target of two-thirds of the median would push the federal floor much closer to a living wage for many families. What counts as a living wage varies across the country, depending on local costs and on family size and composition. EPI’s Family Budget Calculator thresholds make this concrete: They calculate the income a given family type needs in a given place to afford a “modest but adequate” standard of living. For example, in 2025 a two-adult, one-child family in Los Angeles County, California, needed about $118,000 in annual pretax earnings to pay for housing, food, child care, transportation, health care, taxes, and other necessities. In more rural Early County, Georgia, a similar family needed about $74,000. These budgets are minimal by design, with no allowance for savings, emergencies, retirement, college, or entertainment.
Of course, other business income and government provided social benefits can lower the amount of labor market earnings a family needs to maintain the same standard of living. Gould, Mokhiber, and deCourcy (2024) report that, according to Congressional Budget Office data, about 81% of a middle-income family’s budget is met by labor market income.
Applying that 81% adjustment to EPI’s Family Budget Calculator thresholds gives a more useful benchmark for what wages need to deliver. Under this adjusted measure, the Los Angeles County family would have needed about $96,000 in earnings to meet their 2025 budget, equivalent to both adults working full time, year round at about $23 per hour. The Early County family would have needed about $60,000, equivalent to both adults working full time, year round at $15 per hour.
The implications for everyday affordability are significant. After inflating these adjusted thresholds to 2030 dollars using CBO Consumer Price Index projections, a federal minimum at two-thirds of the median substantially closes the gap between full-time annual earnings and necessary expenses for low-wage workers and their families. A single adult working full time at the 2030 minimum of $20 would cover modest but adequate expenses in half of U.S. counties. Two full-time working parents with two children would meet their family budget in roughly a quarter of U.S. counties. Using similar thresholds, Oakford (2026) finds that a federal minimum at two-thirds of the national median in 2025 would be “90% to 99% of the median living wage of a single adult without children in 16 states.”
A federal minimum tied to two-thirds of the national median would therefore make enormous progress in increasing affordability and helping families make ends meet. Closing the remaining gaps will require a broader set of policies, including strengthening other labor standards like overtime protections and their enforcement, a more robust safety net, expanded public goods like universal health insurance, fewer barriers to unionization, and a renewed commitment to full employment.
Conclusion
The federal minimum wage is at its lowest real value in 77 years, and tens of millions of low-wage workers are paying for that erosion every paycheck. Pegging the federal floor to two-thirds of the national median wage, and maintaining that ratio, would correct the two flaws that have left the floor unfit for purpose: a level too low to function as a meaningful wage standard and a structure that does not adjust as the economy grows.
A federal minimum at two-thirds of the median would raise pay for nearly 40 million workers in 2030, deliver the largest gains to Black workers and to women, and bring the floor close to a living wage in much of the country. Decades of research, recent state and local experience, and California’s $20 fast-food minimum all point to the same conclusion: The labor market can absorb minimum wages of this size with little to no employment cost. The benchmark also brings U.S. policy into line with the UK and most of the EU, where two-thirds-style targets are now standard practice.
A higher floor cannot, on its own, guarantee economic security for working people. That will require a broader agenda: a stronger safety net, expanded public goods, fewer barriers to unionization, and a renewed commitment to full employment. But updating the federal minimum to a modern, indexed benchmark is the single most direct step Congress can take to raise wages at the bottom, and the only step that reaches the 55 million workers in the 20 states still stuck at $7.25.
Appendix
State benefits
APPENDIX TABLE 1
APPENDIX TABLE 1
Methodology
Underlying wages are based on the 2025 Current Population Survey and between 2025 and 2030. I assume wages increase at the rate of CBO (2026a) ECI projections and because of future state-level minimum wages. Due to the Trump administration’s immigration policies and the possibility of continued labor market weakening, how the baseline level of employment grows over the next five years is very uncertain. For simplicity, I hold the estimated employment level constant between 2025 and 2030 instead of making additional assumptions about either employment rates or population growth. In terms of total population growth, this assumption may not be too far off the mark of current projections; CBO (2026b), for example, estimates that between 2025 and 2030, the civilian population ages 16 to 64 will only grow by 0.06%, or 130,000 people.
Affected workers include those “directly” affected, whose wages would otherwise be less than the new federal minimum wage, as well as “indirectly” affected workers who earn up to 115% of the new minimum (Cooper, Mokhiber, and Zipperer 2019). These particular estimates may overstate the number of workers affected because while they incorporate already scheduled state-level increases, they exclude city-level minimum wage increases, and some cities will have higher than $20 minimum wage standards in 2030. On the other hand, if the labor market continues to weaken, low-wage workers will, in the absence of minimum wages, face slower than usual wage growth because their wage growth slows disproportionately when unemployment is higher (Bivens and Zipperer 2018).
Notes
1. These projections follow CBO ECI and CPI projections from 2025–2036, and for subsequent years assume 2026–2035 annual growth rates of 2.26% for CPI and 2.94% for ECI.
2. For additional discussion, see Dube and Lindner (2025), Schmitt (2013), and Zipperer (2023).
3. OECD (2026) estimated the U.S. minimum-to-median wage for full-time workers was 55.05% in 1968. Assuming a 10% premium for the full-time median wage relative to the overall median wage results in a minimum-to-median wage ratio of 60.56%.
4. In April 2024, the state raised the wage for fast-food chain workers from $16 to $20, pushing the ratio of that minimum to the state’s median wage to about 74%, well above most U.S. precedents.
5. The 2024 OEWS national median wage (which is the latest available data) was $23.80 (BLS 2025). The EPI State of Working America Data Library (EPI 2026b), which uses CPS wage data and which we use for wage levels throughout this paper, reports a 2024 median wage of $24.87.
6. The exact schedule simulated below is $12 in 2026, $13.50 in 2027, $15.50 in 2028, $17.50 in 2029, and $20 in 2030.
7. Ideally other subminimum wages would be phased out, including those for some workers with disabilities and youth workers. I do not model the effects of those changes due to data constraints.
8. I concentrate on the effects in 2030. Were low-wage workers’ wages to grow slower (or faster) than median wages, these estimates would understate (or overstate) the effects in later years.
References
Banks, Nina. 2019. “Black Women’s Labor Market History Reveals Deep-Seated Race and Gender Discrimination.” Working Economics Blog (Economic Policy Institute), February 19, 2019.
Bernstein, Jared. 2013. “If Increasing the Minimum Wage Doesn’t Cost Jobs, How Does It Get Absorbed?” Huffington Post, August 14, 2013.
Bivens, Josh, and Ben Zipperer. 2018. The Importance of Locking in Full Employment for the Long Haul. Economic Policy Institute, August 2018.
Bureau of Labor Statistics (BLS). 2025. “Occupational Employment and Wage Statistics (OEWS) Tables, May 2024” [Excel file], Occupational Employment and Wage Statistics. Accessed May 13, 2026.
Clemens, Jeffrey, Olivia Eduwards, Jonathan Meer, and Joshua D. Nguyen. 2026. “The Effects of Calfornia’s $20 Fast Food Minimum Wage on Prices.” National Bureau of Economic Research Working Paper no. 34990, March 2026.
Congressional Budget Office (CBO). 2026a. The Budget and Economic Outlook: 2026 to 2036. February 11, 2026.
Congressional Budget Office (CBO). 2026b. The Demographic Outlook: 2026 to 2056. January 7, 2026.
Cooper, David, Zane Mokhiber, and Ben Zipperer. 2019. Minimum Wage Simulation Model Technical Methodology. Economic Policy Institute, February 2019.
Coviello, Decio, Erika Deserranno, and Nicola Persico. 2022. “Minimum Wage and Individual Worker Productivity: Evidence from a Large US Retailer.” Journal of Political Economy 130, no. 9: 2315–2360.
Derenoncourt, Ellora, and Claire Montialoux. 2021. “Minimum Wages and Racial Inequality.” Quarterly Journal of Economics 136, no. 1 (February): 169–228.
Dube, Arindrajit. 2026a. “Labor Market Effects of California’s $20 Fast-Food Minimum Wage.” National Bureau of Economic Research Working Paper no. 35171, May 2026.
Dube, Arindrajit. 2026b. The Wage Standard: What’s Wrong in the Labor Market and How to Fix It. New York: Penguin Random House.
Dube, Arindrajit, and Attila S. Lindner. 2024. “Minimum Wages in the 21st Century.” In Handbook of Labor Economics, Volume 5, edited by Christian Dustmann and Thomas Lemieux.
Economic Policy Institute (EPI). 2026a. Minimum Wage Tracker. Accessed May 5, 2026.
Economic Policy Institute (EPI). 2026b. State of Working America Data Library. Accessed May 5, 2026.
Giupponi, Giulia, Robert Joyce, Attila Lindner, Tom Waters, Thomas Wernham, and Xiaowei Xu. 2024. “The Employment and Distributional Impacts of Nationwide Minimum Wage Changes.” Journal of Labor Economics 42, no. S1: S293–S333.
Hickey, Sebastian, and Ismael Cid-Martinez. 2025. “The Federal Minimum Wage is Officially a Poverty Wage in 2025.” Working Economics Blog (Economic Policy Institute), April 28, 2025.
Low Pay Commission. 2024. “What Will the Minimum Wage Be Next Year?” (blog post). April 19, 2024.
Oakford, Patrick. 2026. Federal Employment Standards as the Foundation of Economic Security: Revisiting Minimum Wage, Just Cause, and Tools to Combat Wage Theft. Roosevelt Institute, May 2026.
Organisation for Economic Co-operation and Development (OECD). 2026. OECD Data Explorer. Accessed May 5, 2026.
Reich, Michael. 2026. The Unexpected Effects of a $20 Federal Minimum Wage. Center on Wage and Employment Dynamics, February 2026.
Reich, Michael, and Denis Sosinskiy. 2026. “Effects of a $20 Minimum Wage: Evidence from Granular Data on Wages, Employment, and Prices.” Institute for Research on Labor and Employment Working Paper, April 1, 2026.
U.S. Congress. Senate. Committee on Education and Labor. 1937. Fair Labor Standards Act of 1937. S. Rep. No. 884, 75th Cong., 1st Sess. Washington, DC: Government Printing Office.
Wursten, Jesse, and Michael Reich. 2023. “Racial Inequality in Frictional Labor Markets: Evidence from Minimum Wages.” Labour Economics 82, 102344.